

Summary
Alcoholic cirrhotics evaluated for liver transplantation are frequently malnourished or obese. We analyzed alcoholic cirrhotics undergoing transplantation to examine time trends of nutrition/weight, transplant outcome, and effects of concomitant hepatitis C virus (HCV) and/or hepatocellular carcinoma (HCC). Nutrition and transplant outcomes were reviewed for alcoholic cirrhosis with/without HCV/HCC. Malnutrition was defined by subjective global assessment. Body mass index (BMI) classified obesity. A total of 261 patients receiving transplants were separated (1988–2000, 2001–2006, and 2007–2011) to generate similar size cohorts. Mean BMI for the whole cohort was 28 ± 6 with 68% classified as overweight/obese. Mean BMI did not vary among cohorts and was not affected by HCV/HCC. While prevalence of malnutrition did not vary among cohorts, it was lower in patients with HCV/HCC (P < 0.01). One-year graft/patient survival was 90% and not impacted by time period, HCV/HCC, or malnutrition after adjusting for demographics and model end-stage liver disease (MELD). Alcoholic cirrhotics undergoing transplantation are malnourished yet frequently overweight/obese. Among patients selected for transplantation, 1-year post-transplant graft/patient survival is excellent, have not changed over time, and do not vary by nutrition/BMI. Our findings support feasibility of liver transplantation for alcoholic cirrhotics with obesity and malnutrition.
Keywords: alcoholic liver disease, hepatitis C virus, hepatocellular carcinoma, malnutrition, mortality, orthotopic liver transplantation
Introduction
Malnutrition is prevalent in patients with liver disease, especially those with alcoholic cirrhosis who were typically described as cachetic in the 1980s [1–3]. Over the last two decades, prevalence of obesity has increased in the general population and especially in patients undergoing liver transplant [4–7]. Both malnutrition and obesity have been viewed as risk factors for clinical decompensation, mortality, and surgical interventions among these patients [3,8,9]. In light of recent publications supporting a greater role for liver transplantation in alcoholic cirrhosis [10–12], the role of malnutrition and obesity in these patients on liver transplantation outcome requires further attention.
Outcomes after liver transplantation for alcoholic cirrhosis are reported to be similar to other diseases and better than hepatitis C virus (HCV) infection leading to wider acceptance and increased transplantation for alcoholic cirrhosis [10,13]. We hypothesized that alcoholic cirrhosis patients undergoing liver transplantation are now more obese and less cachectic. However, data are lacking on the changes in body mass index (BMI) and nutritional status over time among patients with alcoholic cirrhosis undergoing liver transplantation. Data are also lacking on the association of changes in nutritional status of alcoholic cirrhotics undergoing liver transplantation with the post-transplantation graft and patient survival. Therefore, we performed this retrospective study aiming to i) study time trends of weight and nutritional status of patients with alcoholic cirrhosis evaluated for liver transplantation, ii) examine the association of these changes with 1-year post-transplant graft and patient survival, and iii) examine the impact of concomitant HCV and or hepatocellular carcinoma (HCC) on the nutritional status of these patients.
Experimental procedures
Study population
Transplant database at the Mayo Clinic (1988–2011) was queried for patients transplanted with a primary or secondary diagnosis of alcoholic cirrhosis as recorded in the transplant database at our center. Inclusion criterion included a documented history of alcohol use of ≥50 g/d in males and ≥30 g/d in females for more than 5 years. Patients with concomitant HCV and or HCC were noted and categorized distinctly.
Data extraction
Medical charts of eligible patients were reviewed for patient demographics (age in years and gender); dates of listing and receiving transplant, amount and duration of alcohol use, model end-stage liver disease (MELD) score labs (serum bilirubin, international normalized ratio or INR, and serum creatinine) within 1 month prior to receiving transplant, and 1-year graft/patient survival. Details for nutritional parameters including anthropometric measurements were extracted and calculated as discussed below.
Nutritional assessment
Body mass index was calculated from the retrieved data on height/weight and classified according to standard World Health Organization nomenclature as <18.5 (underweight), 18.5–24.9 (normal), 25–29.9 (overweight), 30–34.9 (class I obesity), 35–39.9 (class II obesity), and 40 or above (class III obesity).
Mid arm circumference was measured at a point midway between acromion and medial epicondyle of humerus [14].
Triceps skinfold thickness measured at the same location using Lange Skinfold Caliper (Cambridge Scientific Industries, Inc., Cambridge, MD, USA) [14].
Hand grip strength was measured using Jamar handgrip dynamometer (J.A. Preston Co, Jackson, MI, USA) [15].
Arm muscle circumference was calculated as mid arm circumference – (triceps skinfold thickness × 0.314) [16].
Bedside subjective global assessment (SGA) score (0, 1, 2, 3) was retrieved and patients were classified as well nourished (0), mild malnutrition (1), moderate malnutrition (2), or severe malnutrition (3), respectively [17]. Patients were also considered to be malnourished with arm muscle circumference of <5th percentile or hand grip strength of 2 standard deviation (SD) below the mean as determined from norms among age- or gender-matched general population. In addition, patients with hand grip <30 kg and arm muscle circumference <23 cm were considered malnourished; this criterion has been validated at our center earlier with 94% sensitivity and 97% negative predictive value [15,16,18]. Nutritional status in this study was assessed by estimation of body cell mass using isotope dilution technique [18].
Statistical analyses
To examine the trends over time, data were divided into 1988–2000, 2001–2006, and 2007–2010 to generate similar numbers of patients in the three time periods. Nutritional parameters at the time of listing for liver transplantation were compared in the three time periods with 1988–2000 as the reference. To examine association of HCV and/or HCC with the nutritional status, data were divided into four groups: alcoholic cirrhosis alone (reference group), alcoholic cirrhosis with HCV, alcoholic cirrhosis with HCC, and alcoholic cirrhosis with both HCV and HCC. Kaplan–Meier curves were generated to evaluate effects of HCV/HCC, nutritional status, and obesity on 1-year survival. We also evaluated for length of hospital stay, occurrence of infection mortality during the hospital stay after liver transplantation. Cox proportional hazard regression analysis models were built to determine predictors of graft and patient survival at 1 year. Causes of graft loss and patient mortality were compared between these groups. Chi-squared or Fisher exact tests were used for comparing categorical variables. For continuous variables, t-tests and multiple analysis of variance tests were used for comparing two groups and more than two groups, respectively. All the statistical analyses were performed using the Statistical Analysis Software (SAS Institute, Cary, NC, USA). P-value < 0.05 was considered significant and was adjusted using Bonferroni adjustment to <0.025 for two comparisons and <0.017 for three comparisons.
Results
Baseline characteristics
A total of 261 patients (77 during 1988–2000, 86 during 2001–2006, and 98 during 2007–2011) with a primary or secondary diagnosis of alcoholic cirrhosis were transplanted at our center. Yearly distribution of these patients is shown in Figure 1. Patients undergoing transplantation for alcoholic cirrhosis were most commonly males in their sixth decade (Table 1). Baseline characteristics were similar during the three time periods for amount of alcohol drinking, serum albumin, and serum sodium. Although MELD scores were similar over time, a higher proportion of patients transplanted after 2000 were on dialysis at the time of transplantation (3% prior to 2001 vs. 14% after 2000; P = 0.015) (Table 1). Of the 261 patients, 129 (49%) had alcoholic cirrhosis alone and 132 (51%) had concomitant HCV and/or HCC (26% HCV, 12% HCC, and 13% both HCV and HCC). Mean patient age with concomitant HCC was 5–7 years higher compared with patients without HCC and mean patient age with concomitant HCV was 3 years lower compared with patients without HCV (Table 1). Proportion of males was higher with concomitant HCV and/or HCC compared with alcoholic cirrhosis alone (85–91% vs. 71%; P = 0.01). Mean MELD score was approximately seven points lower for patients with concomitant HCC compared with patients without HCC (Table 1).
Figure 1.
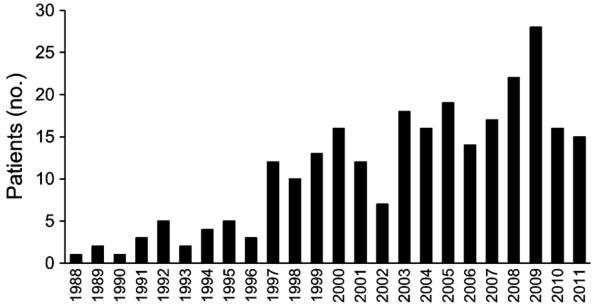
Yearly distribution of number of patients transplanted for alcoholic cirrhosis between 1988 and 2011.
Table 1.
Baseline characteristics of patients with alcoholic cirrhosis receiving liver transplantation: comparison over time and based on the presence or absence of concomitant hepatitis C virus (HCV) and/or hepatocellular carcinoma (HCC).
| Year groups |
Concomitant HCV and/or HCC |
|||||||||
|---|---|---|---|---|---|---|---|---|---|---|
| All (261) | 1988–2000 (77) | 2001–2006 (86) | 2007–2011 (98) | P | Alcohol (129) | With HCV (64) | With HCC (32) | With HCV+HCC (36) | P | |
| Age | 53 ± 8 | 50 ± 8 | 53 ± 8 | 55 ± 7 | 0.066 | 53 ± 8 | 50 ± 7 | 60 ± 6 | 55 ± 5 | <0.0001 |
| % Males | 206 (79) | 56 (73) | 74 (86) | 76 (78) | 0.1 | 91 (71) | 54 (84) | 28 (88) | 33 (92) | 0.009 |
| Alcohol g/d | 83 ± 57 | 89 ± 65 | 87 ± 54 | 74 ± 52 | 0.85 | 88 ± 61 | 83 ± 55 | 84 ± 63 | 63 ± 38 | 0.1 |
| Dialysis (%) | 28 (11) | 2 (3) | 14 (17) | 12 (13) | 0.015 | 20 (16) | 6 (9) | 2 (7) | 0 (0) | 0.044 |
| MELD | 19 ± 8 | 18 ± 7 | 19 ± 8 | 19 ± 8 | 0.045 | 21 ± 8 | 21 ± 9 | 14 ± 6 | 13 ± 4 | <0.0001 |
| Albumin | 3.3 ± 0.57 | 3.1 ± 0.56 | 3.3 ± 0.53 | 3.4 ± 0.58 | 0.39 | 3.2 ± 0.6 | 3.2 ± 0.6 | 3.3 ± 0.5 | 3.4 ± 0.5 | 0.47 |
| Sodium | 136 ± 5 | 136 ± 5 | 136 ± 5 | 136 ± 4 | 0.78 | 136 ± 5 | 136 ± 5 | 136 ± 5 | 137 ± 3 | 0.51 |
MELD, model end-stage liver disease.
Body Mass Index, anthropometric measurements, and malnutrition
Median BMI of alcoholic cirrhosis patients at the time of listing for transplantation was about 28 (range: 18–47) with no difference over time or among various groups (data not shown). About 68% of alcoholic cirrhosis patients undergoing transplantation were either overweight or obese with few patients at extremes of BMI (2% <18.5 and 4% ≥40). Proportion of patients in various BMI groups was also similar over time (Table 2). About 45% of patients with concomitant HCC had class I obesity compared with 15%, 25%, and 21% of alcoholic cirrhosis alone, alcoholic cirrhosis with HCV, and alcoholic cirrhosis with HCV and HCC, respectively (P = 0.049) (Table 2).
Table 2.
Body mass index (BMI) and subjective global assessment (SGA) of patients with alcoholic cirrhosis at the time of listing for liver transplantation: comparison over time and based on concomitant hepatitis C virus (HCV) and/or hepatocellular carcinoma (HCC).
| Year groups |
Presence of concomitant HCV and/or HCC |
||||||||||
|---|---|---|---|---|---|---|---|---|---|---|---|
| All (N = 261) | 1988–00 (N = 98) | 2001–06 (N = 86) | 2007–11 (N = 77) | P | AC (N= 129) | With HCV (N = 64) | With HCC (N = 32) | With HCV+HCC (N = 36) | P | ||
| BMI groups N (%) | <18.5 | 4 (2) | 0 | 1 (1) | 3 (4) | 0.6 | 4 (3) | 0 | 0 | 0 | 0.049 |
| 18.5–24.9 | 79 (30) | 30 (31) | 24 (28) | 25 (32) | 41 (32) | 25 (32) | 9 (28) | 8 (24) | |||
| 25–29.9 | 88 (34) | 29 (30) | 32 (36) | 27 (35) | 50 (38) | 17 (27) | 7 (22) | 14 (37) | |||
| 30–34.9 | 57 (22) | 20 (24) | 20 (24) | 13 (17) | 19 (15) | 17 (27) | 14 (44) | 7 (21) | |||
| 35–39.9 | 22 (8) | 10 (10) | 5 (6) | 7 (9) | 11 (9) | 6 (9) | 0 | 5 (15) | |||
| >40 | 11 (4) | 5 (5) | 3 (5) | 2 (3) | 2 (3) | 3 (5) | 2 (6) | 2 (3) | |||
| SGA groups N (%) | 0 | 41 (16) | 18 (18) | 15 (17) | 8 (11) | 0.06 | 8 (6) | 4 (6) | 12 (38) | 17 (47) | <0.0001 |
| 1 | 129 (50) | 48 (49) | 50 (58) | 31 (41) | 67 (52) | 34 (53) | 14 (43) | 15 (42) | |||
| 2 | 80 (30) | 28 (29) | 18 (21) | 34 (45) | 46 (36) | 24 (38) | 6 (19) | 4 (11) | |||
| 3 | 10 (4) | 4 (4) | 3 (4) | 3 (4) | 8 (6) | 2 (3) | 0 | 0 | |||
AC, alcoholic cirrhosis.
Among the patients with available data on anthropometric measurements, median arm muscle circumference was higher for patients with alcoholic cirrhosis and HCV compared with alcoholic cirrhosis alone (27.4 vs. 24.8; P = 0.005). Similarly, median hand grip was lower for patients with alcoholic cirrhosis alone compared with patients with alcoholic cirrhosis and HCV (30 vs. 38; P < 0.0001) and alcoholic cirrhosis with HCV and HCC (30 vs. 43; P < 0.0001) but not for patients with concomitant HCC (30 vs. 33; P = 0.15) (data not shown).
About 84% of patients were malnourished based on SGA (50% mild: SGA 1, 30% moderate: SGA 2, and 4% severe: SGA 3). Proportion of patients with malnutrition did not change over time as evaluated by SGA (Table 2). However, proportion of patients with SGA 1–3 was lower among alcoholic cirrhosis with HCC compared with alcoholic cirrhosis without HCC (56% vs. 95%; P < 0.0001) (Table 2). None of the patients with concomitant HCC had severe malnutrition. Similarly, a higher proportion of patients with alcoholic cirrhosis alone were malnourished based on hand grip < 2 SD compared with patients with concomitant HCV, concomitant HCC, and both HCV and HCC (76% vs. 51% vs. 55% vs. 26%; P < 0.0001) (data not shown).
Outcomes after liver transplantation
Post-transplant graft and patient survival at 1 year were over 90% and were similar for 2001–2006 and 2007–2011 as compared with 1988–2000 (Fig2 a–b) with HR (95% CI) of 1.05 (0.56–1.96) and 1.26 (0.60–2.69), respectively. Similarly, compared with alcoholic cirrhosis alone, outcomes were similar for alcoholic cirrhosis and HCV, alcoholic cirrhosis and HCC, and alcoholic cirrhosis with HCV and HCC [HR (95% CI):1.34 (0.73–2.46), 1.14 (0.48–2.75), and 2.00 (0.88–4.57), respectively] (data not shown). Other variables in the model such as age, gender, and MELD score also did not predict 1-year liver transplant (LT) outcomes. Outcomes were similar between malnourished and well-nourished patients as defined by SGA at the time of listing for or at the time of liver transplantation (Table 3). Inhospital mortality was around 3% (9 of 261) with no impact of SGA at the time of listing for liver transplantation (8/251 for SGA 0–2 vs. 1/10 for SGA 3; P = 0.25) or at the time of liver transplantation (8/226 vs. 1/35; P = 0.85). Length of hospital stay was longer for malnourished patients (SGA 3) compared with SGA 0–2, both at the time of listing (23 ± 2 vs. 12 ± 10 days; P = 0.007) and at the time of liver transplantation (29 ± 20 vs. 10 ± 10 days; P < 0.0001).
Figure 2.

One-year post liver transplant graft and patient survival among patients with alcoholic cirrhosis. Comparison over time (a–b): 1988–2000 (black dashed line) vs. 2001–2006 (gray dashed line) vs. 2007–2011 (black solid line). Results show that survival for respective time period are similar for graft (89% vs. 89% vs. 96%; Log Rank P = 0.18) and for patient (90% vs. 89% vs. 96%; P = 0.23).
Table 3.
Post liver transplantation graft and patient survival at 1 year based on nutritional assessment at the time of listing for transplantation.
| Graft survival (%) | Log rank | Patient survival (%) | Log rank | ||
|---|---|---|---|---|---|
| SGA | 0 (N = 41) | 93 | 95 | 0.47 | |
| 1 (N = 129) | 92 | 92 | |||
| 2 (N = 80) | 91 | 0.6 | 91 | ||
| 3 (N = 10) | 80 | 80 | |||
| BMI* | <18.5 (N = 4) | 75 | 75 | 0.031 | |
| 18.5–24.9 (N = 79) | 87 | 89 | |||
| 25–29.9 (N = 88) | 92 | 0.026 | 92 | ||
| 30–34.9 (N = 57) | 98 | 98 | |||
| 35–39.9 (N = 22) | 96 | 96 | |||
| 40 or more (N = 11) | 73 | 73 |
BMI, body mass index; SGA, subjective global assessment.
Patient survival rates were similar for BMI at the time of transplant controlled for ascitic fluid removed at transplant.
(BMI <18.5 vs. ≥ 40 vs. 18.5–39.9; 86% vs. 80% vs. 91%, respectively; Log Rank P = 0.61) and for SGA at the time of transplant.
(SGA 0 vs. 1 vs. 2 vs. 3 as 97% vs. 91 % vs. 92% vs. 85%; P = 0.36).
When analyzed for BMI at the time of listing for liver transplantation, patient survival rates were poor at extremes of BMI (<18.5 and ≥40) compared with patients with BMI 18.5–39.9 (Table 3; 75% and 73% vs. 93%, respectively; P = 0.018). For each liter of ascitic fluid, weight was adjusted for 1 kg, giving the BMI reading controlled for ascitic fluid. However, when outcomes were analyzed for BMI at the time of liver transplantation (n = 214) controlled for ascitic fluid removed at liver transplantation (for each liter of ascitic fluid removed, weight adjusted by 1 kg), patient survival was no longer different among respective groups (86% and 80% vs. 91%; Log Rank P = 0.61; data not shown in Table 3). Causes of death were not different among patients at extremes of BMI compared with other patients [overall causes of death within 1-year post-LT: operative (5), sepsis (5), graft-versus-host disease (2), pulmonary hypertension (2) hepato-pulmonary syndrome (1), recurrent metastatic malignancy (3), and severe HCV recurrence (2)].
Discussion
We have uncovered several key pieces of information in this analysis relevant to the role of nutrition in alcoholic cirrhosis patients undergoing liver transplantation: i) alcoholic cirrhosis patients listed and undergoing liver transplantation are frequently malnourished and yet concurrently overweight/obese, ii) contrary to our hypothesis, nutritional status and BMI of patients with alcoholic cirrhosis listed for liver transplantation did not change over time, and iii) alcoholic cirrhosis patients with concomitant HCV and/or HCC have less malnutrition compared with patients without concomitant disease. Furthermore, among patients selected for liver transplantation, post-transplant outcomes for liver graft and patient survival at 1 year are good, have not changed over time, and are not impacted by concomitant HCV and/or HCC, nutritional status, or BMI.
Prevalence of malnutrition in patients undergoing liver transplantation has varied in the literature depending on the methodology used to define malnutrition [18–20]. Malnutrition prevalence in our study was 84% as evaluated by SGA. However, malnutrition as defined by triceps skinfold thickness or mid arm circumference < 5th percentile was approximately 17% in our study which was similar or slightly lower than that observed in other studies [18,21–23]. Thus, prevalence of malnutrition varies depending on the method of nutritional assessment. Since SGA is a simple and widely available bedside tool [17], it is reasonable to recommend it for nutritional assessment in routine clinical practice. Although, malnutrition was most frequent among normal weight or underweight patients, interestingly it was also observed not infrequently even in overweight and obese patients reflecting disconnect between the presumed indirect relationship between malnutrition and BMI. Thus, malnutrition is not always synonymous with cachexia in alcoholic cirrhotics [21,22].
In the present analysis, 2% of alcoholic cirrhosis patients undergoing liver transplantation were underweight, while 34% were obese (4% morbidly obese). We had hypothesized that with the increasing prevalence of obesity in the general population and in cirrhotics, we would observe increasing alcoholic cirrhosis patients with obesity undergoing liver transplantation. However, contrary to our prediction, median BMI of alcoholic cirrhosis patients undergoing liver transplantation did not change over time. Analysis of the UNOS database showed obesity prevalence among transplant recipients to have increased from 17% (2.1% class III obesity) during 1988–2000 to 33% (3.2% class III obesity) during 2001–2004 [7,24]. Although there was a trend for increase in obesity prevalence over time among alcoholic cirrhosis patients undergoing transplantation in the current analysis (29%, 34%, 39% during 1988–2000, 2001–2006, and 2007–2011, respectively), the differences were not significant.
We did not find an association of nutritional parameters at the time of listing with liver transplantation outcomes for graft and patient survival at 1 year. These observations are consistent with previous publications [21,25,26]. Our findings suggest that malnutrition may not be a contraindication for listing a patient for liver transplantation and support wider application of liver transplantation for patients with alcoholic cirrhosis despite their nutritional status. However, this conclusion is tempered by our and previous analyses showing that malnourished patients have higher length of stay in the hospital. Although, we did not analyze in the present study, malnourished patients are also reported to require more hospital resources including longer stay in the intensive care unit with higher need for blood transfusions [19,25]. Furthermore, being a retrospective analysis, this conclusion may also be limited by selection bias of not transplanting alcoholic cirrhotics with severe malnutrition and unavailability of anthropometric measurements for all the patients.
Although graft and patient survival was worse in alcoholic cirrhosis patients undergoing liver transplantation who resided at either extreme of BMI (<18.5 or >39.9) at the time of listing for liver transplantation, this finding was negated when analyzed for BMI at the time of liver transplantation and controlled for ascitic fluid removed at the time of transplant. Furthermore, there were no differences in the cause of death among patients at extremes of BMI. These data are consistent with some, although not all, prior analyses [27–30]. For example, in a UNOS database analysis, patients with BMI <18.5 died more frequently of bleeding and cerebrovascular accidents while morbidly obese patients died more frequently of malignancy and cardiovascular events [27]. It must be considered that the numbers of patients at extreme BMI was smaller in the present study and may reflect the selection bias by which many patients in these extreme BMI subgroups did not undergo liver transplantation.
In conclusion, alcoholic cirrhosis patients undergoing liver transplantation are frequently malnourished despite normal or increased BMI. Over time, the nutritional status of alcoholic cirrhosis patients undergoing liver transplantation has not changed dramatically with excellent 1-year liver transplantation graft and patient survival rates irrespective of their nutritional status at time of transplant. In total, the work extends other recent studies that indicate that alcoholic cirrhosis patients comprise an indication for liver transplantation that achieves excellent outcomes.
Acknowledgements
The study is supported by following grants: AA021171, AA021788, and P30DK084567 Digestive Disease Clinical Core (VS).
Footnotes
Conflicts of interest The authors do not have a commercial or other association with pharmaceutical companies or other parties that might pose a conflict of interest.
Authorship AKS: designed research/study, performed research/study, collected data, analyzed data, and wrote the manuscript. PSK and WK: designed research/study. NFZ, SD and MS: performed research/study. MRC, JKH and KDW: wrote the manuscript. VHS: designed research/study and wrote the manuscript.
References
- 1.Mendenhall CL, Anderson S, Weesner RE, Goldberg SJ, Crolic KA. Protein-calorie malnutrition associated with alcoholic hepatitis. Veterans Administration Cooperative Study Group on Alcoholic Hepatitis. Am J Med. 1984;76:211. doi: 10.1016/0002-9343(84)90776-9. [DOI] [PubMed] [Google Scholar]
- 2.Babineaux MJ, Anand BS. General aspects of the treatment of alcoholic hepatitis. World J Hepatol. 2011;3:125. doi: 10.4254/wjh.v3.i5.125. [DOI] [PMC free article] [PubMed] [Google Scholar]
- 3.McClain CJ, Barve SS, Barve A, Marsano L. Alcoholic liver disease and malnutrition. Alcohol Clin Exp Res. 2011;35:815. doi: 10.1111/j.1530-0277.2010.01405.x. [DOI] [PMC free article] [PubMed] [Google Scholar]
- 4.Mullen WH, Churchouse SJ, Vadgama PM. Enzyme electrode for glucose based on the quinoprotein glucose dehydrogenase. Analyst. 1985;110:925. doi: 10.1039/an9851000925. [DOI] [PubMed] [Google Scholar]
- 5.Wyatt E. A growing epidemic. ONS Connect. 2010;25:6. [PubMed] [Google Scholar]
- 6.Yan LL, Daviglus ML, Liu K, et al. Midlife body mass index and hospitalization and mortality in older age. JAMA. 2006;295:190. doi: 10.1001/jama.295.2.190. [DOI] [PubMed] [Google Scholar]
- 7.Pelletier SJ, Schaubel DE, Wei G, et al. Effect of body mass index on the survival benefit of liver transplantation. Liver Transpl. 2007;13:1678. doi: 10.1002/lt.21183. [DOI] [PubMed] [Google Scholar]
- 8.Berzigotti A, Garcia-Tsao G, Bosch J, et al. Obesity is an independent risk factor for clinical decompensation in patients with cirrhosis. Hepatology. 2011;54:555. doi: 10.1002/hep.24418. [DOI] [PMC free article] [PubMed] [Google Scholar]
- 9.Stepanova M, Rafiq N, Younossi ZM. Components of metabolic syndrome are independent predictors of mortality in patients with chronic liver disease: a population-based study. Gut. 2010;59:1410. doi: 10.1136/gut.2010.213553. [DOI] [PubMed] [Google Scholar]
- 10.Singal AK, Bashar H, Anand BS, Jampana SC, Singal V, Kuo YF. Outcomes after liver transplantation for alcoholic hepatitis are similar to alcoholic cirrhosis: exploratory analysis from the UNOS database. Hepatology. 2012;55:1398. doi: 10.1002/hep.25544. [DOI] [PubMed] [Google Scholar]
- 11.Mathurin P, Moreno C, Samuel D, et al. Early liver transplantation for severe alcoholic hepatitis. N Engl J Med. 2011;365:1790. doi: 10.1056/NEJMoa1105703. [DOI] [PubMed] [Google Scholar]
- 12.Lucey MR. Liver transplantation in patients with alcoholic liver disease. Liver Transpl. 2011;17:751. doi: 10.1002/lt.22330. [DOI] [PubMed] [Google Scholar]
- 13.Hoofnagle JH, Kresina T, Fuller RK, et al. Liver transplantation for alcoholic liver disease: executive statement and recommendations. Summary of a National Institutes of Health workshop held December-6-7, 1996, Bethesda, Maryland. Liver Transpl Surg. 1997;3:347. doi: 10.1002/lt.500030324. [DOI] [PubMed] [Google Scholar]
- 14.Singal AK, Charlton MR. Nutrition in alcoholic liver disease. Clin Liver Dis. 2012;16:805. doi: 10.1016/j.cld.2012.08.009. [DOI] [PubMed] [Google Scholar]
- 15.Schlussel MM, dos Anjos LA, de Vasconcellos MT, Kac G. Reference values of handgrip dynamometry of healthy adults: a population-based study. Clin Nutr. 2008;27:601. doi: 10.1016/j.clnu.2008.04.004. [DOI] [PubMed] [Google Scholar]
- 16.Frisancho AR. New norms of upper limb fat and muscle areas for assessment of nutritional status. Am J Clin Nutr. 1981;34:2540. doi: 10.1093/ajcn/34.11.2540. [DOI] [PubMed] [Google Scholar]
- 17.Detsky AS, McLaughlin JR, Baker JP, et al. What is subjective global assessment of nutritional status? JPEN J Parenter Enteral Nutr. 1987;11:8. doi: 10.1177/014860718701100108. [DOI] [PubMed] [Google Scholar]
- 18.Figueiredo FA, Dickson ER, Pasha TM, et al. Utility of standard nutritional parameters in detecting body cell mass depletion in patients with end-stage liver disease. Liver Transpl. 2000;6:575. doi: 10.1053/jlts.2000.9736. [DOI] [PubMed] [Google Scholar]
- 19.Merli M, Giusto M, Gentili F, et al. Nutritional status: its influence on the outcome of patients undergoing liver transplantation. Liver Int. 2010;30:208. doi: 10.1111/j.1478-3231.2009.02135.x. [DOI] [PubMed] [Google Scholar]
- 20.Pikul J, Sharpe MD, Lowndes R, Ghent CN. Degree of pre-operative malnutrition is predictive of postoperative morbidity and mortality in liver transplant recipients. Transplantation. 1994;57:469. doi: 10.1097/00007890-199402150-00030. [DOI] [PubMed] [Google Scholar]
- 21.Hade AM, Shine AM, Kennedy NP, McCormick PA. Both under-nutrition and obesity increase morbidity following liver transplantation. Ir Med J. 2003;96:140. [PubMed] [Google Scholar]
- 22.Caregaro L, Alberino F, Amodio P, et al. Malnutrition in alcoholic and virus-related cirrhosis. Am J Clin Nutr. 1996;63:602. doi: 10.1093/ajcn/63.4.602. [DOI] [PubMed] [Google Scholar]
- 23.Ferreira LG, Anastacio LR, Lima AS, Correia MI. Assessment of nutritional status of patients waiting for liver transplantation. Clin Transpl. 2011;25:248. doi: 10.1111/j.1399-0012.2010.01228.x. [DOI] [PubMed] [Google Scholar]
- 24.Nair S, Verma S, Thuluvath PJ. Obesity and its effect on survival in patients undergoing orthotopic liver transplantation in the United States. Hepatology. 2002;35:105. doi: 10.1053/jhep.2002.30318. [DOI] [PubMed] [Google Scholar]
- 25.Figueiredo F, Dickson ER, Pasha T, et al. Impact of nutritional status on outcomes after liver transplantation. Transplantation. 2000;70:1347. doi: 10.1097/00007890-200011150-00014. [DOI] [PubMed] [Google Scholar]
- 26.Shahid M, Johnson J, Nightingale P, Neuberger J. Nutritional markers in liver allograft recipients. Transplantation. 2005;79:359. doi: 10.1097/01.tp.0000150022.64564.c2. [DOI] [PubMed] [Google Scholar]
- 27.Dick AA, Spitzer AL, Seifert CF, et al. Liver transplantation at the extremes of the body mass index. Liver Transpl. 2009;15:968. doi: 10.1002/lt.21785. [DOI] [PubMed] [Google Scholar]
- 28.Stephenson GR, Moretti EW, El-Moalem H, Clavien PA, Tuttle-Newhall JE. Malnutrition in liver transplant patients: preoperative subjective global assessment is predictive of outcome after liver transplantation. Transplantation. 2001;72:666. doi: 10.1097/00007890-200108270-00018. [DOI] [PubMed] [Google Scholar]
- 29.Shaw BW, Jr, Wood RP, Gordon RD, Iwatsuki S, Gillquist WP, Starzl TE. Influence of selected patient variables and operative blood loss on six-month survival following liver transplantation. Semin Liver Dis. 1985;5:385. doi: 10.1055/s-2008-1040637. [DOI] [PMC free article] [PubMed] [Google Scholar]
- 30.Leonard J, Heimbach JK, Malinchoc M, Watt K, Charlton M. The impact of obesity on long-term outcomes in liver transplant recipients-results of the NIDDK liver transplant database. Am J Transplant. 2008;8:667. doi: 10.1111/j.1600-6143.2007.02100.x. [DOI] [PubMed] [Google Scholar]