Abstract
Purpose: Magnetic resonance imaging (MRI) is an emerging modality for interventional radiology, giving clinicians another tool for minimally invasive image-guided interventional procedures. Difficulties associated with endovascular catheter navigation using MRI guidance led to the development of a magnetically steerable catheter. The focus of this study was to mechanically characterize deflections of two different prototypes of the magnetically steerable catheter in vitro to better understand their efficacy.
Methods: A mathematical model for deflection of the magnetically steerable catheter is formulated based on the principle that at equilibrium the mechanical and magnetic torques are equal to each other. Furthermore, two different image based methods for empirically measuring the catheter deflection angle are presented. The first, referred to as the absolute tip method, measures the angle of the line that is tangential to the catheter tip. The second, referred to the base to tip method, is an approximation that is used when it is not possible to measure the angle of the tangent line. Optical images of the catheter deflection are analyzed using the absolute tip method to quantitatively validate the predicted deflections from the mathematical model. Optical images of the catheter deflection are also analyzed using the base to tip method to quantitatively determine the differences between the absolute tip and base to tip methods. Finally, the optical images are compared to MR images using the base to tip method to determine the accuracy of measuring the catheter deflection using MR.
Results: The optical catheter deflection angles measured for both catheter prototypes using the absolute tip method fit very well to the mathematical model (R2 = 0.91 and 0.86 for each prototype, respectively). It was found that the angles measured using the base to tip method were consistently smaller than those measured using the absolute tip method. The deflection angles measured using optical data did not demonstrate a significant difference from the angles measured using MR image data when compared using the base to tip method.
Conclusions: This study validates the theoretical description of the magnetically steerable catheter, while also giving insight into different methods and modalities for measuring the deflection angles of the prototype catheters. These results can be used to mechanically model future iterations of the design. Quantifying the difference between the different methods for measuring catheter deflection will be important when making deflection measurements in future studies. Finally, MR images can be used to reliably measure deflection angles since there is no significant difference between the MR and optical measurements.
Keywords: interventional MRI, endovascular, steerable catheter
INTRODUCTION
Minimally invasive image guided interventions have become attractive alternatives to their open surgical counterparts because they generally have reduced rates of mortality and morbidity.1, 2, 3 X-ray fluoroscopy has been the modality used most frequently for endovascular procedures because it offers high spatial and temporal resolution and the ability to easily identify metal-containing instruments in the vasculature. Most endovascular interventions require use of a guidewire, a variably flexible metal wire with a diameter ranging from 0.018 to 0.089 cm (0.007 to 0.035 in.) and lengths ranging from 145 to 300 cm. The body of the guidewire is manufactured to a desired stiffness depending on the clinical application, but the tip is flexible and atraumatic.4 The guidewire is inserted into the vascular system through the hub of an entry catheter, and real time x-ray image guidance is used to track its position as the interventionist manipulates it by manually pushing it forward or rotating it. After reaching the desired location the guidewire is used as a rigid track along which the catheter can be advanced. At this point the guidewire is removed from the catheter lumen and the catheter can be used for various applications such as deployment of an intravascular embolic coil, placing a stent, or drug delivery.
Magnetic resonance imaging (MRI) has become increasingly of interest in the interventional arena, giving clinicians another tool in addition to x-ray fluoroscopy for image-guided interventional procedures. The advantages of using MRI include no ionizing radiation, the ability to create contrast between different soft tissue types, imaging oblique planes, imaging in three dimensions, and the ability to quantify physiologic parameters such as vascular flow, tissue perfusion, or temperature. Clinical examples of interventional MRI include breast biopsy,5, 6, 7 tumor ablation,8, 9, 10, 11 neurosurgery,12, 13, 14 cardiac applications,15, 16, 17 and various endovascular interventions.18, 19, 20, 21 Even with these advances there are still difficulties associated with localization and navigation of catheters under pure MRI guidance, thus limiting widespread adoption of MRI for procedure guidance. These concerns led to the development of a magnetically steerable catheter22 specifically for the interventional MRI environment. The materials used in the catheter construction were optimized to minimize the different types of heating (radiofrequency and DC) induced in the body by the device.23, 24
The magnetically steerable catheter uses the static magnetic field (B0) of the MRI system to create a Lorentz force at the tip of the catheter causing a deflection of the tip that can aid in steering the device. The tip of the catheter has a micro coil attached to it that can generate a magnetic moment when excited with a DC current, typically ranging from 100 to 400 mA. If the coil is excited when the catheter is positioned inside a MR scanner bore, the magnetic moment created by the micro coil will try to align itself with the direction of B0 causing the catheter tip to deflect. The caveat is that for deflection of the catheter tip to occur the direction of the magnetic moment of the micro coil cannot be parallel to the direction of B0. Furthermore, with the presence of a single micro coil at the tip of the catheter the deflections are restricted to a single plane (i.e., the plane that contains the B0 vector and the magnetic moment vector of the micro coil). The user can alter the polarity and magnitude of the current in the micro coil to change the direction and magnitude of deflection within this plane.
The aim of this work is to mechanically characterize deflections of a magnetically steerable catheter to develop a better understanding of its functionality and efficacy. Prior work used fluoroscopic MR techniques to measure the deflection of the catheter tip25 with a maximum excitation current of 200 mA. At the maximum current there was significant variability in the measurement of the deflection angle. The variability is explained by the fact that exciting the micro coil with a current creates a local field inhomogeneity artifact, causing signal loss from nearby water proton spins resulting in a local void in the image. The void grows in size as the current in the micro coil is increased and can be of the order of centimeters in diameter, thus making it difficult to accurately measure the deflection angle of the catheter using a MR image.
The first step in the mechanical characterization is to formulate a more accurate mathematical model for the catheter deflection. An accurate mathematical model is necessary because it can predict the effects of mechanical modifications on the deflection angles of the catheter. The model is validated using optical measurements of the catheter tip deflection angle over a range of current values. Optical images are used for the validation process because they have higher spatial resolution than their MR counterparts and do not suffer from image artifacts, thus allowing precise and accurate measurements. The optical images are analyzed using an approach we name the absolute tip method, which attempts to measure the angle of the line tangent to the catheter axis at the tip. When deploying the catheter in vivo it is not possible to obtain optical images of the tip to measure the deflection angle, and instead MR images must be used. The limited spatial resolution and artifacts present in MR images of the activated catheter make it difficult to accurately use the absolute tip method. Hence, it is important to develop and characterize a different method that can measure the deflection angle of the catheter using MR images, an approach we name the base to tip method. Using optical data the base to tip method can be compared to the absolute tip method in order to determine the accuracy of the former relative to the latter. The MR and optical data are also both analyzed using the base to tip method to determine the accuracy of the MR measurement relative to the optical measurement.
MATERIALS AND METHODS
Theory
Catheter deflection model
A mathematical model characterizing the relationship between magnetic catheter tip deflection and the physical factors affecting deflection was previously described by Settecase et al.25 In this model the catheter was modeled as a cantilever beam, where a toque produced by the magnetic moment of the solenoid interacting with the magnetic field of the scanner, τmag, is balanced against the torque of the catheter attempting to return it to the initial state, τmech. The equilibrium equation, for small deflections, is
| (1) |
| (2) |
| (3) |
where n is the number of turns in the solenoid, I is the current, A is the cross-sectional area of the solenoid, B0 is the strength of the magnetic field of the MRI scanner, γ is the initial angle of the catheter with respect to the direction of B0, θ is the angle of catheter deflection from the initial angle, E is the elastic modulus of the catheter, IA is the area moment of inertia the catheter, and L is the unconstrained length of the distal end of the catheter. The mathematical analysis above makes several assumptions: any gravitational, buoyant, or fluid forces are negligible, the B0 field is uniform in the vicinity of the distal tip, the values of E and IA are constant, and the tip does not experience any contact forces from the surrounding tissue. These last two assumptions are especially critical in predicting the deflection angle of the catheter tip.
To simplify the data analysis process, Eqs. 2, 3 were substituted into Eq. 1 and all terms with θ were grouped on the left hand side to arrive at the following form which is linear with the current, I:
| (4) |
As stated before Eq. 4 assumes a single constant value for E and IA. However, in the actual device there are conducting wires made of copper or constantan in the lumen of the catheter that are providing electrical connections to any coils or thermocouples at the tip. The presence of these additional wires changes the modulus and moment of inertia of the combined structure. These changes are reflected in Eq. 5 shown below which models the mechanical stiffness (EIA) as a summation where a contribution is made from the catheter (EcathIcath) as well as from each individual wire (). The value of N represents the total number of conducting wires in the structure:
| (5) |
The values for the cross sectional area of the coil and the area moments of inertia can be computed as shown in Eqs. 6, 7, 8, where Dcoil is the diameter of the coil, Douter is the outer diameter of the catheter at the tip, Dinner is the inner diameter of the catheter at the tip, and is the nominal diameter of the jth conducting wire:
| (6) |
| (7) |
| (8) |
All the physical properties of the catheter and the materials used in its construction were obtained from the manufacturers (including catheter dimensions and elastic modulus, wire diameters and elastic modulus, and alumina tube diameter) and are listed in Table 1. Wires running through the lumen of the catheter were assumed to be located linearly along the long axis of the catheter.
Table 1.
Physical properties of catheter prototypes.
| Parameter | Value | Unit | Description |
|---|---|---|---|
| n | 30 | Number of coil turns | |
| B0 | 3 | T | MR static field strength |
| Ecath | 21.29 | MPa | Elastic modulus of catheter |
| Ecopper | 110 | GPa | Elastic modulus of copper |
| Econstantan | 162 | GPa | Elastic modulus of copper |
| Dcoil | 1.25 | mm | Diameter of coil |
| Douter | 0.965 | mm | Catheter outer diameter |
| Dinner | 0.635 | mm | Catheter outer diameter |
| Dcopper | 0.127 | mm | Diameter of copper wires |
| Dconstantan | 0.127 | mm | Diameter of constantan |
Deflection angle measurement methods
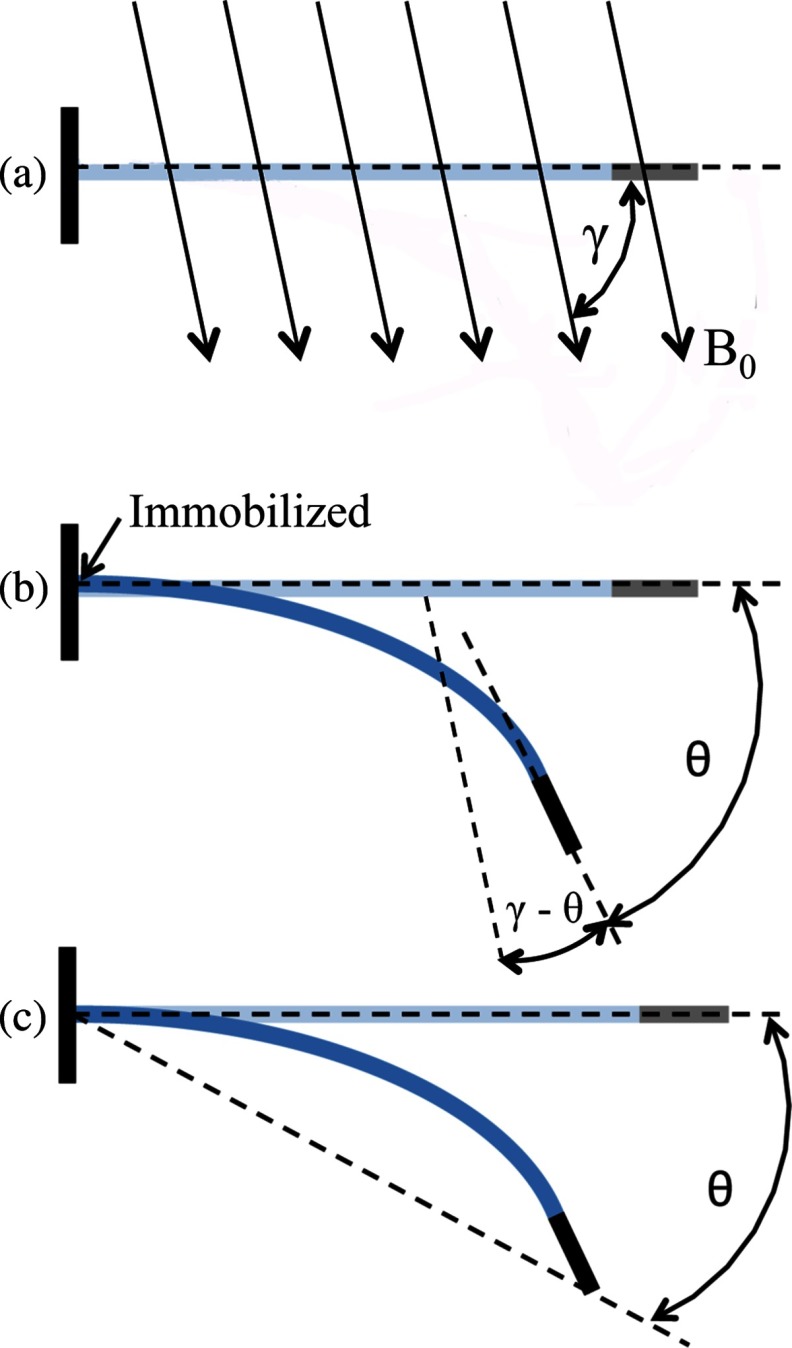
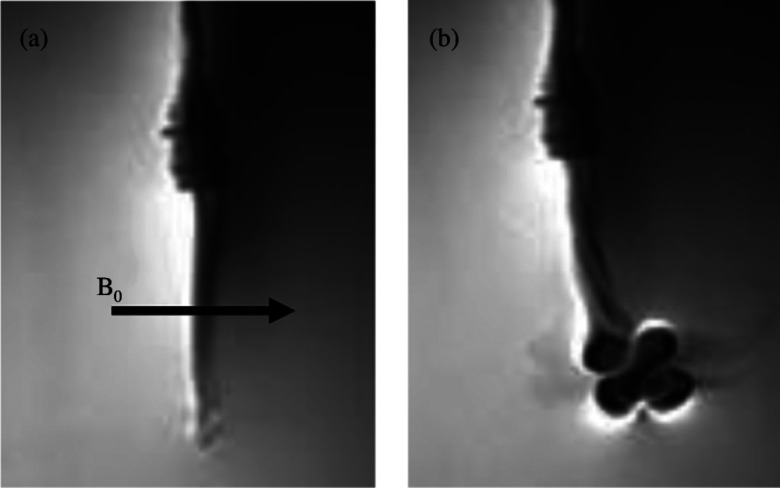
The catheter deflection angle θ in Eq. 5 represents the change in the angle of the catheter's distal tip as a result of current being delivered to the catheter. This deflection is depicted in Fig. 1b, and the angle θ referred to in Eq. 5 will be referred to as the absolute tip angle for the subsequent description. Measuring this angle from the acquired images will be referred to as the absolute tip angle method. Unfortunately, as mentioned earlier, in the MR images the magnetic field induced by the electrical current running through the solenoid during catheter deflection produces a field inhomogeneity artifact that obscures the distal tip of the catheter. This artifact limits our ability to determine the absolute tip angle from a MR image during a deflection (e.g., see Fig. 5, which is described in Sec. 2D). It is possible, however, to measure the absolute tip angle when the catheter is imaged optically because there are no artifacts in the optical images. The absolute tip angle is calculated by determining the line tangential to the catheter tip with and without the presence of an excitation current, as shown in Fig. 1b.
Figure 1.
(a) The angle γ refers to the initial angle of the catheter shaft relative to the direction of the main magnetic field, B0. (b) The absolute tip angle refers to the angle formed by the line tangential to the distal tip of the catheter and the initial position of the catheter shaft. The assumption is made that the catheter is immobilized at the point on the proximal end, indicated by the arrow. (c) The base to tip angle refers to the angle formed by the line that connects the catheter tip to the point of immobilization and the initial position of the catheter shaft.
Figure 5.
MR images of catheter tip deflection of prototype catheter without a thermocouple at L = 5 cm using a bSSFP sequence. (a) Before current is applied, catheter is shown in its initial position. (b) While 300 mA of current is applied to the micro coils, the catheter is deflected. A large artifact is produced when current is applied to the catheter.
An alternative method for measuring the catheter deflection angle is to measure the change in angle of the catheter tip with respect to the point of immobilization of the catheter shaft held by an introducer sheath several centimeters proximal to the catheter tip. This approach is depicted in Fig. 1c and will be referred to as the base to tip angle method. The angle θ measured in this approach is an approximation to the absolute tip angle. By using the center of the inhomogeneity artifact as a marker for the tip of the catheter, as done in previous passive catheter tracking methods using MRI,26 it is possible to measure the base to tip catheter angle using MRI. To determine θ, first the position of the immobilized point at the introducer sheath tip is measured, followed by the position of the center of the inhomogeneity artifact. This information combined with the initial position of the catheter is sufficient to determine the value of θ. In an in vivo environment it is not possible to use the introducer sheath as a marker, but the end of the guide catheter (i.e., the hollow catheter that is inserted prior to the magnetically steerable catheter) can be used as a substitute marker.
In this study optical deflection data were analyzed using both the absolute tip angle method and base to tip angle method, while MR deflection data were analyzed using only the base to tip angle method. Analysis is performed on the following data sets:
-
(i)
Theoretical predictions from Eq. 5 compared to the optical data using the absolute tip angle method for validation of the mathematical model.
-
(ii)
Optical data using the absolute tip angle method compared to the optical data using the base to tip angle method to determine the accuracy of the base to tip angle method.
-
(iii)
Optical data and MR data using the base to tip angle method for both to determine the accuracy of the MR deflection measurement relative to the optical deflection measurement.
Device construction
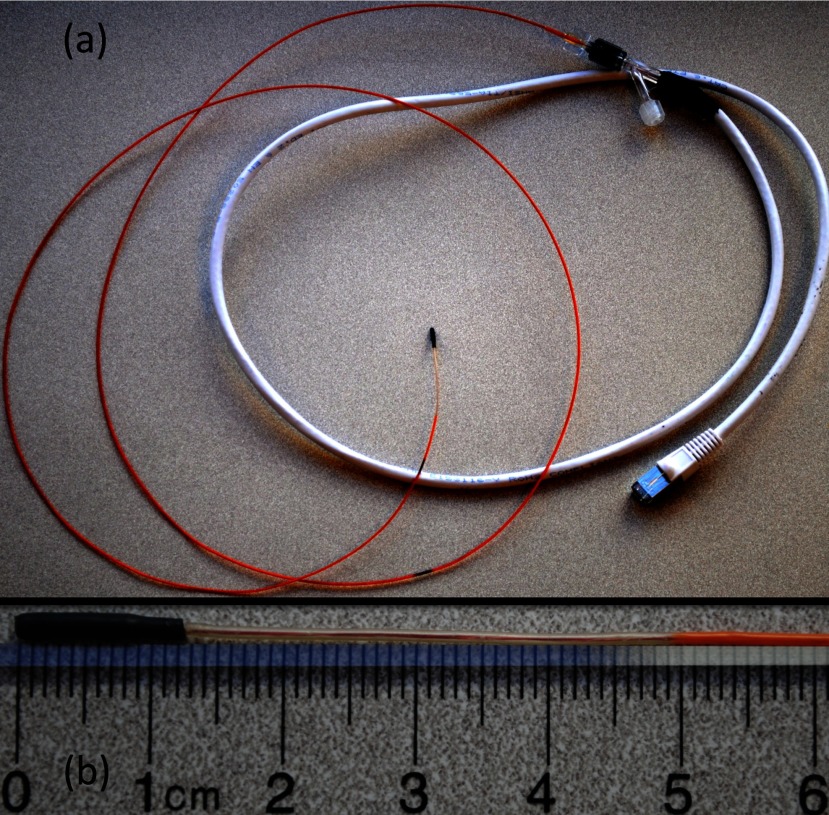
Two catheter prototypes were constructed using 2.9 F custom microcatheters (Penumbra Inc., Alameda, CA). The catheter's standard nitinol braiding was replaced with PEEK (polyether ether ketone) due to MR compatibility concerns. Replacing the nitinol braiding reduces the stiffness of the assembly making the catheter somewhat less robust for typical x-ray guided procedures. On the other hand, increased catheter flexibility is a benefit in the MR environment because it allows for larger deflection angles for a given current, or the possibility of using less current for a given deflection angle. The circuit at the tip of the catheter consisted of a 30-turn solenoid coil (0.001 in. diameter copper wire, California Fine Wire, Grover Beach, CA), which was wrapped around a 1.25 mm diameter alumina tube. The solenoid and alumina tube were attached to the distal tip of the catheter using heat shrink tubing with a nominal thickness of 0.36 mm. Two copper conducting wires, 0.004 in. in diameter, were soldered to either end of the solenoid, and were strung through the lumen of the 2.9 F catheter such that the free ends of the wires exited the catheter lumen at the proximal hub end. These wires were then soldered to two leads from a shielded ethernet cable (category 6 foiled twisted pair). The ethernet cable was placed through the penetration panel of the MR scanner suite to deliver the current to the catheter from the control electronics positioned in the control room. A shielded cable was used to avoid interference from the B1 transmit field of the MRI system. In one of the prototypes, a T-type thermocouple was installed in a slit machined at the distal tip of the alumina tube to allow for real-time temperature measurements. The catheter prototype with the thermocouple had two additional wires (for a total of four wires) placed inside its lumen. The distal ends of the wires were attached to the thermocouple sensor, while the proximal ends were attached to the output signal connector for the thermocouple. These additional wires have an effect on the deflection angle of the catheter because they increase the stiffness of the catheter. Temperature data are not presented in this study because it is outside the scope of the aims. Further details about heating related to this type of catheter can be found in Hetts et al.27 Figure 2 shows one of the completed catheter prototypes.
Figure 2.
(a) Completed catheter assembly. (b) Distal tip of the catheter prototype.
Deflection angle measurements
Catheter angle measurements were made on selected JPEG images from the MR and optical imaging. The details of the methods used to acquire the images are explained in Sec. 2D below. For each deflection, an image of the catheter immediately before the deflection (predeflection image) and an image at mechanical equilibrium during the deflection (deflection image) were selected. For each set of experimental conditions (i.e., catheter orientation and specified current) the catheter was deflected a total of five times. The average deflection was calculated from these five trials. All measurements were made using custom MATLAB analysis scripts.
For images measured using the absolute tip angle method, all catheter angles were measured by selecting the point in the center of the catheter at the base of the black heat shrink tubing and the point in the center of the catheter at the distal tip. The angle of the straight line connecting these two points with respect to the horizontal axis of the image is defined as the catheter angle for that image. For each deflection, θ is defined as the difference between the catheter angle in the deflection image and the predeflection image. The angle γ is defined as the angle of the catheter with respect to B0 in the predeflection image.
For images measured using the base to tip angle method, all catheter angles were measured by selecting the point in the center of the catheter where it exits the introducer sheath (and thus is fixed in space) and the point in the center of the catheter at the catheter's distal tip. For MRI deflection images, the center of the artifact is considered to the center of the catheter's distal tip. The angle of the straight line connecting these two points with respect to the horizontal axis of the image is defined as the catheter angle for that image. The angle θ is defined as the difference between the new definition of the catheter angle in the deflection image and the predeflection image, while γ is defined in the same manner as before.
Imaging catheter deflection
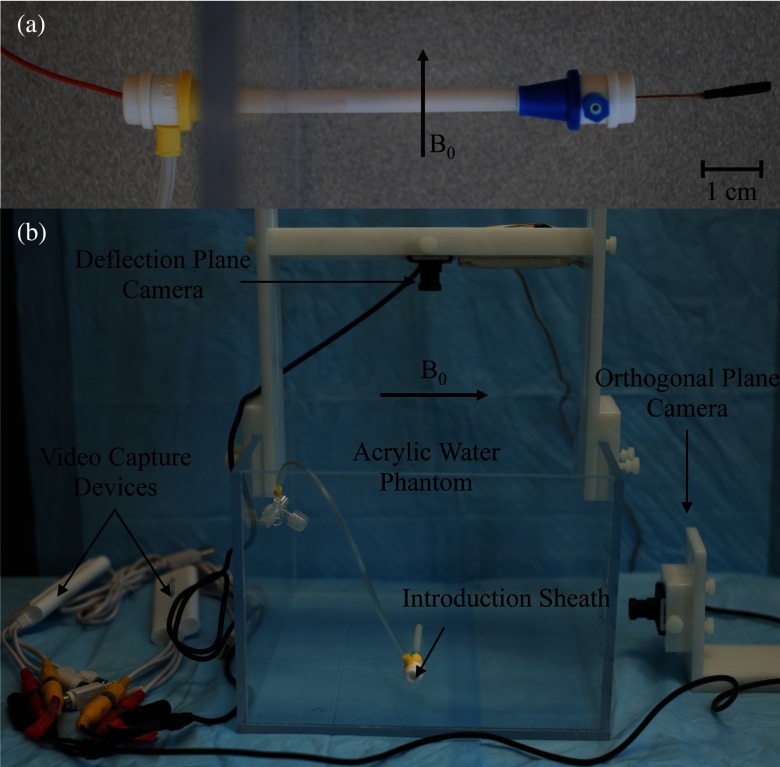
For device testing, the distal tip of the catheter was suspended in a water-filled acrylic phantom with the catheter axis oriented at γ angles ranging from 30° to 90° relative to the main magnetic field of the scanner. The catheter was inserted through the side of the acrylic phantom through a series of introduction sheaths so the distal portion of the catheter was fixed at the entry point into the water [see Fig. 3a]. Currents in the ±600 mA range were applied remotely to the solenoid using a DC current source in the MRI control room. Prior in vivo studies using a similar catheter prototype27 demonstrated that I equal to 600 mA could lead to potential thermal injury to the surrounding tissue, which is why this value was used as an upper limit.
Figure 3.
(a) Catheter entering acrylic phantom through the side through a series of introducer sheaths. Distal portion is held fixed at its proximal end with inner introducer sheath. (b) Experimental setup used to image the distal tip of the catheter using two MR compatible CMOS cameras. The acrylic water phantom and Delrin fixtures used to hold the cameras are shown, along with the video capture devices.
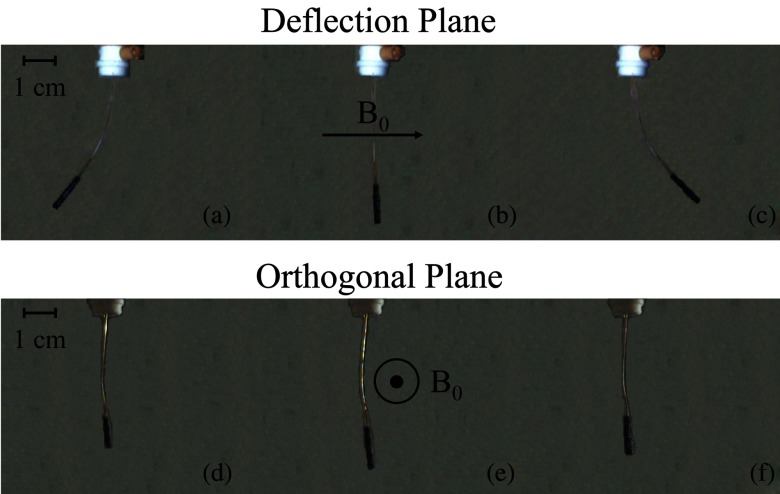
Optical images were captured using MR compatible CMOS cameras (Swann, Port Melbourne, Australia). The camera was suspended vertically above the acrylic phantom using a custom plastic (Delrin, DuPont Chemical, Wilmington, DE) fixture [Fig. 3b]. The camera's distance from the catheter was adjusted to get the catheter length within the field of view. A video capture device (Elgato Systems, München, Germany) was used to convert videos received from the camera and save them as MP4 videos on a computer. Custom MATLAB scripts were used to select desired frames from videos and convert them to JPEGs for measurement of catheter angles. A second camera was used to capture the image plane orthogonal to the original vertically suspended camera. The videos from the second camera were used to verify that the catheter was not deflecting along an oblique plane (i.e., that the deflections were restricted to the plane parallel to the vertically suspended camera). Figure 4 displays images of typical optical images from both CMOS cameras for when the catheter is at rest and for both positive and negative polarity deflections.
Figure 4.
Optical images of catheter tip deflection of prototype catheter without a thermocouple at L = 5 cm. (a) Distal portion of the catheter as seen in the deflection plane while −300 mA of current is applied. (b) Distal portion of the catheter in its initial position as seen in the deflection plane before current is applied. (c) Distal portion of the catheter as seen in the deflection plane while +300 mA of current is applied. (d) Distal portion of the catheter as seen in the orthogonal image plane while −300 mA of current is applied. (e) Distal portion of the catheter in its initial position as seen in the orthogonal image plane before current is applied. (f) Distal portion of the catheter as seen in the orthogonal image plane while +300 mA of current is applied.
MR imaging was performed in a clinical 3T scanner (750W, General Electric Medical Systems, Waukesha, WI) using a balanced steady state free precession (bSSFP) pulse sequence using the following scanning parameters: 256 × 160 imaging matrix, TR = 4.6 ms, TE = minimum, 62.5 kHz receive bandwidth, 70° flip angle, 23 × 23 cm field of view, 1.0 cm slice thickness, and number of averages = 2 (Fig. 5). Temporal resolution was sacrificed to increase the signal to noise ratio in the image to allow for better measurement of deflection angles. The DICOM images from the scanner were converted into JPEG format, which were subsequently used to measure the catheter deflection angles using custom MATLAB programs (MathWorks Inc., Natick, MA).
Optical and MR imaging was performed on both catheter prototypes for L equal to 4, 5, and 6 cm and γ values of 30°, 60°, and 90°. A DC current source was used to deliver ±100, 200, 300, and 600 mA to the catheter for each L and γ value. The optical data from these experiments were compared to the theoretical predictions using the absolute tip method. The optical data were also analyzed using the base to tip method, and these data were compared to the optical deflection data computed using the absolute tip method. The MR data were analyzed only using the base to tip method. The MR and optical data sets analyzed by the base to tip method were compared to each other by computing the left hand side of Eq. 5 for both data sets and normalized by L.
RESULTS
Fit to model
To determine how well the mathematical model can predict the deflection angle of the catheter the quantity θ/sin(γ − θ) is plotted as a function of nIAB0L/(EIA)total (Fig. 6), where (EIA)total is shorthand for . The measured values for θ and γ from the optical images are used to compute θ/sin(γ − θ), which is referred to as the experimental data. On the other hand the quantity nIAB0L/(EIA)total can be computed independently from knowledge of the experimental conditions (i.e., B0, I, L) along with the mechanical properties of the catheter, and is referred to as the theoretical data. If the experimental data matched perfectly with theory then it would lie on a line with slope equal to one and an intercept value of zero (i.e., the line y = x) in Fig. 6. This line is shown for reference (labeled as “Theory”) along with the scatter plot of the experimental data to visually demonstrate how much the experimental data deviate from theory. Specifically, the deviation from theory is more pronounced at larger values of L and I. The mathematical model also does a better job of predicting the behavior of the prototype with the embedded thermocouple [Fig. 6a] relative to the prototype without a thermocouple [Fig. 6b]. It is possible to calculate an R2 statistic to determine how well the experimental data can be predicted by theory (i.e., to determine how well the scatter plot can be fit by the line y = x). Doing this calculation results R2 values of 0.91 and 0.86 for the prototypes with and without a thermocouple, respectively.
Figure 6.

Plots of θ/(sin(γ − θ)) as a function of nIAB0L/(EIA)total. Here (EIA)total represents the summation in the denominator of Eq. 5. Experimental results are shown compared to model predictions. Catheters were tested at 3T, L equal to 4, 5, and 6 cm, and I equal to ±100, ± 200, ± 300, and ± 600 mA. (a) Plot for catheter with thermocouple (R2 = 0.91). (b) Plot for catheter without thermocouple (R2 = 0.86).
Absolute tip angle method versus base to tip angle method
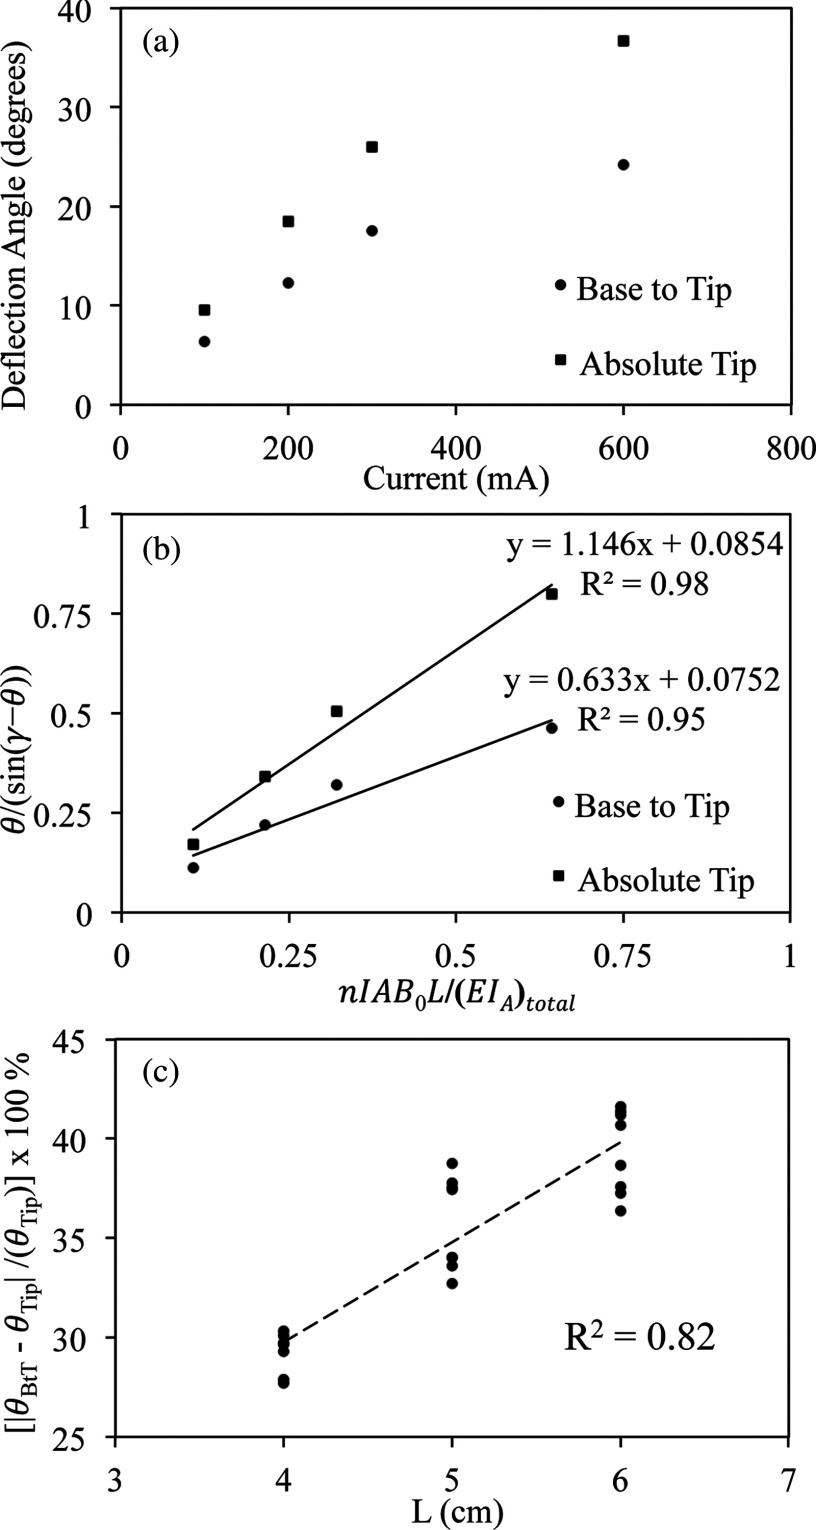
The comparison between the absolute tip deflection angle (θTip) and the base to tip angle (θBtT) using optical images is shown in Fig. 7. Both θTip and θBtT are plotted versus applied I [Fig. 7a] for the prototype with the embedded thermocouple with L equal to 5 cm. The graph demonstrates that θBtT is consistently less than θTip ranging from 3.3° at 100 mA to 12.5° at 600 mA. When the data from Fig. 7a are converted to the appropriate linear forms according to Eq. 5 [Fig. 7b] it is possible to quantify the difference between the two methods by comparing their slopes (1.146 for the absolute tip method versus 0.633 for the base to tip method). The percentage difference between the two angles (|(θBtT − θTip)/θTip| × 100%) is fairly constant (33.59 ± 0.6%) across the different values of I. Furthermore, if the above quantity is graphed as a function of L [Fig. 7c] there appears to be a linear relationship (R2 = 0.82) between the percentage difference and L, which demonstrates that the difference between θTip and θBtT grows with L. The data shown in Fig. 7c are taken from both catheter prototypes (i.e., with and without thermocouple).
Figure 7.
(a) Plot of deflection angle θ as a function of I. Catheter with thermocouple was tested with L equal to 5 cm. Deflection angles measured using base to tip angle method and absolute tip angle method are both shown. (b) Plot of θ/(sin(γ − θ)) as a function of nIAB0L/(EIA)total for both the base to tip and absolute tip method. Again the data are measured for the prototype with the thermocouple with L equal to 5 cm. (c) Plot of the percentage difference between the base to tip angle and absolute tip angle as a function of L. Results from both catheter prototypes are shown on the plot. There is a linear relationship between the percentage difference and L (R2 = 0.82).
Optical versus MRI
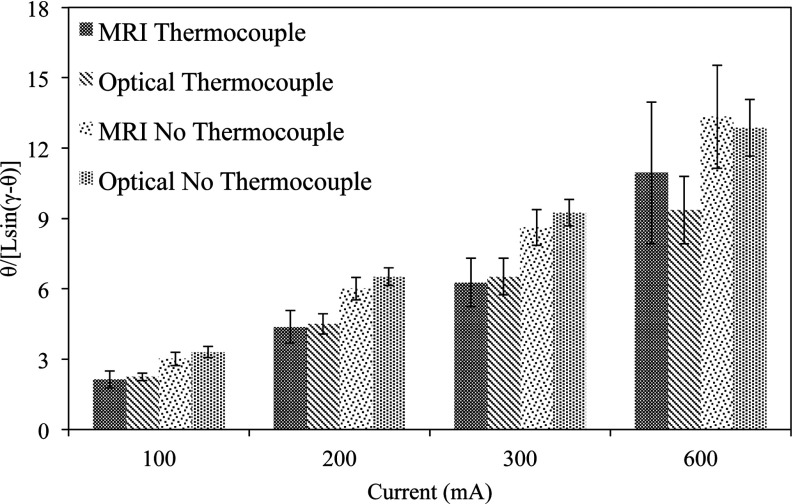
The results from the comparison of the optical and MR images using the base to tip method are summarized in Fig. 8. Given that two different prototypes were tested over four test current magnitudes, the data can be grouped into eight different pairs for comparison. The quantity θ/(L sin(γ − θ)) is plotted in Fig. 8 for each of these eight pairs. The above quantity is the left hand side of Eq. 5 normalized by L. The normalization allows for deflection data across the different values of L to be grouped together. Both imaging modalities demonstrate that θ/(L sin(γ − θ)) increases with I, as expected from Eq. 5. The measured values of θ/(L sin(γ − θ)) are also consistent between imaging modalities, as the average difference between the MR deflection data relative to the optical data over all pairs is 6.9%. The catheter prototype with the embedded thermocouple had smaller values of θ/(L sin(γ − θ)) than the prototype without the thermocouple for the same values of I due to the increased stiffness of the former relative to the latter. Finally, the variance of the measurements using MR data is consistently larger (i.e., larger error bars) than the variance using optical data across all values of I, demonstrating that the optical measurement is more precise.
Figure 8.
Plot of θ/(L sin(γ − θ)) as a function of I, separated out by catheter and imaging method used to measure deflection angles. The catheter deflection angles were calculated using the base to tip method for both the optical and MR images.
DISCUSSION AND CONCLUSIONS
The theoretical predictions agree well with the optical data using the absolute tip angle method at small deflection angles, but there are discrepancies at the larger deflection angles. The model assumes that the mechanical torque that attempts to restore the catheter back to its initial predeflection position is linearly proportional to deflection angle. This assumption is accurate in the small deflection angle regime but breaks down at larger deflection angles. Furthermore, at larger deflection angles the composite stiffness approximation (i.e., modeling the stiffness of the entire structure as a summation of the stiffness from each component) used in Eq. 5 begins to break down. The assumption that the wires are located exactly along the bending axis of the catheter is most likely the cause of this.
The prototype with the thermocouple is stiffer relative to the prototype without the thermocouple due to the presence of extra wires in the lumen. Hence, the deflection angles for the former are smaller relative to the latter, which explains why the model performs better for the stiffer prototype. If the larger deflection angles are excluded from the analysis (i.e., |nIAB0L/(EIA)total| < 1.1 or |θ| < 50°), the R2 values calculated for how well the experimental data is predicted by theory changes to 0.94 (previously 0.86) for the prototype with no thermocouple. This angular cutoff has no effect on the R2 value (0.91) for the prototype with the thermocouple because all the data for this catheter fall within the given cutoff range. Hence, at these smaller deflection angles (|θ| < 50°) the model is more accurate and Eq. 5 is a useful tool to predict how a specific catheter configuration will bend and for designing future iterations of the device.
The measurements made using the base to tip angle method are consistently smaller than those made with the absolute tip method. Furthermore, the difference between the two methods grows as L increases. These results are of significance because in the future measurements made using the base to tip method can be adjusted by using the difference in slopes [Fig. 7b] between the two methods. The comparison between the optical and MR data using the base to tip method (Fig. 8) demonstrates that there is no significant difference between the modalities for acquiring the deflection data. This confirms that the MR data can be used to measure the deflection angle of the catheter, and that using the center of the local field inhomogeneity artifact as a marker for the base to tip method is an effective method to make the measurement.
In conclusion, this study was able to validate the theoretical description of the magnetically steerable catheter in an in vitro environment that allowed for several key assumptions related to the dynamics of the catheter navigations. The study also gave insight into different methods and modalities for measuring the deflection angles of the catheters and determined the accuracy of these methods. This work lays the foundation for development of improved remote controlled catheter tip navigation, thus advancing endovascular interventional MRI.
ACKNOWLEDGMENTS
The National Institutes of Health provided research support for this project via NIBIB Grant No. 1R01EB012031, on which Dr. Steven Hetts is principal investigator. The authors would like to acknowledge Dave Barry, Andrew Chu, and Cynthia Maskeny at Penumbra Inc. for fabricating the catheter bodies that were used in the prototypes tested within this study.
References
- Hoffman S. N., TenBrook J. A., Wolf M. P., Pauker S. G., Salem D. N., and Wong J. B., “A meta-analysis of randomized controlled trials comparing coronary artery bypass graft with percutaneous transluminal coronary angioplasty: One- to eight-year outcomes,” J. Am. Coll. Cardiol. 41, 1293–1304 (2003). 10.1016/S0735-1097(03)00157-8 [DOI] [PubMed] [Google Scholar]
- Qureshi A. I., “Endovascular treatment of cerebrovascular diseases and intracranial neoplasms,” Lancet 363, 804–813 (2004). 10.1016/S0140-6736(04)15697-3 [DOI] [PubMed] [Google Scholar]
- Morris P., “Interventional neuroradiology in the treatment of brain tumors,” Neuroimaging Clin. N. Am. 9, 767–778 (1999). [PubMed] [Google Scholar]
- Kumar A., Handbook of Endovascular interventions (Springer, New York, 2012). [Google Scholar]
- Kuhl C. K., Elevelt A., Leutner C. C., Gieseke J., Pakos E., and Schild H. H., “Interventional breast MR imaging: Clinical use of a stereotactic localization and biopsy device,” Radiology 204, 667–675 (1997). [DOI] [PubMed] [Google Scholar]
- Kuhl C. K., Morakkabati N., Leutner C. C., Schmiedel A., Wardelmann E., and Schild H. H., “MR imaging-guided large-core (14-gauge) needle biopsy of small lesions visible at breast MR imaging alone,” Radiology 220, 31–39 (2001). 10.1148/radiology.220.1.r01jl0731 [DOI] [PubMed] [Google Scholar]
- Daniel B. L., Birdwell R. L., Butts K., Nowels K. W., Ikeda D. M., Heiss S. G., Cooper C. R., Jeffrey S. S., Dirbas F. M., and Herfkens R. J., “Freehand iMRI-guided large-gauge core needle biopsy: A new minimally invasive technique for diagnosis of enhancing breast lesions,” J. Magn. Reson. Imaging 13, 896–902 (2001). 10.1002/jmri.1128 [DOI] [PubMed] [Google Scholar]
- Breen M. S., Lancaster T. L., Lazebnik R. S., Nour S. G., Lewin J. S., and Wilson D. L., “Three-dimensional method for comparing in vivo interventional MR images of thermally ablated tissue with tissue response,” J. Magn. Reson. Imaging 18, 90–102 (2003). 10.1002/jmri.10324 [DOI] [PubMed] [Google Scholar]
- Gianfelice D., Khiat A., Amara M., Belblidia A., Boulanger Y., “MR imaging-guided focused US ablation of breast cancer: Histopathologic assessment of effectiveness—Initial experience,” Radiology 227, 849–855 (2003). 10.1148/radiol.2281012163 [DOI] [PubMed] [Google Scholar]
- Hynynen K., Freund W. R., Cline H. E., Chung A. H., Watkins R. D., Vetro J. P., and Jolesz F. A., “A clinical, noninvasive, MR imaging-monitored ultrasound surgery method,” Radiographics 16, 185–195 (1996). 10.1148/radiographics.16.1.185 [DOI] [PubMed] [Google Scholar]
- Boss A., Rempp H., Martirosian P., Clasen S., Schraml C., Stenzl A., Claussen C. D., Schick F., and Pereira P. L., “Wide-bore 1.5 Tesla MR imagers for guidance and monitoring of radiofrequency ablation of renal cell carcinoma: Initial experience on feasibility,” Eur. Radiol. 18, 1449–1455 (2008). 10.1007/s00330-008-0894-0 [DOI] [PubMed] [Google Scholar]
- Hall W. A., Martin A. J., Liu H., Nussbaum E. S., Maxwell R. E., and Truwit C. L., “Brain biopsy using high-field strength interventional magnetic resonance imaging,” Neurosurgery 44, 807–813 (1999). 10.1097/00006123-199904000-00067 [DOI] [PubMed] [Google Scholar]
- Schwartz R. B., Hsu L., Wong T. Z., Kacher D. F., Zamani A. A., Black P. M., E.AlexanderIII, Stieg P. E., Moriarty T. M., Martin C. A., Kikinis R., and Jolesz F. A., “Intraoperative MR imaging guidance for intracranial neurosurgery: Experience with the first 200 cases,” Radiology 211, 477–488 (1999). 10.1148/radiology.211.2.r99ma26477 [DOI] [PubMed] [Google Scholar]
- Hsu L., Fried M. P., and Jolesz F. A., “MR-guided endoscopic sinus surgery,” Am. J. Neuroradiol. 19, 1235–1240 (1998). [PMC free article] [PubMed] [Google Scholar]
- Razavi R., Hill D. L., Keevil S. F., Miquel M. E., Muthurangu V., Hegde S., Rhode K., Barnett M., van Vaals J., Hawkes D. J., and Baker E., “Cardiac catheterisation guided by MRI in children and adults with congenital heart disease,” Lancet 362, 1877–1882 (2003). 10.1016/S0140-6736(03)14956-2 [DOI] [PubMed] [Google Scholar]
- Kuehne T., Yilmaz S., Schulze-Neick I., Wellnhofer E., Ewert P., Nagel E., and Lange P., “Magnetic resonance imaging guided catheterisation for assessment of pulmonary vascular resistance: In vivo validation and clinical application in patients with pulmonary hypertension,” Heart 91, 1064–1069 (2005). 10.1136/hrt.2004.038265 [DOI] [PMC free article] [PubMed] [Google Scholar]
- Krueger J. J., Ewert P., Yilmaz S., Gelernter D., Peters B., Pietzner K., Bornstedt A., Schnackenburg B., Abdul-Khaliq H., Fleck E., Nagel E., Berger F., and Kuehne T., “Magnetic resonance imaging-guided balloon angioplasty of coarctation of the aorta: A pilot study,” Circulation 113, 1093–1100 (2006). 10.1161/CIRCULATIONAHA.105.578112 [DOI] [PubMed] [Google Scholar]
- Steiner P., Erhart P., Heske N., Dumoulin C. L., von Schulthess G. K., and Debatin J. F., “Active biplanar MR tracking for biopsies in humans,” Am. J. Roentgenol. 169, 735–738 (1997). 10.2214/ajr.169.3.9275888 [DOI] [PubMed] [Google Scholar]
- Paetzel C., Zorger N., Bachthaler M., Hamer O. W., Stehr A., Feuerbach S., Lenhart M., Volk M., Herold T., Kasprzak P., and Nitz W. R., “Magnetic resonance-guided percutaneous angioplasty of femoral and popliteal artery stenoses using real-time imaging and intra-arterial contrast-enhanced magnetic resonance angiography,” Invest. Radiol. 40, 257–262 (2005). 10.1097/01.rli.0000159876.09033.2e [DOI] [PubMed] [Google Scholar]
- Wilson M. W., R. K.KerlanJr., Fidelman N. A., Venook A. P., LaBerge J. M., Koda J., and Gordon R. L., “Hepatocellular carcinoma: Regional therapy with a magnetic targeted carrier bound to doxorubicin in a dual MR imaging/conventional angiography suite—Initial experience with four patients,” Radiology 230, 287–293 (2004). 10.1148/radiol.2301021493 [DOI] [PubMed] [Google Scholar]
- Stattaus J., Maderwald S., Forsting M., Barkhausen J., and Ladd M. E., “MR-guided core biopsy with MR fluoroscopy using a short, wide-bore 1.5-Tesla scanner: Feasibility and initial results,” J. Magn. Reson. Imaging 27, 1181–1187 (2008). 10.1002/jmri.21075 [DOI] [PubMed] [Google Scholar]
- Arenson R. L. H., Hassenzahl W. V., and Roberts T. P. L. (2001). U.S. Patent No. 6,304,769 B1. Washington, DC: U.S. Patent and Trademark Office.
- Bernhardt A., Wilson M. W., Settecase F., Evans L., Malba V., Martin A. J., Saeed M., Roberts T. P., Arenson R. L., and Hetts S. W., “Steerable catheter microcoils for interventional MRI reducing resistive heating,” Acad. Radiol. 18, 270–276 (2011). 10.1016/j.acra.2010.09.010 [DOI] [PMC free article] [PubMed] [Google Scholar]
- Settecase F., Hetts S. W., Martin A. J., Roberts T. P., Bernhardt A. F., Evans L., Malba V., Saeed M., Arenson R. L., Kucharzyk W., Wilson M. W., “RF heating of MRI-assisted catheter steering coils for interventional MRI,” Acad. Radiol. 18, 277–285 (2011). 10.1016/j.acra.2010.09.012 [DOI] [PMC free article] [PubMed] [Google Scholar]
- Settecase F., Sussman M. S., Wilson M. W., Hetts S., Arenson R. L., Malba V., Bernhardt A. F., Kucharczyk W., and Roberts T. P., “Magnetically-assisted remote control (MARC) steering of endovascular catheters for interventional MRI: A model for deflection and design implications,” Med. Phys. 34, 3135–3142 (2007). 10.1118/1.2750963 [DOI] [PMC free article] [PubMed] [Google Scholar]
- Bartels L. W. and Bakker C. J., “Endovascular interventional magnetic resonance imaging,” Phys. Med. Biol. 48, R37–R64 (2003). 10.1088/0031-9155/48/14/201 [DOI] [PubMed] [Google Scholar]
- Hetts S. W., Saeed M., Martin A. J., Evans L., Bernhardt A. F., Malba V., Settecase F., Do L., Yee E. J., Losey A., Sincic R., Lillaney P., Roy S., Arenson R. L., and Wilson M. W., “Endovascular catheter for magnetic navigation under MR imaging guidance: Evaluation of safety in vivo at 1.5 T,” Am. J. Neuroradiol. 34, 2083–2091 (2013). 10.3174/ajnr.A3530 [DOI] [PMC free article] [PubMed] [Google Scholar]


