

Abstract
Purpose: The aim of dual isotope positron emission tomography (DIPET) is to create two separate images of two coinjected PET radiotracers. DIPET shortens the duration of the study, reduces patient discomfort, and produces perfectly coregistered images compared to the case when two radiotracers would be imaged independently (sequential PET studies). Reconstruction of data from such simultaneous acquisition of two PET radiotracers is difficult because positron decay of any isotope creates only 511 keV photons; therefore, the isotopes cannot be differentiated based on the detected energy.
Methods: Recently, the authors have proposed a DIPET technique that uses a combination of radiotracer A which is a pure positron emitter (such as 18F or 11C) and radiotracer B in which positron decay is accompanied by the emission of a high-energy (HE) prompt gamma (such as 38K or 60Cu). Events that are detected as triple coincidences of HE gammas with the corresponding two 511 keV photons allow the authors to identify the lines-of-response (LORs) of isotope B. These LORs are used to separate the two intertwined distributions, using a dedicated image reconstruction algorithm. In this work the authors propose a new version of the DIPET EM-based reconstruction algorithm that allows the authors to include an additional, independent estimate of radiotracer A distribution which may be obtained if radioisotopes are administered using a staggered injections method. In this work the method is tested on simple simulations of static PET acquisitions.
Results: The authors’ experiments performed using Monte-Carlo simulations with static acquisitions demonstrate that the combined method provides better results (crosstalk errors decrease by up to 50%) than the positron-gamma DIPET method or staggered injections alone.
Conclusions: The authors demonstrate that the authors’ new EM algorithm which combines information from triple coincidences with prompt gammas and staggered injections improves the accuracy of DIPET reconstructions for static acquisitions so they reach almost the benchmark level calculated for perfectly separated tracers.
Keywords: positron emission tomography, dual isotope imaging, positron gamma emitter, image reconstruction, maximum likelihood expectation maximization
INTRODUCTION
The aim of Dual Isotope Positron Emission Tomography (DIPET) is to create two separate images of two radiotracers that were acquired simultaneously.1, 2, 3, 4, 5, 6, 7, 8, 9 This approach could provide substantially improved answers to many diagnostic problems encountered in cardiac, oncology, and other imaging studies. For example, stress-rest myocardial perfusion study could be performed using administration of 18F-flurpiridaz10 under stress and 38K (Ref. 11) at rest. It would also be possible to simultaneously image glucose metabolism and tumor hypoxia using 18F-FDG (Ref. 12) and 60Cu-ATSM.13, 14, 15 Another example would be imaging of somatostatin analogues labeled with 44Sc (Ref. 16) injected together with 18F-FDG. Imaging using these two radiotracers could improve diagnoses of patient with neuroendocrine tumors by better identifying presence of receptors and helping in personalized therapy planning.
However, practical implementation of DIPET seems to be impossible at first glance, because positron decay of any isotope always results in emission of 511 keV photons. One solution to this problem is to employ sequential injections, where the second radiotracer is injected after the time period equal to several half-lives of the first one, so that the crosstalk between two activities is negligible. However, this approach is impractical for isotopes with long half-lives (more than 10–15 min), because the waiting times between scans would be very long. Moreover, when two tracers are not imaged simultaneously, besides causing inconvenience for the patient, the images from two studies may not be perfectly aligned and the physiological state of the patient may change between the scans.
Simultaneously performed DIPET imaging acquisitions would shorten the duration of the study, reduce patient discomfort, and produce perfectly coregistered images. Up to now the separation between the simultaneously injected PET tracers was done solely based on the dynamics of the tracers using extrapolation techniques, kinetic modeling, or factor analysis.1, 2, 3, 4, 5, 6, 7, 8, 9 Recently, we have proposed a DIPET technique17 that uses a combination of two positron emitters: radiotracer A which is a “pure” positron emitter (such as 18F or 11C) and radiotracer B in which positron decay is accompanied by a simultaneous emission of a high-energy (HE) prompt gamma(s) (such as 38K or 60Cu). The detection of this HE gamma in coincidence with the corresponding two 511 keV photons (i.e., produced by the same nuclear decay) allows us to identify these lines-of-response (LORs) that originate from isotope B and tag them appropriately.
Reconstruction of these tagged LORs provides an approximate estimate of the radiotracer B distribution and helps us to separate two intertwined datasets. Our simulations show that for every 100 dual-coincidences that originated from isotope B there will be about 5–15 recorded triple coincidences (please see Appendix). The exact ratio of triple to dual coincidences will depend on the selection of PET camera, positron emitter, and object that is being imaged.
The main challenge of the DIPET approach is how to use these triple-coincidence tagged data to separate the large number of recorded dual-coincidence LORs (which may originate from any of the two radiotracers) into two separate datasets. Our initial feasibility study of the proposed DIPET technique based on prompt gammas17, 18 showed that good quality images can be successfully reconstructed using two relatively simple methods from the data modeling acquisitions with a standard PET camera that has been modified to record triple coincidences. More recently, we have proposed a new, advanced method based on the expectation maximization (EM) algorithm19 which resulted in improved image reconstructions as compared to our previous work.17, 18 In this study we are seeking to further enhance the accuracy of the reconstructed activity distributions by staggering injections of the two radiotracers.
Evidently, triple coincidences that are used by our method to identify isotope B and to separate images A and B always create datasets that have lower statistics than those corresponding to dual coincidences. This may potentially lead to increased noise, bias, and incorrect quantitation of the resulting images. While methods have been proposed to increase the triple-coincidence sensitivity of our DIPET technique by attaching an additional large side detector which would improve detection of high-energy gammas; however, such solution would imply major hardware modifications to the existing cameras.20 The main hypothesis of this study is that the quality of both images can be improved (without any extra hardware) if an additional independent estimate of the emission data from pure positron emitter (radiotracer A) is available. One way to achieve this is by combining our DIPET method that employs positron-gamma emitters with additional information that can be obtained from staggered injections.
The staggered injection methods that were initially developed for dual-isotope imaging of pairs of pure positron emitters (18F, 15O, 11C, etc.) usually employ dynamic acquisitions and kinetic models to separate radiotracers.4, 7 Here, we demonstrate that the information obtained using two simple static acquisitions from staggered injections study can be logically combined with our method in which one of the employed radioisotopes is a positron-gamma emitter. For the situation investigated in the present study, we ignore the dynamic behaviors of both radiotracers. It is assumed that the distribution of radiotracer A is sufficiently fixed so that the image acquired before injection of radiotracer B is a valid estimate of the residual radiotracer A activity present when radiotracers A and B are scanned simultaneously. In such case the images obtained by our method simply correspond to the integral of the activity (in each voxel) performed over the duration of acquisition of that image.
To summarize – in this work, we expand the previously proposed EM-based algorithm onto the reconstruction of staggered injection/HE prompt gamma data and evaluate the performance of such combined DIPET technique.
METHODS
In the proposed approach, at the beginning of the study only radiotracer A (pure β+ emitter) is injected [Fig. 1a]. A standard static dual-coincidence PET acquisition, measuring distribution of pure radiotracer A, is performed creating the dataset [presented as phase “A” in Fig. 1a]. Although the provided theory is general, in this work, we test our methods on the simple case in which acquisition “A” begins postinjection, after the time long enough to assume that the uptake phase is finished and spatial distribution of tracer A does not change over the time or the changes can be ignored when the data are collected. We use it in this paper to prove the fundamental feasibility of the proposed EM algorithm. In the future we plan to apply our method to full dynamic-acquisition-plus-dynamic-reconstruction data. In this case, the acquisition protocol may start even before the injection and multiple dynamic frames can be acquired [Fig. 1b] and any changes in spatial and temporal distributions of radiotracers will be allowed and modeled.
Figure 1.
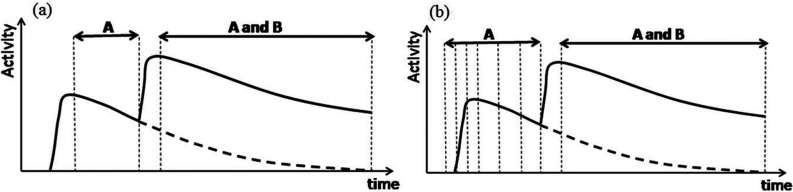
(a) A protocol for staggered/HE prompt gamma DIPET acquisition using radioisotope A (pure β+ emitter) and radioisotope B (that emits β+ and prompt HE gammas) using two static (nondynamic) acquisitions. The curves schematically represent the dynamics of the tracer. During the “A” phase of the scan a standard dual coincidence dataset is acquired, while during the “A and B” phase – two datasets: the dual coincidence dataset and triple coincidence dataset are simultaneously acquired. (b) An example of the DIPET protocol where tracer A is imaged dynamically (note that the acquisition starts before the injection) and phase “A and B” is imaged statically. Any combination of static and dynamic acquisitions can be used. Please note, however, that only the first (static) acquisition type (a) was investigated in this paper and that different dynamic options, such as the one proposed in (b), will be studied in the future.
For the static case investigated here while a substantial amount of radioisotope A activity is still present, we proceed to “A and B” phase by injecting radiotracer B. We start the second acquisition after the second injected activity distributes in the body. During phase “A and B”, we simultaneously acquire the following two sets of data: a dataset which contains LORs that are in coincidence with HE gammas (triple-coincidences) and a dataset that contains all LORs that were captured without coincidence with HE gammas (dual-coincidences). Since radiotracer A is still present at the time of radiotracer B injection, dataset contains events from both radiotracers.
To summarize, we have the following relationships between the collected datasets and the expectations derived from image vectors:
Here, αki is the system matrix, index i is spanning over the image vector and index k is spanning over the data vector, and are the vectors indicating cumulative activity distributions of the radiotracer A and B, respectively. There are two parameters in the proposed reconstruction algorithm: τ and β. Parameter τ corresponds to the ratio of the integral of activity of radiotracer A detected during phase “A” to the integral of activity A detected during phase “A” and “A and B”. In general, this ratio may be different for every voxel and can be estimated using extrapolation techniques23 or kinetic modeling. The second parameter β corresponds to the ratio of the number of LORs originating from radiotracer B that are detected in coincidence with prompt gammas to the total number of detected LORs from isotope B (with or without coincidence with the prompt gamma). It corresponds to the HE gamma detection efficiency and can be estimated from a Monte Carlo simulation or from an experiment. In general, this parameter can be different for every voxel, but for the data investigated in this study it was assumed to be the same for each voxel.
We define cumulative activity as the integral of activity in the voxel over the acquisition time and, therefore, it is in units of counts per voxel. Note that we use the term cumulative distribution to indicate the expected number of emissions per voxel integrated over the total duration of the study, therefore, it is in units of counts. Poisson likelihood21 for the described relationships can be written in the following way:
Applying logarithm, taking partial derivatives, and denoting voxel sensitivity leads to a pair of the update equations for the m + 1's iteration estimate of activity distributions and :
If , (empty dataset), then the above equations transform into the previously presented equations for DIPET with prompt gamma, but without staggered injections.19 On the other hand, if , then the above set changes into the equations for DIPET study with staggered injections performed using two radiotracers which are pure positron emitters.
As already mentioned, in the protocol investigated in this paper we perform static acquisitions which ignore changes in spatial biodistribution of radiotracers over time. This assumption allows us to use a single value of parameter τ in the reconstructions. There is no restriction on the dynamics of tracer B, but typically the acquisition will start after the bolus distributes in the body. In the present static version of the method the general requirements and conditions of acquisition for tracer B are the same as in the standard clinical (non-dynamic) PET. This means that although its distribution may change during the time of acquisition, the reconstructed image will represent this distribution averaged over acquisition time of the entire phase “A and B”.
EXPERIMENTS
GATE 5.0.0 (Ref. 22) was used to simulate dual isotope acquisition using a PET camera with parameters modeling the Siemens Biograph TrueV. The camera ring had diameter of 83 cm with 21.4 cm axial field of view, and was composed of 2 cm thick LSO block detectors. The detection of annihilation photons and high energy gammas was done by the same detectors. Two energy windows were employed: 420–600 keV for annihilation gammas and >600 keV for high-energy gammas. The timing resolution of the PET camera was equal to 0.5 ns and the time coincidence window for dual and triple coincidences was equal to 4.5 ns.
Acquisitions of two three-dimensional (3D) phantoms were simulated (Fig. 2). In the first experiment we simulated a water filled cylindrical phantom with 30 cm diameter and 30 cm height containing six small spheres (each 6 cm diameter) with activity: three spheres filled with radiotracer A = 18F and another three filled with radiotracer B = 60Cu [Fig. 2a]. The distances between sphere centers were equal to 8 cm. In the second experiment, we simulated a more complex combination of nonoverlapping, partially overlapping, and fully overlapping sources of 18F and 60Cu [Fig. 2b]. For both radiotracers, the full physics of positrons and gammas interactions, including scatter and attenuation, was modeled. Since no dynamics was modeled, the parameter τ was assumed to be spatially invariant (same value was assumed for all voxels).
Figure 2.

Phantoms used in GATE simulations. (a) Three spherical sources filled with radioisotope A = 18F and three spherical sources filled with B = 60Cu. (b) Combination of nonoverlapping, partially overlapping, and fully overlapping sources A = 18F and B = 60Cu. All sources were inserted into a 30 cm thick and 30 cm long cylinder filled with nonradioactive water. The percentage values indicate the fraction of some nominal activities of radioisotopes A and B filling each of the inserts.
The following four experiments were performed and the corresponding datasets were created for the first phantom with six spheres (Table 1):
Table 1.
The number of counts simulated in the three datasets for each of the four experiments and the corresponding parameters τ and β for six-spheres phantom [Fig. 2a] that were used in image reconstruction.
| Number of counts |
Parameters |
||||
|---|---|---|---|---|---|
| Experiment | τ | β | |||
| #1 | 400k | 0 | 400k | 1.0 | 1.0 |
| #2 | 40k | 760k | 0 | 0.1 | 0 |
| #3 | 0 | 760k | 40k | 0 | 0.1 |
| #4 | 40k | 720k | 40k | 0.1 | 0.1 |
Case #1: The first simulation experiment corresponded to a separate acquisition of two radioisotopes with 400 k counts collected for each of them (800 k total events). Although these data were created in a single simulation experiment, in the reconstruction of images the information about the origin of each LOR was assumed to be known allowing for perfect event separation. This information, provided by GATE program assigned each LOR to the isotope A or B, respectively. This dataset (#1) was created in order to allow us to analyze the quality of reconstruction in situation where the true identity of each LOR is known.
Case #2: The second experiment corresponded to a staggered injection with 40 k events (about 5% of total acquired events from both tracers) acquired in the dataset and 760 k in the dataset . In this case triple coincidences were not acquired (τ = 0.1 and );
Case #3: In the third experiment, radiotracers A and B were injected simultaneously (nonstaggered injection). In this case triple coincidences were acquired and the dataset consisted of 40 k events (again about 5% of total acquired events from both tracers) resulting in parameters equal to (, and β = 0.1);
Case #4: The last experiment simulated the situation where both staggered injection was used and triple coincidences data were acquired (τ = 0.1 and β = 0.1).
Dataset created in Case #1 modeled separate acquisitions and was used as a benchmark in our analysis. We used a small number of counts for to match the number of but, in general, a higher number for can be used. These numbers were matched as the information from these two datasets was used for the tracer separation. By keeping the statistical power (number of counts) at the same level we wanted to investigate if any of these datasets would provide stronger contribution to the separation of the radiotracers.
The datasets were obtained by sorting and clipping the list-mode data generated by GATE. The ratio between number of triple coincidences and dual coincidences included in datasets #3 and #4 was modified to yield exactly 0.1 to 0.9. This was done by discarding appropriate number of double coincidences. Using this approach, the datasets had correct spatially variant distribution of β; however, in the reconstruction parameter β was assumed constant and equal to 0.1.
Similar four experiments were performed for the second phantom, only in this case higher-statistics datasets with 5 million total counts were employed (Table 2).
Table 2.
The number of counts simulated in the three datasets for each of the four experiments and the corresponding parameters τ and β for the overlapping phantom [Fig. 2b] that were used in image reconstruction.
| Number of counts |
Parameters |
||||
|---|---|---|---|---|---|
| Experiment | τ | β | |||
| #1 | 2.5M | 0 | 2.5M | 1.0 | 1.0 |
| #2 | 250k | 4.75M | 0 | 0.1 | 0 |
| #3 | 0 | 4.75M | 250k | 0 | 0.1 |
| #4 | 250k | 4.5M | 250k | 0.1 | 0.1 |
The images were reconstructed using our DIPET-OSEM algorithm based on the formulae presented in Sec. 2 with 8 subsets and 20 iterations with attenuation correction. Compton scatter and randoms were simulated, but not corrected for. The image matrix of 128 × 128 × 128 with 3.9 mm voxel size was employed. A postreconstruction Gaussian filter with 2 pixels FWHM was applied.
The quality of reconstructions was evaluated by visually inspecting images looking for artifacts and residual crosstalk activity. Additionally, quantitative assessment of image quality was performed by calculating the root mean square errors (RMSEs) for 3D regions of interests (ROI) set on the areas where the traces of the other (contaminating) radioisotope were expected to be found. RMSE was defined as
where N is the number of voxels in the ROI, is the actual value, and fi is the estimated value.
For the six-spheres phantom [Fig. 2a] the RMSEs were defined over three ROIs that corresponded to the three spherical regions where the other radiotracer was simulated. Since the value of the RMSE indicates the amount of crosstalk contamination between radiotracers, we consider that the RMSE values provide a good indicator of the performance of our reconstruction method.
Analogous analysis was performed for the second phantom [Fig. 2b]. In this case only the regions containing nonoverlapping activities were considered in the estimation of RMSE (three regions for each isotope). For locations of the ROIs used in the RMSE analysis of the first and the second phantom see Figs. 34, respectively.
Figure 3.

Central transaxial slices of the first phantom images showing the distributions of radiotracers A (first row) and B (second row) reconstructed from six-sphere phantom [Fig. 2a]. The columns from left to right represent images: reconstructed from the benchmark data (Case #1), from the data acquired using staggered injections only (Case #2), using prompt gamma only (Case #3) and using staggered and prompt gamma combined (Case #4), respectively. “RMSE” indicates root mean square error estimated over the three ROIs corresponding to the location of the other radiotracer (the smaller is the value of RMSE, the more accurate is the method). Dashed lines indicate the location of another radiotracer. Arrows indicate the locations where the residual activity from other isotope is the most pronounced. Images are 128 × 128 × 128 with 3.9 mm voxels. Bottom of the figure: profiles drawn through the centers of upper two spheres for each case. The black line shows profiles drawn through images corresponding to tracer A (top row) and grey line to tracer B (bottom row).
Figure 4.

Central transaxial slices of the second phantom images showing the distributions of radiotracers A (first row) and B (second row) reconstructed from overlapping phantom [Fig. 2b]. The columns from left to right represent images: reconstructed from the benchmark data (Case #1), from the data acquired using staggered injections only (Case #2), using prompt gamma only (Case #3), and using staggered and prompt gamma combined (Case #4), respectively. “RMSE” indicates root mean square error estimated over the three ROIs corresponding to the location of other radiotracer (the smaller is the value of RMSE, the more accurate is the method). Dashed lines indicate the location of another radiotracer. Arrows indicate the locations where the activity artifacts from other isotope are pronounced. Images are 128 × 128 × 128 with 3.9 mm voxels. Bottom of the figure: profiles drawn through the centers of upper three spheres for each case. The black line shows profiles drawn through images corresponding to tracer A (top row) and grey line to tracer B (bottom row).
RESULTS AND DISCUSSION
The accuracy of separation of the two activities A and B was investigated by comparing the images reconstructed from experiments #2–#4 to the images obtained from reconstructions of the benchmark data (experiment #1).
The images presented in Fig. 3 show the reconstructed images for the six-sphere phantom [Fig. 2a] together with the corresponding RMSE's values. The first column shows the benchmark images reconstructed from ideally separated LORs (with full knowledge about the identity of each LOR). Since these images were reconstructed from a realistic simulation of dual-isotope acquisition, with scatter and randoms, the RMSEs are not equal to zero. These RMSEs provide a reference point showing the best (minimum) values that can be obtained from the dual-isotope reconstruction in which the isotopes can be perfectly separated. By comparing RMSEs obtained in other experiments to these values the performance of our algorithm in properly separating two activity distributions can be evaluated.
The second column shows the images reconstructed using our DIPET algorithm where acquisition was performed using staggered injections but no information from HE gamma was recorded (β = 0). In this case, the RMSE corresponding to the image of radiotracer A distribution is smaller than the RMSE for the radiotracer B distribution. This can be explained by the fact that we have more information about radiotracer A distribution as it was acquired during both acquisition phases. The third column presents the reconstructed images for the case where the radiotracers were injected at the same time (nonstaggered injections τ = 0) and the triple coincidence data were acquired. This approach changes the situation as compared to the second column. Now the RMSE value corresponding to the radiotracer B image is smaller than the RMSE for the radiotracer A because B's distribution is now better defined by the acquisition of unambiguous triple coincidence data . The last column shows the reconstructions of A and B when both staggered injections and prompt-gamma information were jointly used in data acquisition. Visually perceived image quality, RMSE values, and profiles prove that this case represents the best separation of the two activities, and the accuracy of the resulting images is very close to the benchmark reconstructions. Note that in this and in the next result, activity B has lower reconstructed intensity and slightly worse resolution as compared to activity A due to higher positron range of 60Cu versus 18F.
Figure 4 shows similar results as these just described, but images correspond to the reconstructions of the second phantom containing overlapping objects [Fig. 2b]. These reconstructions demonstrate behavior comparable to that of the first phantom. Again the best results are achieved when the combination of staggered injections and prompt HE-gamma methods is employed. For this phantom, the values of RMSEs are a little higher as compared to the first six-sphere phantom, because in the second phantom the ROIs were positioned very close to the other radiotracer location, therefore, there was inevitable contamination due to imperfect image spatial resolution and positron range.
Finally, Fig. 5 displays the reconstructed images versus iteration number for the case of the six-sphere phantom and the acquisition where both staggered injection and prompt gamma data were available (experiment #4). We show the results after the 1st, 2nd, 5th, and 10th iterations of OSEM DIPET reconstruction with eight subsets. Please note that the early iterations show substantial crosstalk between the two radiotracers (large RMSE values), which gradually fades away when the number of iterations increases.
Figure 5.

The illustration of the effect of the number of iterations on image quality. The crosstalk between two radiotracers gradually decreases and disappears almost entirely by the 10th iteration. Central transaxial slices are displayed showing the images of radiotracers A (first row) and B (second row) reconstructed from six-sphere phantom [Fig. 2a] and using staggered and prompt gamma methods combined (case #4). Dashed lines indicate the location of another radiotracer. Images are 128 × 128 × 128 with 3.9 mm voxels. Bottom of the figure: profiles drawn through the centers of upper two spheres for each case. The black line shows profiles drawn through images corresponding to tracer A (top row) and grey line to tracer B (bottom row).
In this work we provide the first evaluation of the method with the goal of demonstrating the efficacy of the reconstruction algorithm. The algorithm, however, is general and in the future we plan to apply it to a variety of DIPET acquisition protocols, including further investigations of fully static, but also combinations of static-dynamic, and fully dynamic studies. In order to test the algorithm for the more complex types of acquisitions modeling of the dynamics of tracers during “A” and “A and B” phases must be added. Parameters of the acquisition protocol should also be studied. For example, acquisition time for phase “A” relative to acquisition time for phase “A and B” should be optimized. Depending on the tracer dynamics, the starting time of the acquisition may also be a factor influencing the accuracy of the radiotracers separation.
Additionally, in the present study we used the assumption that the parameters τ and β are both scalars with a priori known values. If acquisitions are performed with a substantial delay after the injection of tracer A so that the activity distribution is stabilized, the parameter τ can be estimated from the relative acquisition times and physical decay. However, if the assumption of stationary distribution cannot be used, tracer A can be acquired dynamically and τ (different for each voxel) can be estimated using extrapolation techniques.4 The value of β depends on the scanner and patient geometries, but it is a smooth function with about 10% spatial variation over the field of view (FOV).
Finally, it should be noted that at this point it is not possible to acquire data using triple coincidence mode using any of the PET scanners that are currently available in clinics. We know, however, that such change is possible, as it was done on at least one research scanner by modifying the firmware23 for a small-animal research scanner, but the difficulty may vary from manufacturer to manufacturer.
CONCLUSIONS
In this paper we present a new technique that combines our previously proposed DIPET method which employs high-energy positron gamma emitters with a technique that uses staggered injections. We derive the generalized EM method that can be used for reconstruction of the data obtained by either DIPET, staggered injections, or the combination of both these techniques.
We demonstrate that the proposed EM algorithm can be used for image reconstruction from staggered acquisitions or from acquisitions that use radiotracers emitting β+ and prompt gammas only for the assumed static activity distributions. It is evident from the results of this study that the combination of both DIPET techniques (staggered injection and positron-gamma emitters) creates considerably better images when evaluated visually and achieves smaller RMSEs than those obtained when each technique is applied separately.
The current version of our DIPET algorithm combining staggered injections with HE prompt gamma method does not use any temporal information that could be acquired during dynamic studies. In the future, we plan to apply this method to the reconstruction of dynamic DIPET data which may further improve the accuracy of reconstructions.
ACKNOWLEDGMENT
This work was supported in parts by the National Institutes of Health (NIH) R21HL106474 and R21EB016315.
APPENDIX: DIPET SENSITIVITY ESTIMATION
To investigate the sensitivity of a typical PET camera for detecting HE photons (which is directly linked to a parameter β discussed in Sec. 2) for application in the DIPET acquisitions we have performed the following experiments using GATE Monte Carlo program.18
The simulations were performed for 60Cu isotope which has positron fraction of 92.5% and each nuclear decay results in the emission of one or more HE gammas (the strongest emission lines are 826, 1332, and 1792 keV). A point source of 60Cu with activity of 1 MBq was positioned at the center of the FOV of the camera inside a cylinder filled with water. Three different cylinders with diameters equal to 1 (no attenuation case), 20, and 30 cm and a height of 30 cm were modeled. Simulated 3D acquisitions lasted 10 s and were done using a camera with parameters modeling Siemens Biograph described in Sec. 3 with 2 cm thick LSO detectors. Two different axial FOV configurations: 16.2 and 21.6 cm were used. Energy windows were set at 425–600 keV for annihilation photons and >600 keV for HE gammas, coincidence window was 4.5 ns.
We define sensitivity as a number of events detected by the camera (including random coincidences) to the number of nuclear decays. In the experiment, the following values were estimated. PD was defined as a ratio of detected 511 keV photon pairs (i.e., dual coincidences) to the total number of decays that occurred during the simulated acquisition. PT was defined as a ratio of the number of triple coincidences (two photons detected in 511 keV energy window being in coincidence with at least one out of many emitted HE gammas) to the total number of decays. PT/PD is the ratio of two previously defined sensitivities and indicates what fraction of the detected dual coincidences from 60Cu isotope will be detected as triple coincidences. This ratio not only determines the size of the dataset and the value of the parameter β but also defines our ability to distinguish between two injected radiotracers. Last, we also measured the sensitivity of PET camera for detection of HE gammas defined as a ratio of detected HE gammas to the number of decays. This number is expected to be higher than the PT/PD sensitivity for 60Cu, because on average this isotope decays with more than one HE gamma, making it particularly suitable candidate for DIPET imaging that utilizes HE prompt gammas.
Table 3 summarizes the results of this simulation study. Although the absolute sensitivity of our simulated PET system for detecting triple coincidences was found to be well below 1%, however, to put this number into perspective, the sensitivity of the widely used SPECT camera is typically about one order of magnitude below that estimate (∼0.01% for SPECT). More important for DIPET imaging is the fraction of detected PET LORs that can be identified as triple coincidences. This fraction is given by the PT/PD value, which corresponds to the actual ratio of triple to dual coincidences. Depending on the configuration of the camera and the phantom, this number varies between 7% and 15% for 60Cu, which on average emits more than one HE prompt gamma per decay. As demonstrated in Ref. 14 and also the present study (Sec. 4), this ratio provides sufficient information “tagging” for isotope B events to allow us to accurately separate the two radiotracer distributions.
Table 3.
Simulation tests of sensitivity for 3D DIPET system – 60Cu isotope.
| Water | |||||
|---|---|---|---|---|---|
| phantom | Axial | ||||
| diameter | FOV | Sensitivities1 | |||
| (cm) | (cm) | PD (%) | PT (%) | PT/PD (%) | HE gamma only (%) |
| 1 | 16.2 | 4.52 | 0.55 | 12.07 | 14.81 |
| 21.6 | 6.07 | 0.96 | 15.88 | 19.56 | |
| 20 | 16.2 | 1.25 | 0.11 | 8.79 | 9.99 |
| 21.6 | 1.80 | 0.20 | 11.38 | 13.21 | |
| 30 | 16.2 | 0.62 | 0.05 | 7.40 | 8.47 |
| 21.6 | 0.91 | 0.09 | 9.33 | 11.17 | |
PD - sensitivity of recording dual coincidence event (including triples); PT - sensitivity of recording triple coincidence event; PT/PD - fraction of triples to doubles (normalization factor β measured at the center of the FOV). The number of random triple coincidences was below 5% of the total detected triple coincidences.
References
- Huang S. C., Carson R. E., Hoffman E. J., Kuhl D. E., and Phelps M. E., “An investigation of a double-tracer technique for positron computerized tomography,” J. Nucl. Med. 23, 816–822 (1982). [PubMed] [Google Scholar]
- Kearfott K. J., “Feasibility of simultaneous and sequentially administered dual tracer protocols for measurement of regional cerebral hematocrit using positron emission tomography,” Phys. Med. Biol. 35, 249–258 (1990). 10.1088/0031-9155/35/2/005 [DOI] [PubMed] [Google Scholar]
- Koeppe R. A., Raffel D. M., Snyder S. E., Ficaro E. P., Kilbourn M. R., and Kuhl D. E., “Dual-[11C]tracer single-acquisition positron emission tomography studies,” J. Cereb. Blood Flow Metab. 21, 1480–1492 (2001). 10.1097/00004647-200112000-00013 [DOI] [PubMed] [Google Scholar]
- Kadrmas D. J. and Rust T. C., “Feasibility of rapid multitracer PET tumor imaging,” IEEE Trans. Nucl. Sci. 51, 2664–2668 (2004). 10.1109/NSSMIC.2004.1462799 [DOI] [Google Scholar]
- El Fakhri G., Trott C. M., Sitek A., Bonab A., and Alpert N. M., “Dual-tracer PET using generalized factor analysis of dynamic sequences,” Mol. Imaging Biol. 15(6), 666–674 (2013). 10.1007/s11307-013-0631-1 [DOI] [PMC free article] [PubMed] [Google Scholar]
- Kudomi N., Watabe H., Hayashi T., and Iida H., “Separation of input function for rapid measurement of quantitative CMRO2 and CBF in a single PET scan with a dual tracer administration method,” Phys. Med. Biol. 52, 1893–1908 (2007). 10.1088/0031-9155/52/7/009 [DOI] [PubMed] [Google Scholar]
- Black N. F., McJames S., and Kadrmas D. J., “Rapid multi-tracer PET tumor imaging with F-FDG and secondary shorter-lived tracers,” IEEE Trans. Nucl. Sci. 56, 2750–2758 (2009). 10.1109/TNS.2009.2026417 [DOI] [PMC free article] [PubMed] [Google Scholar]
- Joshi A. D., Koeppe R. A., Fessler J. A., and Kilbourn M. R., “Signal separation and parameter estimation in noninvasive dual-tracer PET scans using reference-region approaches,” J. Cereb. Blood Flow Metab. 29, 1346–1357 (2009). 10.1038/jcbfm.2009.53 [DOI] [PubMed] [Google Scholar]
- Verhaeghe J. and Reader A. J., “Simultaneous water activation and glucose metabolic rate imaging with PET,” Phys. Med. Biol. 58(3), 393–411 (2013). 10.1088/0031-9155/58/3/393 [DOI] [PubMed] [Google Scholar]
- Maddahi J., “Properties of an ideal PET perfusion tracer: New PET tracer cases and data,” J. Nucl. Cardiol. 19(Suppl 1), 30–37 (2012). 10.1007/s12350-011-9491-8 [DOI] [PubMed] [Google Scholar]
- Myers W. G., “Radiopotassium-38 for in vivo studies of dynamic processes,” J. Nucl. Med. 14, 359–360 (1973). [PubMed] [Google Scholar]
- Tseng J., Dunnwald L. K., Schubert E. K., Link J. M., Minoshima S., Muzi M., and Mankoff D. A., “18F-FDG kinetics in locally advanced breast cancer: Correlation with tumor blood flow and changes in response to neoadjuvant chemotherapy,” J. Nucl. Med. 45, 1829–1837 (2004). [PubMed] [Google Scholar]
- Dehdashti F., Grigsby P. W., Mintun M. A., Lewis J. S., Siegel B. A., and Welch M. J., “Assessing tumor hypoxia in cervical cancer by positron emission tomography with 60Cu-ATSM: Relationship to therapeutic response – A preliminary report,” Int. J. Radiat. Oncol., Biol., Phys. 55, 1233–1238 (2003). 10.1016/S0360-3016(02)04477-2 [DOI] [PubMed] [Google Scholar]
- Laforest R., Dehdashti F., Lewis J. S., and Schwartz S. W., “Dosimetry of 60/61/62/64Cu-ATSM: A hypoxia imaging agent for PET,” Eur. J. Nucl. Med. Mol. Imaging 32, 764–770 (2005). 10.1007/s00259-004-1756-x [DOI] [PubMed] [Google Scholar]
- Chao K. S. C. et al. , “A novel approach to overcome hypoxic tumor resistance: Cu-ATSM-guided intensity-modulated radiation therapy,” Int. J. Radiat. Oncol., Biol. Phys. 49, 1171–1182 (2001). 10.1016/S0360-3016(00)01433-4 [DOI] [PubMed] [Google Scholar]
- Roesch F., “Scandium-44: Benefits of a long-lived PET radionuclide available from the (44)Ti/(44)Sc generator system,” Curr. Radiopharm. 5, 187–201 (2012). 10.2174/1874471011205030187 [DOI] [PubMed] [Google Scholar]
- Andreyev A. and Celler A. “Dual isotope PET using positron–gamma emitters,” Phys. Med. Biol. 56, 4539–4556 (2011). 10.1088/0031-9155/56/14/020 [DOI] [PubMed] [Google Scholar]
- Miyaoka R. S., Hunter W. C. J., Andreyev A., Pierce L., Lewellen T. K., Celler A., and Kinahan P. E. “Dual-radioisotope PET data acquisition and analysis,” Proceedings of the IEEE Nuclear Science Symposium and Medical Imaging Conference 2011, IEEE, Valencia, Spain: (2011).
- Sitek A., Andreyev A., and Celler A., “Reconstruction of dual isotope PET using expectation maximization (EM) algorithm,” in Proceedings of the IEEE Nuclear Science Symposium and Medical Imaging Conference 2011, IEEE, Valencia, Spain: (2011), pp. 4323–4326.
- Gonzalez E., Olcott P. D., Bieniosek M., and Levin C. S., “Methods for increasing the sensitivity of simultaneous multi-isotope positron emission tomography,” Proceedings of the IEEE Nuclear Science Symposium and Medical Imaging Conference 2011, Valencia, Spain: (2011).
- Shepp L. A. and Vardi Y., “Maximum likelihood reconstruction for emission tomography,” IEEE Trans. Med. Imag. 1, 113–122 (1982). 10.1109/TMI.1982.4307558 [DOI] [PubMed] [Google Scholar]
- Jan S. et al. , “GATE: A simulation toolkit for PET and SPECT,” Phys. Med. Biol. 49, 4543–4561 (2004). 10.1088/0031-9155/49/19/007 [DOI] [PMC free article] [PubMed] [Google Scholar]
- Lage E., Parot V., Dave S. R., Udías J. M., Moore S. C., Sitek A., Park M.-A., Vaquero J. J., and Herraiz J. L., “Recovery of multi-interaction photon events to improve the performance of PET scanners,” Proceedings of the IEEE Nuclear Science Symposium and Medical Imaging Conference 2013, Seoul, Korea (2013).