Abstract
Purpose: To use feed-forward active contours (snakes) to track and measure brachial artery vasomotion on ultrasound images recorded in both transverse and longitudinal views; and to compare the algorithm's performance in each view.
Methods: Longitudinal and transverse view ultrasound image sequences of 45 brachial arteries were segmented by feed-forward active contour (FFAC). The segmented regions were used to measure vasomotion artery diameter, cross-sectional area, and distention both as peak-to-peak diameter and as area. ECG waveforms were also simultaneously extracted frame-by-frame by thresholding a running finite-difference image between consecutive images. The arterial and ECG waveforms were compared as they traced each phase of the cardiac cycle.
Results: FFAC successfully segmented arteries in longitudinal and transverse views in all 45 cases. The automated analysis took significantly less time than manual tracing, but produced superior, well-behaved arterial waveforms. Automated arterial measurements also had lower interobserver variability as measured by correlation, difference in mean values, and coefficient of variation. Although FFAC successfully segmented both the longitudinal and transverse images, transverse measurements were less variable. The cross-sectional area computed from the longitudinal images was 27% lower than the area measured from transverse images, possibly due to the compression of the artery along the image depth by transducer pressure.
Conclusions: FFAC is a robust and sensitive vasomotion segmentation algorithm in both transverse and longitudinal views. Transverse imaging may offer advantages over longitudinal imaging: transverse measurements are more consistent, possibly because the method is less sensitive to variations in transducer pressure during imaging.
Keywords: flow-mediated dilatation, active contour, snake, endothelial function, ultrasound segmentation
INTRODUCTION
There is increasing interest in defining artherosclerotic plaque and arterial wall parameters predictive of cardiovascular events1 associated with diseases such as hypertension and diabetes mellitus. High-resolution broadband ultrasound is an attractive noninvasive method of imaging large blood vessels in real time. The pulsatile motion of the vessel wall is visible during scanning, but wall displacement between frames is so small that sensitive methods must be developed to measure the changes. Several ultrasound techniques have been proposed to track vascular wall motion over the cardiac cycle, including echo tracking on raw RF ultrasound signal,2 and analysis of B-mode, M-mode, and Doppler images.3, 4, 5, 6, 7, 8 Although the prognostic power of measurements on vascular ultrasound has been demonstrated in several studies9, 10, 11 vascular reactivity testing is not used in the clinic for segmentation and measurement due to user dependence, differences between scanners, and lack of standard algorithms and protocols.9
Increased resolution and improvements in near-field ultrasound imaging, advances in image processing, and faster computers enable algorithms to assess vascular dynamics on video. Unlike echo tracking methods, which are not available on all scanners and which are specific to the scanners on which they are implemented, image analysis algorithms are generalizable, facilitating multicenter clinical trials in vascular labs with different ultrasound machines. Several authors have previously described methods to segment vessels on grayscale ultrasound,12, 13, 14, 15 but the emphasis has been on analyzing individual frames to measure intima-media thickness, an important clinical parameter used to evaluate carotid arteries. We propose a feed-forward active contour (snake) to segment a series of images acquired over many cardiac cycles. Although long-axis (longitudinal) view is commonly used for evaluating flow-mediated dilation, short-axis view has also been proposed16, 17 as having some advantages. The snake described in this study can track pulsatile vasomotion and can be measured to obtain the distensibility waveforms of arteries in both longitudinal and transverse views. The measurements from both views are compared to identify and evaluate the effect of external transducer pressure during vascular imaging.
METHODS
Automated segmentation: Active contour (snake)
Active contours or snakes were first introduced by Kass et al.18 and later refined by other investigators.19 Snakes are parametric curves that find or track image edges. On a 2D image, a snake can be parameterized either as a closed curve or as a line-snake that meanders between two fixed endpoints. For this study, closed curves were used for transverse views of arteries, and two line-snakes between fixed endpoints were used for the distal and proximal artery walls in longitudinal view. See the Appendix for implementation details.
A snake in an image frame is initialized and then iteratively deformed by a force field defined on the image until reaching a configuration of minimum energy, where total energy can consists of both (1) internal energy from internal forces of the curve configuration, such as resistance to bending and stretching; and (2) external energy from local image properties, for instance the attractive force of an edge. In its simplest formulation, external energy is just the magnitude of the image's smoothed gradient, or the Sobel edge map. Figures 12 show Sobel edge maps and gradient force fields for both longitudinal and transverse images. The two figures show that horizontal edges are stronger than vertical edges, which is to be expected because of the higher axial resolution in ultrasound images, and has important implications for segmentation results (see Sec. 4).
Figure 1.
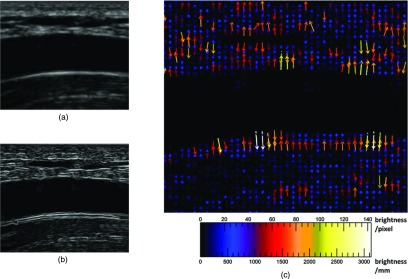
External force on brachial artery ultrasound image, longitudinal view. (a) Brachial artery, unprocessed longitudinal view. (b) Sobel edge map of brachial artery, longitudinal view. The snake is attracted to the edges, which are smoothed gradients in the image. The longest edges are horizontal and follow the artery walls, especially the bottom distal wall. (c) External force vector field on brachial artery, longitudinal view. Arrows show direction and relative magnitude of external image gradient force as grayscale brightness change per unit distance. Brighter, longer arrows indicate greater force. The forces are mostly vertical, orthogonal to and pointing towards the edges in panel B. Vertical gradients and horizontal edges are more prominent on ultrasound because of its higher axial resolution, which may affect segmentation and measurement interpretation.
Figure 2.
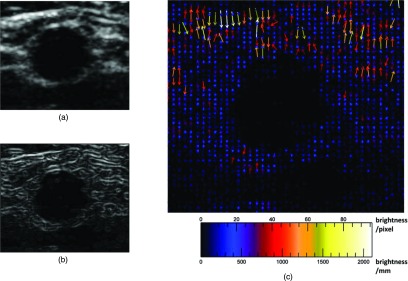
External image force on brachial artery ultrasound image, transverse view. (a) Brachial artery, unprocessed transverse view. (b) Sobel edge map of brachial artery, transverse view. The snake is attracted to these edges, which are smoothed gradients in the image. There are no long edges around the artery; the most prominent is the proximal edge at the artery's top, due to echo enhancement. (c) External force vector field on brachial artery, transverse view. Arrows show direction and relative magnitude of external image gradient force as grayscale brightness change per unit distance. Brighter, longer arrows indicate greater force. The horizontal tissue interfaces near the top of the image have much stronger edges and gradients than the actual artery wall around the central dark blob, where the gradients are weak. Despite weak edges, the local forces are still strong enough to attract the snake to the artery wall.
Feed-forward segmentation of time-sequence images
The snake formulation above refines a user-defined initial contour on one image. For tracking vasomotion, the snake must follow a contour over a time-sequence IT of image frames:
| (1) |
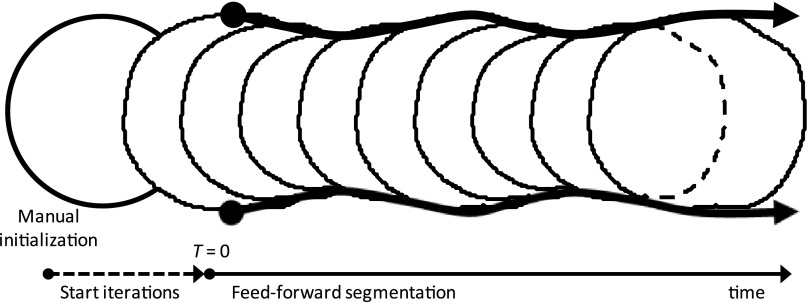
where frames at time indices T are separated by the resolution of video capture, typically 33 ms. The process of feed-forward segmentation is illustrated in Fig. 3. To segment the brachial artery over time, for each frame IT a snake is initialized with the final contour from the previous frame IT− 1; the snake reconfigures itself as described above; and then each frame's final snake is fed forward as the next frame's initialization. The first frame in the image sequence I0 is the only frame initialized with a manually drawn region of interest. For cross-sectional manual initialization, the user draws a closed-contour cross section. For longitudinal manual initialization, the user draws a quadrilateral with two opposite sides that roughly follow the distal and proximal artery walls, used to initialize two line-snakes and to constrain the segmentation horizontally: the line-snakes track the top and bottom artery edges between the leftmost and rightmost points of the initialization.
Figure 3.
Feed-forward snake segmentation, transverse view. A user draws a rough artery boundary (manual initialization, leftmost circle). The manual boundary is deformed for many iterations (start iterations) until it converges to a detailed boundary (at T = 0). The detected boundary from each image frame is fed forward frame by frame over time, so that each consecutive frame is initialized with the snake boundary found in the previous frame.
The initialization on each frame is deformed iteratively by the snake algorithm until it converges to a stable shape, as described earlier [Eq. A7]. The final snake x then is fed forward to initialize the subsequent frame:
| (2) |
where N is the number of contour iterations determined to be sufficient for the snake shape to reach equilibrium. It is important to distinguish between study time index T (or frame number) and the time step t used by convention in the numerical Euler method to deform the snake shape at study time T until convergence. Because consecutive image frames are only separated by a small time interval in study time (33 ms), the blood vessel contours between frames are very similar. This has two important consequences: first, the vessel contour from image frame IT can be propagated to the next image as its snake initialization; and second, the snake does not need to deform much between frames to track changes, and only a small number of iterations is needed for convergence.
Artery diameter, area, and distention measurement
The artery diameter, cross-sectional area, and the associated distentions were measured from the ultrasound images and plotted as waveforms over the cardiac cycles for both longitudinal and transverse images. For the longitudinal snake, the diameter is the area of the segmented region divided by the length of a least-squares-fit line segment through its interior, where the segment's endpoints are always constrained by the manual initialization at T = 0 as described in Sec. 2B; the mean of longitudinal snake diameters for a subject is DLNG. Cross-sectional area for the longitudinal snake is the area from of the equivalent circle at this diameter DLNG, or ALNG = π(DLNG/2)2. In transverse view, it is natural to obtain area directly: cross-sectional area is the calibrated area of the pixels enclosed by the region; and the mean of transverse areas for a subject is ATRV. Also in transverse view, the major and minor axes of a best-fit ellipse were calculated from the eigenvalues of the distribution tensor of the shape around its centroid and used to assess symmetry and identify possible compression. The length of the minor axis is the equivalent diameter in transverse view, or DTRV. Finally, distention was determined by measuring the peak-to-peak changes of the diameter or area over the cardiac cycles: DPP for the diameter distention from the longitudinal snake, and APP for area distention from the transverse snake.
ECG extraction
The ECG was extracted from the image sequences by detecting changes in the trace between frames over time within a user-defined box. Difference images in all consecutive frames were thresholded to find where the trace changed. Because of analog noise, the trace will change either at a few localized pixels, or at no pixels. The center of mass of the localized pixel cloud was returned as the new trace coordinate. Finally, frequency analysis using a Fourier transform of the extracted ECG waveform was used to calculate heart rate.
Ultrasound imaging
Ultrasound imaging was performed by an experienced sonographer with subjects lying in a supine position. The brachial arteries of 45 subjects with no ultrasound evidence of atherosclerotic disease were scanned in compound imaging mode with a 15-7-MHz hockey stick transducer using a Philips HDI 5000 Scanner (Philips Ultrasound, Bothell, WA). Standard presets recommended by the manufacturer for vascular imaging were used. For each subject the artery was imaged in the long and short axis planes. During imaging normal pressure necessary for proper coupling of the transducer to the skin was applied. The sonographer attempted to keep pressure constant during image acquisition. To evaluate the effect of pressure on vascular dimensions, images were also acquired at low, modest, moderate, and high pressure by manually pushing the transducer with increasing force. The ultrasound image sequences were stored as cineloops and analyzed offline.
Manual segmentation versus automated snake segmentation
To compare manual and automated segmentations, three subjects were chosen randomly from the 45 cases. Each case was analyzed manually as well as by automated active contour (snake). Manual analysis consisted of the user defining the arterial lumen manually in at least the first 5 s or 150 images of the cineloop; automated snake analysis required manual segmentation only on the first frame. For cross-sectional manual initialization, the user drew a closed-contour cross section. For longitudinal manual initialization, the user drew a quadrilateral with two opposite sides that roughly followed the distal and proximal artery walls. An observer (CBR) manually traced the brachial artery in every frame of each image sequence in the longitudinal and transverse views for three subjects. For the longitudinal images, the diameter of the artery on each frame was measured manually using digital calipers. For the transverse images, the area was calculated from the number of pixels enclosed in the manually drawn regions.
For automated analysis, using the manually defined regions on the first frames as initial guesses, the active contour algorithm segmented and measured the brachial artery on all the images to generate lumen diameter and area waveforms from the longitudinal and transverse sequences. The automated and manual segmentations were compared using several criteria, including waveform quality, or the pulsatility evident in the waveform over the cardiac cycle; area, diameter, and associated distention measurements; and time necessary for users to complete the analysis.
Inter- and intraobserver snake variability
To evaluate snake variability to initialization from different observers, ten subjects’ image sequences were chosen randomly from the 45 cases, then segmented by three observers both in the longitudinal and transverse views using the snake: each observer manually traced the artery lumen on the first image of the sequence, and then feed-forward active contour segmentation was used to automatically segment the remaining images. To evaluate intraobserver variability, the same ten cases were analyzed by one observer manually tracing the region of interest three times. For the longitudinal images, each observer calculated their mean diameter distention as peak-to-peak diameter (DPP) and their mean diameter (DLNG) on each subject. For the transverse images, each observer calculated their mean area distention (APP) and mean area (ATRV) on each subject.
Three different methods were used to evaluate the interobserver and intraobserver variability. ANOVA was performed on DLNG, DPP, ATRV, and APP as a sanity check to test the null hypothesis that the measurements from the three observers had the same mean (p ≥ 0.05), assessing the potential of the proposed automated segmentation for population studies. Coefficient of variation (CV), on the other hand, is a measure of case-by-case variation between observers. CV was calculated for each subject by taking the ratio of the standard deviation to the mean of the measurements from the three observers. Finally, regression analysis provides a measure of correlation between individual measurements from the three observers. Linear regression was performed by fitting the data to the model y = mx, where unit slope (m = 1) is ideal agreement between two observers, and R2 is the variation in the agreement.
RESULTS
Longitudinal view
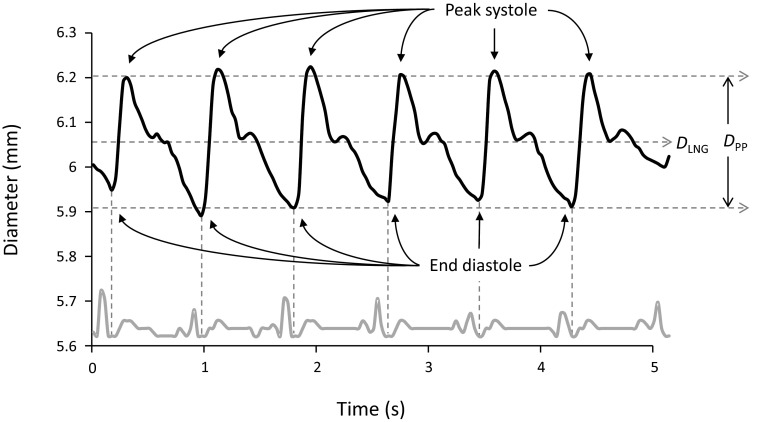
The brachial artery diameter waveform derived from segmenting a time-sequence of ultrasound images obtained in longitudinal view is shown in Fig. 4. The figure shows data from six cardiac cycles. In each cardiac cycle the diameter increases rapidly during systole to a peak, then decreases slowly, passing through the dicrotic notch near end systole, and finally reaching a minimum at late diastole. Figure 4 also shows the mean diameter DLNG and the peak-to-peak diameter DPP, a measure of arterial distention. The mean diameter of the brachial artery for all subjects was 3.78 ± 0.85 mm. The average distention was 0.20 ± 0.09 mm.
Figure 4.
Diameter of the brachial artery from longitudinal ultrasound images. The upper waveform shows the automatically calculated diameter of the brachial artery from ultrasound video acquired in longitudinal view over six cardiac cycles. The lower gray waveform is the ECG recorded simultaneously and then automatically extracted. The minima of the diameter waveform correspond to end diastole. The dicrotic notch at end systole is visible for every cycle. DLNG is mean diameter. The peak-to-peak diameter DPP is a measure of arterial distention, which can be seen to vary slightly with respiration. Over six cardiac cycles, the maximum distention for this artery was 0.3 mm.
Transverse view
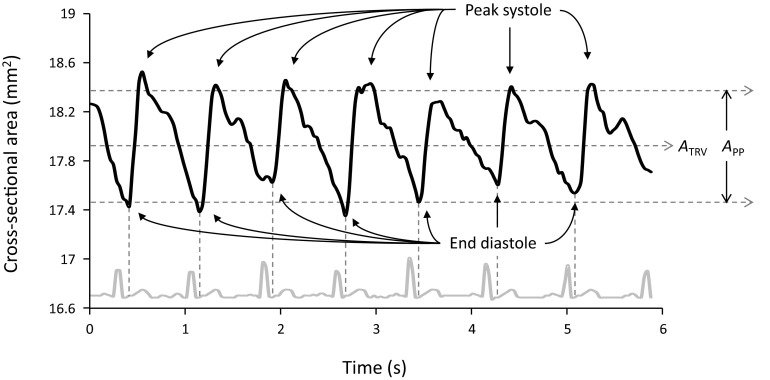
The brachial artery diameter waveform derived from segmenting a time-sequence of ultrasound images obtained in transverse view is shown in Fig. 5. Similar to the data shown in Fig. 4, in each cardiac cycle the area of the artery rapidly increases during systole to a peak, then decreases slowly, passing through the dicrotic notch near end systole, and finally reaching a minimum at late diastole. The mean area ATRV and the arterial area distention APP for the subject are shown in Fig. 5. The mean area of the brachial artery cross section for all subjects was 16.2 ± 6.5 mm2. The average area distention was 0.85 ± 0.45 mm2.
Figure 5.
Cross-sectional area of the brachial artery from transverse ultrasound images. The upper waveform shows the automatically calculated cross-sectional area of the brachial artery from ultrasound video acquired in transverse view over seven cardiac cycles. The lower gray waveform is the ECG recorded simultaneously and then automatically extracted. The minima of the diameter waveform correspond to end diastole. ATRV is mean area. The peak-to-peak area APP is a measure of arterial distention.
Manual segmentation versus automated snake segmentation
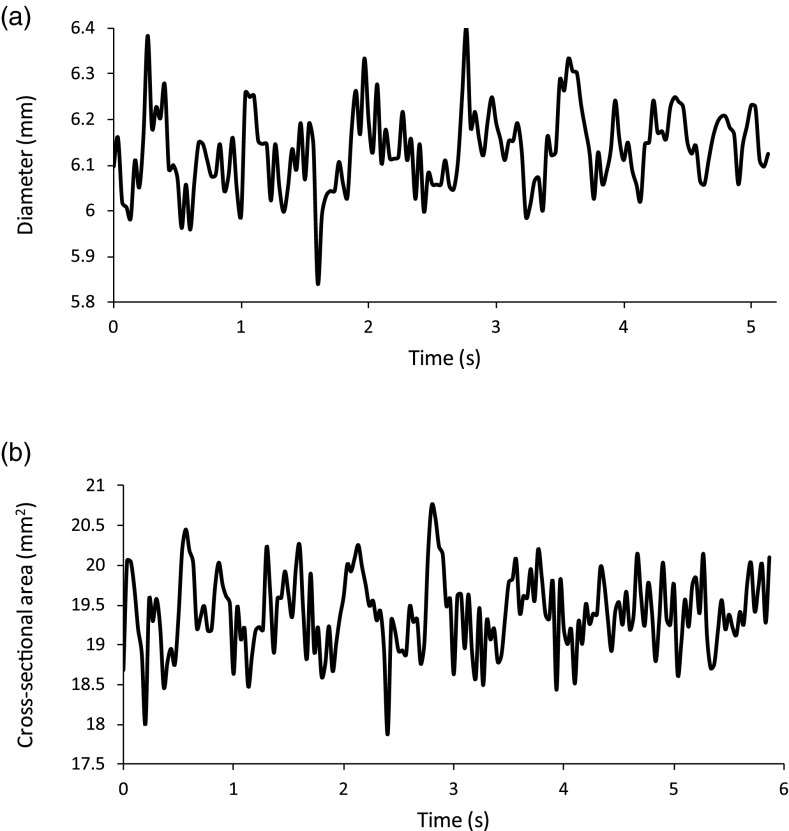
The diameter and area distention waveforms of manually traced brachial arteries in longitudinal and transverse views are shown in Fig. 6. Compared to the automated waveforms for these same two cases in Figs. 45, these waveforms are irregular and pulsatility is not evident. On average, the longitudinal images took 70 min per case to manually trace. The mean diameters from manual segmentation were 6.13 ± 0.09, 3.67 ± 0.07, and 3.26 ± 0.05 mm for the three subjects, compared to 6.05 ± 0.09, 3.45 ± 0.05, and 3.23 ± 0.05 mm for automated segmentation. The difference between diameters determined by the two methods was not significant (p = 0.94). On average, the transverse images took 120 min per case to manually trace. The mean areas from manual tracing were 19.40 ± 0.49, 13.50 ± 0.48, and 8.33 ± 0.42 mm2 for the three subjects, compared to 18.00 ± 0.29, 13.80 ± 0.23, and 7.74 ± 0.30 mm2 for automated segmentation. The difference between the areas determined by the two methods was not significant (p = 0.90). Diameter and area mean values were found to be comparable: a two-sample t-test assuming unequal variances gave a p-value of 0.90.
Figure 6.
Manual segmentation waveforms. (a) The diameter measurements from a manual segmentation of a pulsing brachial artery for 5 s of longitudinal ultrasound, the same images segmented by the snake for Fig. 4. Compared to the snake's waveform, the manual waveform is not well behaved and the cardiac cycles are not clear. (b) The cross-sectional area measurements from a manual segmentation of a pulsing brachial artery for 6 s of transverse ultrasound, the same images segmented by the snake for Fig. 5. Compared to the snake's waveform, the manual waveform is not well behaved and the cardiac cycles are not clear.
Interobserver snake variability
Table 1 shows the results of automated image segmentation on ten cases using initializations from three different observers; Table 2 shows the parameters for linear regression between observer measurements. For longitudinal images, the three observers had diameters of 3.71 ± 0.50; 3.52 ± 0.46; and 3.70 ± 0.67 mm (Table 1). The difference in means was not significant (p = 0.70), and the coefficient of variation was 5.65%. The average R2 for diameter between observers was 0.75 and the average slope was 1.00 (Table 2). The calculated diameter distentions were 0.177 ± 0.092, 0.210 ± 0.094, and 0.180 ± 0.070 mm (Table 1); the difference in the mean distentions was not significant (p = 0.64); and the coefficient of variation was 18.4%. The average R2 for diameter distention between observers was 0.50 and the average slope was 0.96 (Table 2).
Table 1.
Interobserver snake reproducibility. Three observers initialized snakes on ten images in both the longitudinal and transverse views, then the final segmentations were measured for mean longitudinal diameter DLNG and peak-to-peak distension DPP, as well as mean transverse area ATRV and distension APP. The ± values are standard deviation. p-values were also calculated between each observer, and none were found to be significant (p > 0.05).
| Longitudinal diameter |
Transverse area |
|||
|---|---|---|---|---|
| Observer | Mean diameter DLNG (mm) | Mean distension DPP (mm) | Mean area ATRV (mm2) | Mean distension APP (mm2) |
| 1 | 3.71 ± 0.50 | 0.177 ± 0.092 | 15.14 ± 4.22 | 0.841 ± 0.420 |
| 2 | 3.52 ± 0.46 | 0.210 ± 0.094 | 15.03 ± 4.81 | 0.847 ± 0.376 |
| 3 | 3.70 ± 0.67 | 0.180 ± 0.070 | 16.38 ± 4.78 | 0.772 ± 0.449 |
Table 2.
Interobserver snake variability. Measurements from snakes initialized from three observers were regressed against one another. Longitudinal measurements had more variation: DLNG and DPP had lower R2 values than ATRV and APP, and the slopes of the longitudinal models were farther from 1.
| Longitudinal diameter |
Transverse area |
|||||||
|---|---|---|---|---|---|---|---|---|
|
DLNG |
DPP |
ATRV |
APP |
|||||
| Observers | R2 | Slope | R2 | Slope | R2 | Slope | R2 | Slope |
| 1–2 | 0.87 | 0.95 | 0.63 | 1.12 | 0.94 | 1.00 | 0.92 | 0.98 |
| 1–3 | 0.64 | 1.00 | 0.33 | 0.93 | 0.90 | 1.08 | 0.90 | 0.99 |
| 2–3 | 0.75 | 1.05 | 0.54 | 0.82 | 0.90 | 1.08 | 0.96 | 1.01 |
| Average | 0.75 | 1.00 | 0.50 | 0.96 | 0.91 | 1.05 | 0.93 | 0.99 |
For the transverse cases, the three observers had mean areas of 15.14 ± 4.22, 15.03 ± 4.81, and 16.38 ± 4.78 mm2 (Table 1). The difference in means was not significant (p = 0.70), and the coefficient of variation was 5.66%. The average area R2 between observers was 0.91 and the average slope was 1.05 (Table 2). The calculated area distentions were 0.841 ± 0.420, 0.847 ± 0.376, and 0.772 ± 0.449 mm2 (Table 2); the difference in the mean distentions was not significant (p = 0.64); and the coefficient of variation was 7.26%. The average R2 for distention between observers was 0.93 and the average slope was 0.99 (Table 2).
Intraobserver snake variability
Table 3 shows the results of automated image segmentation on ten cases using three initializations from one observer; Table 4 shows the parameters for linear regression between measurements from three trials. For longitudinal images, the three trials had diameters of 3.57 ± 0.52; 3.59 ± 0.40; and 3.60 ± 0.50 mm (Table 3). The difference in means was not significant (p = 0.99), and the coefficient of variation was 0.98%. The average R2 for diameter between observers was 0.98 and the average slope was 1.00 (Table 4). The calculated diameter distentions were 0.199 ± 0.082, 0.176 ± 0.088, and 0.188 ± 0.085 mm (Table 3); the difference in the mean distentions was not significant (p = 0.84); and the coefficient of variation was 12.9%. The average R2 for diameter distention between observers was 0.84 and the average slope was 0.96 (Table 4).
Table 3.
Intraobserver snake reproducibility. Three regions were initialized by one observer on ten images in both longitudinal and transverse views. The final segmentations were measured for mean longitudinal diameter DLNG and peak-to-peak distension DPP, as well as mean transverse area ATRV and distension APP. The ± values are standard deviation. p-values were also calculated between each observer, and none were found to be significant (p > 0.05).
| Longitudinal diameter |
Transverse area |
|||
|---|---|---|---|---|
| Trial | Mean diameter DLNG (mm) | Mean distension DPP (mm) | Mean area ATRV (mm2) | Mean distension APP (mm2) |
| 1 | 3.57 ± 0.52 | 0.199 ± 0.082 | 15.16 ± 4.28 | 0.787 ± 0.342 |
| 2 | 3.59 ± 0.40 | 0.176 ± 0.088 | 15.17 ± 4.65 | 0.792 ± 0.351 |
| 3 | 3.60 ± 0.50 | 0.188 ± 0.085 | 15.07 ± 4.53 | 0.716 ± 0.336 |
Table 4.
Intraobserver snake variability. Measurements from snakes initialized from three trials by one observer were regressed against one another. Longitudinal measurements showed more variation: DLNG and DPP had lower R2 values than ATRV and APP, and in general the slopes of the longitudinal models were farther from 1.
| Longitudinal diameter |
Transverse area |
|||||||
|---|---|---|---|---|---|---|---|---|
| DLNG | DPP | ATRV | APP | |||||
| Trial |
R2 |
Slope |
R2 |
Slope |
R2 |
Slope |
R2 |
Slope |
| 1–2 | 0.99 | 1.00 | 0.82 | 0.90 | 0.98 | 1.00 | 0.96 | 1.00 |
| 1–3 | 0.98 | 1.00 | 0.93 | 0.95 | 0.99 | 0.99 | 0.85 | 0.91 |
| 2–3 | 0.98 | 1.00 | 0.76 | 1.03 | 0.99 | 0.99 | 0.90 | 0.76 |
| Average | 0.98 | 1.00 | 0.84 | 0.96 | 0.99 | 0.99 | 0.90 | 0.89 |
For the transverse cases, the three trials had mean areas of 15.16 ± 4.28, 15.17 ± 4.65, and 15.07 ± 4.53 mm2 (Table 3). The difference in means was not significant (p = 1.0), and the coefficient of variation was 1.60%. The average area R2 between trials was 0.99 and the average slope was 0.99 (Table 4). The calculated area distentions were 0.787 ± 0.342, 0.792 ± 0.351, and 0.716 ± 0.336 mm2 (Table 3); the difference in the mean distentions was not significant (p = 0.86); and the coefficient of variation was 9.5%. The average R2 for distention between trials was 0.90 and the average slope was 0.89 (Table 4).
Comparison of longitudinal and transverse imaging
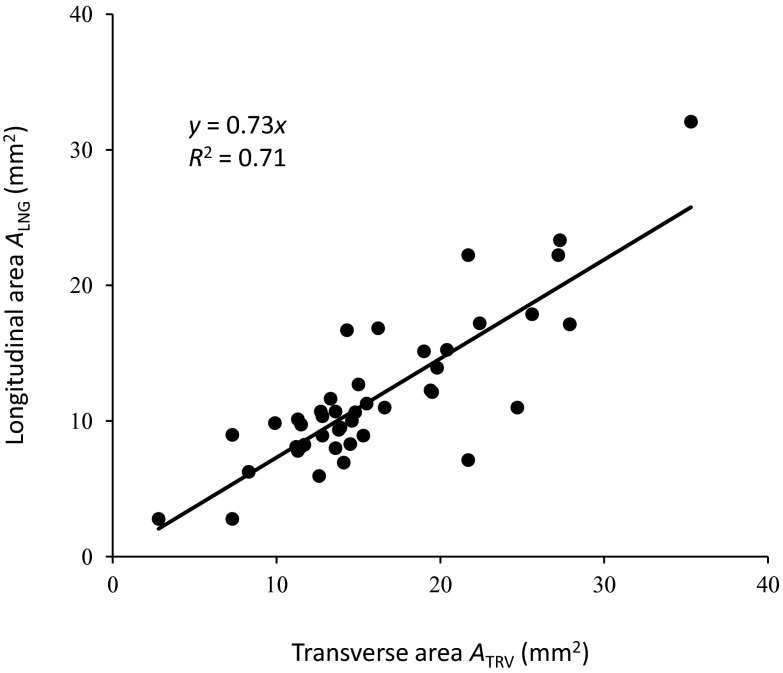
Figure 7 compares the measured longitudinal (ALNG) and transverse (ATRV) areas of the artery, where the longitudinal area was calculated from the diameter measurement assuming a circular artery cross section. The linear regression model was ALNG = 0.73ATRV, with R2 of 0.71 (Fig. 7). The longitudinal area was on average 27% smaller than the transverse area. The mean longitudinal area of all subjects was 12.6 ± 5.5 mm2 compared to the mean transverse area of 17.2 ± 7.0 mm2. The difference was significant (p = 12 × 10−07).
Figure 7.
Comparison of brachial artery cross-sectional area measured from longitudinal and transverse ultrasound images. The transverse (ATRV) and longitudinal area (ALNG) for every case were plotted and fit to the model ALNG = 0.73ATRV. The slope of 0.73 indicates that cross-sectional area derived from longitudinal-view measurement is on average 27% less than transverse-view cross-sectional area. The R2 of 0.71 indicates that the linear model accounts for 71% of the variation.
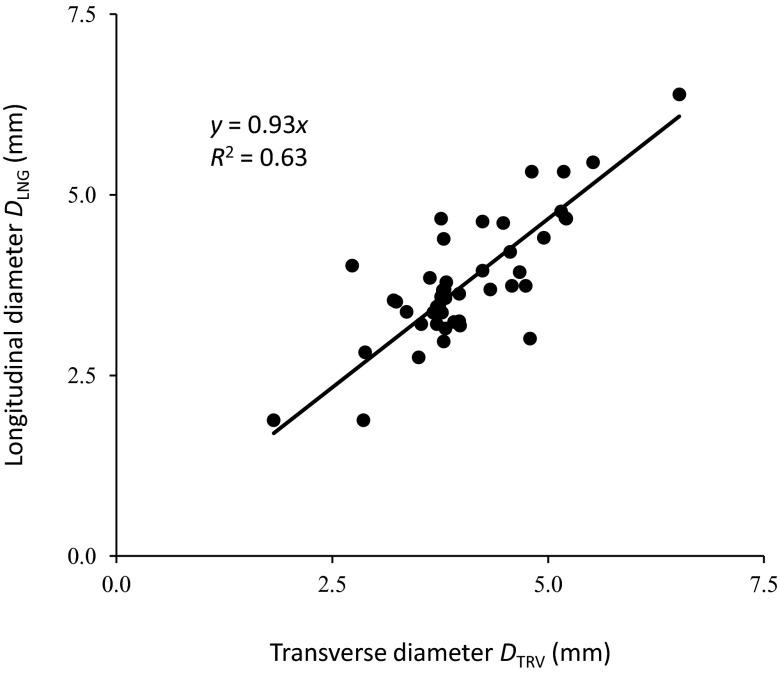
The transverse diameter DTRV was calculated by taking the short axis of the best-fit ellipse through the segmented cross section. The mean DTRV of all the cases along the depth was 4.06 ± 0.83 mm, compared to 3.80 ± 0.87 mm for DLNG. The difference was not significant (p = 0.16). The linear regression model was DLNG = 0.93DTRV, with R2 of 0.63 (Fig. 8). Longitudinal-view diameter is smaller in this model than transverse-view diameter, but only by 7%, and the difference is not statistically significant.
Figure 8.
Comparison of brachial artery diameter measured from longitudinal and transverse ultrasound images. The longitudinal diameter DLNG and transverse diameter DTRV for every case were plotted and fit to the model DLNG = 0.93ATRV. The slope of 0.93 indicates that diameter derived from longitudinal-view measurement is on average only 7% less than transverse-view equivalent diameter, or the diameter of the short axis of an ellipse fit to the segmented cross section. R2 of 0.63 indicates that the linear model accounts for 63% of the variation.
Effect of transducer pressure
Figure 9 shows longitudinal images acquired by pressing the ultrasound transducer with increasing pressure. The diameter measured from the images decreased with increasing pressure: 3.6 ± 0.3 mm at low pressure; 3.3 ± 0.2 mm at modest pressure; 3.2 ± 0.1 mm at moderate pressure; 3.1 ± 0.1 mm at high pressure. A small blood vessel in the image also collapsed with the increase in pressure (arrow in Fig. 9).
Figure 9.
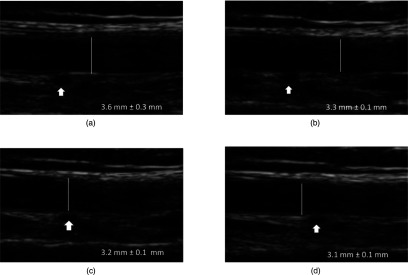
Ultrasound transducer pressure compression of the brachial artery. Increasing the subjective external transducer pressure from (a) low, to (b) modest, to (c) moderate, to (d) high, decreases the manually measured artery diameter and collapses a small vessel (arrow).
DISCUSSION
This study demonstrates that the feed-forward snake is robust and sensitive enough to segment pulsatile brachial arteries on ultrasound image sequences in both longitudinal and transverse views. By refining and propagating a rough user-defined initial margin, the snake tracked the small shape changes that occur in consecutive images over many cardiac cycles. Ultrasound has nonuniform resolution, so longitudinal edges are strong, while lateral edges in the transverse view might be completely missing, yet the same snake model segmented the brachial artery in both views, and the distention measurements and waveforms from both views were in close agreement. The advantage of the snake formulation is that its intuitive physical parameters (elasticity, rigidity) may make it versatile enough for tracking vessels not just in different views, but on images of different quality from different scanners, acquired by different sonographers, under the diverse conditions encountered in clinical studies.
Kao et al. and Stroz et al. demonstrated that transverse-view measurements of the pulsatile brachial artery are comparable to longitudinal-view measurements, but may have less variability.16, 17 The current study corroborates this observation, and the measurement from the snake in both views were reproducible. ANOVA on the measurements DLNG, DPP, ATRV, and APP obtained by three different observers and three trials by the same observer showed no difference in the means of the populations (p > 0.05). However, for interobserver studies case-by-case coefficients of variation of 5.65% and 5.66% were observed for diameter and area measurements; and higher coefficients of 18.4% and 7.26% were observed for diameter and area distention calculations. The larger coefficient of variation for distention is related to its small magnitude, approximately 0.2 mm, at the limit of image resolution, on the order of only a few pixels. Intraobserver variation in general was lower than intraobserver variation. The case-by-case coefficients of variation for intraobserver measurements were 1.0% and 1.6% for diameter and area measurements; and 12.9% and 9.5% for diameter and area distention calculations.
The automated snake is clearly superior to manual segmentation. The snake successfully segmented the brachial artery for all the cases, and on average required 94 fewer minutes of manual intervention per case. The mean diameter and area measurements from manual and automated segmentation agreed (Table 1). Lack of statistical difference between mean manual and automated measurements suggest that the snake is at least as good as manual segmentation for measuring brachial artery dimension, but the manual segmentation was unable to track small changes between frames, and did not produce acceptable distention waveforms.
Automated snake distention waveforms on the other hand were well behaved, clearly showing pulsatility: in each cardiac cycle the diameter or area increased rapidly during systole to a peak, then decreased slowly, passing through the dicrotic notch near end systole, and then finally reached a minimum at late diastole (Figs. 45). Although the changes in diameter and area during pulsatile vasomotion are small, the active contour and feed-forward segmentation had sufficient resolution to measure these changes.
Since longitudinal and transverse images of the brachial artery correspond to the same region, the dimension measurements obtained from the two methods should be the same. However, measurements of the same brachial artery in longitudinal and transverse views were correlated but the equivalent-circle area calculated from longitudinal diameter measurements was 27% lower than the cross-sectional area measured from transverse studies, and the difference was statistically significant (p < 0.0001) (Fig. 7). The underestimation of vascular dimension in the longitudinal view has not been previously reported and could play an important role in explaining the variations observed in flow-mediated and Doppler volume flow measurements.
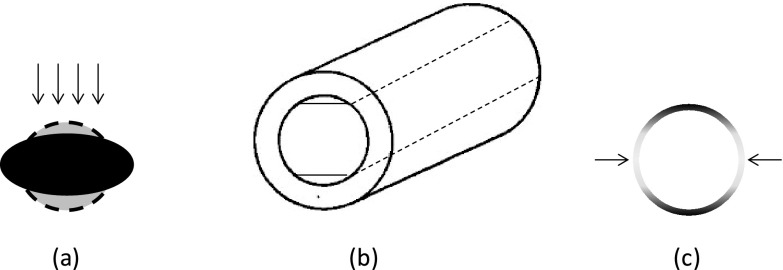
There are several possible reasons for brachial artery dimension underestimation on ultrasound in the longitudinal view. Pressure applied by the sonographer on the transducer during imaging compresses the artery into an ellipse [Fig. 10a].16 The longitudinal image only captures the short axis of the ellipse, whereas the transverse image captures the entire cross section. A second possible reason is the finite thickness of the ultrasound beam, which may cause curved surfaces of the artery to appear flat [Fig. 10b], decreasing the measured diameter in the longitudinal view. The third possible reason for the difference is the asymmetry in image resolution: lateral margins are very weak on transverse images, so the snake might get lost and bulge to either side of the cross section, although rigidity and other shape constraints should prevent this behavior [Fig. 10c]. A final possible reason for the difference is operator dependence. The operator must position the transducer over the center of the vessel to obtain the largest diameter. Selection of an off-center-axis image plane may result in a smaller diameter measurement, and hence a smaller cross-sectional area estimation.
Figure 10.
Possible reasons for systematic bias towards smaller brachial artery diameter measurements in the longitudinal view on ultrasound. (a) Compression by the transducer distorts the artery cross section, decreasing diameter in the direction of the beam. (b) Ultrasound beam thickness is large relative to artery curvature, making the curved surface appear flat. (c) Higher axial resolution makes transverse-view vertical edges relatively weak, so automated snake segmentation of a cross section might bulge out of the sides, making the artery appear larger in transverse view.
If the compression effect dominates, then DTRV, or the short-axis length of the cross section along the image depth, should be comparable to DLNG, and most of the observed bias should be due to the eccentricity of the ellipse, indicating its possible compression as deformation from an ideal circle. DLNG and DTRV were not statistically different (see Sec. 3 and Fig. 8), so external transducer pressure was most likely decreasing the artery diameter in the longitudinal view. These derived measurements on the experimental data are consistent with the direct measurements on the test images acquired at multiple pressure levels (Fig. 9), suggesting that the same transducer artery compression was also occurring to some extent during the longitudinal imaging.
Since currently transducer pressure is not calibrated and fixed during vascular imaging studies, arterial compression by the transducer could significantly influence interpretation of measurements taken in the longitudinal view. Direct transverse-view area measurements are more reliable, since depth compression in this plane is counterbalanced by lateral elongation. Although the transducer compression of the artery explains the systematic difference in area derived from the two views, the roles of beam thickness, poor lateral resolution, and operator dependence cannot be completely discounted, and future improvements in imaging technology or image analysis algorithms could further reduce the measurement variations reported in this study. However, since measurements in the transverse view in general had less variability and a higher R2 (Tables 2, 4), and since the transverse short-axis length is essentially the longitudinal diameter, transverse ultrasound images can possibly be used to take more useful artery measurements in studies like flow-mediated dilatation, a counterintuitive result since artery margins appear much stronger in the longitudinal view.
CONCLUSION
This study demonstrates that a snake can track the margins of a pulsatile artery on recorded ultrasound video over several cardiac cycles in both longitudinal and transverse views. Metrics on the snake can be defined for lumen dimensions and arterial wall distention, producing well-behaved waveforms that are not obtainable even with painstaking manual tracing. Such measurements on flow-mediated dilatation have been demonstrated to be predictive of cardiovascular disease,9, 10, 11 but flow-mediated dilatation is not widely used in the clinic due to its reliance on trained technicians and machine- and lab-specific techniques. The snake algorithm is robust, sensitive, and flexible; it did not fail on a single case and successfully segmented arteries in two views. The measurements on the snake in the two views agreed, but were also precise enough to reveal the systematic bias between them: pressure on the transducer compresses the artery and decreases the diameter in the longitudinal view. Pressure on the transducer should be standardized to limit arterial compression; and scanning in the transverse plane may result in more reliable measurements less susceptible to axial compression artifacts.
APPENDIX: SNAKE ALGORITHM IMPLEMENTATION AND PARAMETERS
Snakes are parametric curves that are iteratively deformed by a force field defined on an image until reaching a configuration of minimum energy, where total energy can consist of:
-
1.
Internal energy determined by curve configuration, such as resistance to bending and stretching; and
-
2.
External energy governed by local image properties such as edges;
-
3.
Optional constraints on curve evolution, such as spring and balloon forces.
The default values of the parameters used for this study are listed in Table 5.
Table 5.
Snake algorithm default parameters for longitudinal and transverse views. The same defaults were used in both views.
| Parameters | Longitudinal | Transverse |
|---|---|---|
| Internal forces (shape) | ||
| Elasticity (α) | 0.1 | 0.1 |
| Rigidity (β) | 0.5 | 0.5 |
| Deformation (Euler step) | ||
| Viscosity (γ) | 4.0 | 4.0 |
| External forces (image) | ||
| External weight (κ) | 0.9 | 0.9 |
| Convergence | ||
| Contour iterations | 30 | 30 |
| Start iterations | 120 | 120 |
On a 2D image, either a closed curve or a curve that stretches between any two fixed endpoints is parameterized as
| (A1) |
where we used closed curves for transverse views of arteries, and line-snakes between endpoints for the two artery walls in a longitudinal view. A snake is on an edge when it satisfies a force balance equation: the forces on either side of the snake curve cancel each other, inside and outside in the case of a closed-contour snake, or distal and proximal in a line-snake tracking an artery wall:
| (A2) |
External forces come from the image: the curve's attraction to an image edge. Internal forces are imposed by the curve's shape: its resistance to bending or stretching, for instance.
An active contour is active because it is iteratively deformed under these internal and external forces until it reaches a configuration of minimum energy E,
| (A3) |
where Eext and Eint are internal and external energy of the curve, under balanced external and internal forces. External energy Eext is defined to lead the snake towards image features like edges, so we start with any edge map of the image I, in the simplest formulation just the magnitude of its smoothed gradient G,
| (A4) |
where G is the smoothed gradient of the image found using the Sobel edge filter, or convolution (*) with finite differencing and smoothing kernels in two image directions, x and y.
While the external energy is derived from image grayscale, the internal energy comes from the shape of the snake x(s),
| (A5) |
where α and β are inelasticity and rigidity weights, respectively, controlling first- and second-order terms. α resists stretching along the curve's length; β resists bending.
To find the snake shape that minimizes energy, we deform iteratively over time t under the influence of the forces and solve the following equation using finite differencing:
| (A6) |
We can specify the finite-difference derivatives of the internal force with a banded pentadiagonal matrix A of order (|x|,|x|) where |x| is the number of curve vertices:
| (A7) |
Assuming that the external force ∇Eext is constant with each time step,
| (A8) |
where κ is an external force weight added to tune the snake; and γ is the Euler step size, which can be interpreted as a viscosity weight: the shape deforms more per time step if γ is high. We then solve for the shape xt using matrix inversion:
| (A9) |
where I is the identity matrix. In practice, we did not use a heuristic for convergence of the snake shape: a fixed number of t iterations, or contour iterations, was used for the analysis (Table 5).
References
- Leone N., Ducimetière P., Gariépy J., Courbon D., Tzourio C., Dartigues J. F., Ritchie K., Alpérovitch A., Amouyel P., Safar M. E., and Zureik M., “Distention of the carotid artery and risk of coronary events: The three-city study,” Arterioscler., Thromb., Vasc. Biol. 28(7), 1392–1397 (2008). 10.1161/ATVBAHA.108.164582 [DOI] [PubMed] [Google Scholar]
- Ramnarine K. V., Hartshorne T., Sensier Y., Naylor M., Walker J., Naylor A. R., Panerai R. B., and Evans D. H., “Tissue Doppler imaging of carotid plaque wall motion: A pilot study,” Cardiovasc. Ultrasound 1, 1–17 (2003). 10.1186/1476-7120-1-17 [DOI] [PMC free article] [PubMed] [Google Scholar]
- Beux F. et al. , “Automatic evaluation of arterial diameter variation from vascular echographic images,” Ultrasound Med. Biol. 27, 1621–1629 (2001). 10.1016/S0301-5629(01)00450-1 [DOI] [PubMed] [Google Scholar]
- Newey V. R. and Nassiri D. K., “Online artery diameter measurement in ultrasound images using artificial neural networks,” Ultrasound. Med. Biol. 28, 209–216 (2002). 10.1016/S0301-5629(01)00505-1 [DOI] [PubMed] [Google Scholar]
- Stadler R. W., Taylor J. A., and Lees R. S., “Comparison of B-mode, M-mode and echo-tracking methods for measurement of the arterial distention waveform,” Ultrasound Med. Biol. 23, 879–887 (1997). 10.1016/S0301-5629(97)00074-4 [DOI] [PubMed] [Google Scholar]
- Hoeks A. P., Brands P. J., Smeets F. A., and Reneman R. S., “Assessment of the distensibility of superficial arteries,” Ultrasound Med. Biol. 16, 121–128 (1990). 10.1016/0301-5629(90)90139-4 [DOI] [PubMed] [Google Scholar]
- Kanters S. D., Elgersma O. E., Banga J. D., van Leeuwen M. S., and Algra A., “Reproducibility of measurements of intima-media thickness and distensibility in the common carotid artery,” Eur. J. Vasc. Endovasc. Surg. 16, 28–35 (1998). 10.1016/S1078-5884(98)80088-9 [DOI] [PubMed] [Google Scholar]
- Lehmann E. D., “Elastic properties of the aorta,” Lancet 342, 1417 (1993). 10.1016/0140-6736(93)92772-L [DOI] [PubMed] [Google Scholar]
- Corretti M. C. et al. , “Guidelines for the ultrasound assessment of endothelial-dependent flow-mediated vasodilation of the brachial artery: A report of the International Brachial Artery Reactivity Task Force,” J. Am. Coll. Cardiol. 39(2), 257–265 (2002). 10.1016/S0735-1097(01)01746-6 [DOI] [PubMed] [Google Scholar]
- Celermajer D. S., Sörensen K. E., Bull C., Robinson J., and Deanfield J. H., “Endothelium-dependent dilation in the systemic arteries of asymptomatic subjects relates to coronary risk factors and their interaction,” J. Am. Coll. Cardiol. 24, 1468–1474 (1994). 10.1016/0735-1097(94)90141-4 [DOI] [PubMed] [Google Scholar]
- Thijssen D. H. J. et al. , “Assessment of flow-mediated dilation in humans: A methodological and physiological guideline,” Am. J. Physiol. Heart Circ. Physiol. 300, H2–H12 (2011). 10.1152/ajpheart.00471.2010 [DOI] [PMC free article] [PubMed] [Google Scholar]
- Zhu X., Zhang P., Shao J., Cheng Y., Zhang Y., and Bai J., “A snake-based method for segmentation of intravascular ultrasound images and its in vivo validation,” Ultrasonics 51, 181–189 (2011). 10.1016/j.ultras.2010.08.001 [DOI] [PubMed] [Google Scholar]
- Cheng D. C., Schmidt-Trucksäss A., Cheng K. S., and Burkhardt H., “Using snakes to detect the intimal and adventitial layers of the common carotid artery wall in sonographic images,” Comput. Meth. Prog. Biol. 67, 27–37 (2002). 10.1016/S0169-2607(00)00149-8 [DOI] [PubMed] [Google Scholar]
- Loizou C. P., Pattichis C. S., Pantziaris M., Tyllis T., and Nicolaides A. N., “Snakes based segmentation of the common carotid artery intima media,” Med. Biol. Eng. Comput. 45, 35–49 (2007). 10.1007/s11517-006-0140-3 [DOI] [PubMed] [Google Scholar]
- Golemati S., Stoitsis J., Sifakis E. G., Balkizas T., and Nikita K. S., “Using the Hough transform to segment ultrasound images of longitudinal and transverse sections of the carotid artery,” Ultrasound Med. Biol. 33, 1918–1932 (2007). 10.1016/j.ultrasmedbio.2007.05.021 [DOI] [PubMed] [Google Scholar]
- Kao Y. H., Mohler E. R., Arger P. H., and Sehgal C. M., “Brachial artery: Measurement of flow-mediated dilation with cross-sectional US-technical validation,” Radiology 228, 895–900 (2003). 10.1148/radiol.2283020966 [DOI] [PubMed] [Google Scholar]
- Stroz M. J. and Fenster A., “Measuring flow-mediated dilation through transverse and longitudinal imaging: Comparison and validation of methods,” Phys. Med. Biol. 55(21), 6501–6514 (2010). 10.1088/0031-9155/55/21/011 [DOI] [PubMed] [Google Scholar]
- Kass M., Witkin A., and Terzopoulos D., “Snakes: Active, contour models,” Int. J. Comput. Vision 1, 321–331 (1988). 10.1007/BF00133570 [DOI] [Google Scholar]
- Xu C. and Prince J. L., “Snakes, shapes, and gradient vector flow,” IEEE Trans. Image Processing 7(3), 359–369 (1998). 10.1109/83.661186 [DOI] [PubMed] [Google Scholar]


