

Abstract
Since the discovery of the first red fluorescent protein (RFP), named DsRed, 12 years ago, a wide pallet of red-shifted fluorescent proteins has been cloned and biotechnologically developed into monomeric fluorescent probes for optical microscopy. Several new types of monomeric RFPs that change the emission wavelength either with time, called fluorescent timers, or after a brief irradiation with violet light, known as photoactivatable proteins, have been also engineered. Moreover, RFPs with a large Stokes shift of fluorescence emission have been recently designed. Because of their distinctive excitation and fluorescence detection conditions developed specifically for microscopy, these fluorescent probes can be suboptimal for flow cytometry. Here, we have selected and summarized the advanced orange, red, and far-red fluorescent proteins with the properties specifically required for the flow cytometry applications. Their effective brightness was calculated for the laser sources available for the commercial flow cytometers and sorters. Compatibility of the fluorescent proteins of different colors in a multiparameter flow cytometry was determined. Novel FRET pairs, utilizing RFPs, RFP-based intracellular biosensors, and their application to a high-throughput screening, are also discussed.
Keywords: DsRed, RFP, mCherry, mOrange, FRET, FACS
I. Introduction
Chalfie et al. (1994) showed that a green fluorescent protein (GFP) from the jellyfish Aequorea victoria could be used as a marker for protein localization and expression in living bacteria and worm cells. Cloning of GFP and it first application in vivo dramaticly altered the nature and scope of the issues that could be addressed by cell biologists. Together with the introduction of new microscopy techniques, fluorescent proteins (FPs) changed the way life science research is performed today.
The next breakthrough in FP technology occurred in 1999 when six new FPs were cloned from nonbioluminescent Anthozoa species (Matz et al., 1999). One of the proteins, named drFP583, differed from GFP dramatically in its spectral properties, demonstrating a red fluorescence. The drFP583 protein, the gene for which was optimized for expression in mammalian cells, became the first commercially available red fluorescent protein (RFP), named DsRed for Discosoma sp. Recently, the majority of RFPs have been isolated and cloned from Anthozoa species living in the Indo-Pacific region (Piatkevich et al., 2010a; Verkhusha et al., 2003a).
Subsequently, the race was on to succeed in monomerization and improvement of wild-type RFPs in order to produce new probes suitable for multicolor imaging of cellular proteins and FRET pairs with emission in the longer wavelength region. A number of desirable changes to the physical and biochemical properties of FPs have been achieved through the intense molecular evolution (Campbell et al., 2002; Shaner et al., 2004). The increasing brightness, maturation efficiency, photostability, pH stability, and minimizing cytotoxicity significantly improved the utilization of RFPs for live-cell microscopy. Beside these enhancements, researches also succeeded in developing new types of monomeric RFPs, such as fluorescent timers (FTs) and photoactivatable FPs (PA-FPs), which are particularly useful for subcellular dynamics studies and superresolution imaging (Piatkevich and Verkhusha, 2010). Recently, engineered RFPs with large Stokes shift (LSS) can serve as additional red colors for multicolor imaging and hold great promises for multiphoton microscopy. At present, near-infrared FPs and FP-based biosensors with red emission are of great interest for FP developers. However, in general, the vast variety of currently available FPs is quite sufficient to study the majority of problems in cell biology.
Genetically encoded markers based on the GFP-like proteins have several advantages over the fluorescent dyes for applications in cell biology. FPs possess a unique ability to produce fluorescence after their expression in any prokaryotic or eukaryotic cell without additional enzymes or cofactors except for molecular oxygen. Moreover, a protein of interest can be easily tagged with an FP on a DNA level without affecting its intrinsic function. Consequently, FPs as reporter markers allow for studying temporal and spatial expression of genes by measuring their fluorescence signal in live cells and tissues, as well as localization and dynamics of cellular proteins, organelles, and virus particles. The recent expansion of spectrally distinct FP variants has enabled multicolor imaging for monitoring several events simultaneously.
Coupled with flow cytometry, the FP technology provides an amazing opportunity to noninvasively differentiate between various cell populations, monitor gene activities, and detect protein–protein interactions and small molecules in individual living cells in a high-throughput manner. Unfortunately, as yet RFPs have been underutilized in the flow cytometry and fluorescence-activated cell sorting (FACS) approaches. Recent advances in FP development and invention of the lasers emitting a variety of wavelengths greatly increase the performance and the capabilities of a multiparameter analysis with the FP-based flow cytometry. This chapter focuses on the novel improved RFPs, which are potentially useful for many FACS applications. We also describe the techniques for the utilization of RFPs as reporters and biosensors for the multiparameter flow cytometry.
II. Major Characteristics of FPs
Since the clonning of GFP, a large amount of practically usefull FPs have been isolated from different organisms or developed on the basis of wild-type FPs. We believe that the number of novel FPs will continue to grow. Not surprisingly, it is not always obvious which FP should be chosen from a nubmer of similar probes for a certain application. Below we describe the key characteristics of FPs that should be considered by a researcher for any applications of those probes in biological systems.
A. Molecular Brightness (Intrinsic Fluorescence Intensity)
Brightness of an FP is one of its most important characteristics. High brightness of an FP is usually an additional advantage for any cell biology application. Brightness determines the sensitivity and signal-to-noise ratio for the fluorescence detection. By definition, the molecular brightness of FP is the product of a molar extinction coefficient and quantum yield, measured in vitro. Since the extinction coefficient is a function of the wavelength, the effective brightness of an FP depends on the wavelenght of the excitation light. Moreover, the effective brightness is determined by emission filter sets used for detecting fluorescence (Fig. 1). Molecular brightness and effective brightness specified for certain laser excitations for common RFPs are presented in Tables I and II, respectively.
Fig. 1.
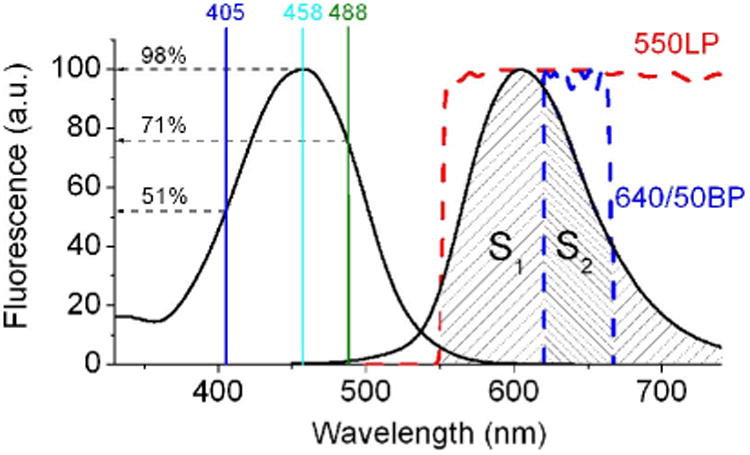
The fluorescence excitation and emission spectra of LSSmKate2 (solid lines) are shown. The wavelengths of the laser lines, 405, 458, and 488 nm, are shown by vertical lines with indication of excitation efficiency. The emission that passes through the 550 nm long pass (red dash line) and 640/50 nm band pass (blue dash line) filters is shown as cross-hatched region with square S1 and S2, respectively. The fluorescence intensity collected through the filters is proportional to the S1 and S2 squares. (For interpretation of the references to color in this figure legend, the reader is referred to the Web version of this chapter.)
Table I. Spectroscopic and biochemical properties of red-shifted FPs efficient in flow cytometry.
| Protein | Oligomeric state | Exmax (nm) | Emmax (nm) | ε (M−1 cm−1) | QY | Molecular brightness | PKa | τ1/2 maturation 37 °C (h) | References |
|---|---|---|---|---|---|---|---|---|---|
| Orange fluorescent proteins | |||||||||
| E2-Orange | Tetramer | 540 | 561 | 36,500 | 0.54 | 20 | 4.5 | 1.3 | Strack et al., 2009a |
| mOrange | Monomer | 548 | 562 | 71,000 | 0.69 | 49 | 6.5 | 2.5 | Shaner et al., 2004 |
| mKOκ | Monomer | 551 | 563 | 105,000 | 0.61 | 64 | 4.2 | 1.8 | Tsutsui et al., 2008 |
| mOrange2 | Monomer | 549 | 565 | 58,000 | 0.60 | 35 | 6.5 | 4.5 | Shaner et al., 2008 |
| tdTomato | Pseudomonomer | 554 | 581 | 138,000 | 0.69 | 95 | 4.7 | 1.0 | Shaner et al., 2004 |
| TagRFP | Monomer | 555 | 584 | 98,000 | 0.41 | 40 | <4.0 | 1.7 | Merzlyak et al., 2007 |
| TagRFP-T | Monomer | 555 | 584 | 81,000 | 0.41 | 33 | 4.6 | 1.7 | Shaner et al., 2008 |
| Red fluorescent proteins | |||||||||
| DsRed-Express2 | Tetramer | 554 | 591 | 35,600 | 0.42 | 15 | – | 0.7 | Strack et al., 2008 |
| mStrawberry | Monomer | 574 | 596 | 90,000 | 0.29 | 26 | <4.5 | 0.8 | Shaner et al., 2004 |
| LSSmKate2 | Monomer | 460 | 605 | 26,000 | 0.17 | 4.5 | 2.7 | 2.5 | Piatkevich et al., 2010b |
| mRuby | Monomer | 558 | 605 | 112,000 | 0.35 | 39 | 5 | 2.8 | Kredel et al., 2009 |
| mCherry | Monomer | 587 | 610 | 72,000 | 0.22 | 16 | <4.5 | 0.25 | Shaner et al., 2004 |
| mKeima | Monomer | 440 | 620 | 14,400 | 0.24 | 3 | 6.5 | 4.7 | Kogure et al., 2006 |
| mRaspberry | Monomer | 598 | 625 | 79,000 | 0.15 | 12 | 5.0 | 1.0 | Wang et al., 2004 |
| Far-red fluorescent proteins | |||||||||
| mKate2 | Monomer | 588 | 633 | 62,500 | 0.40 | 25 | 5.4 | <0.33 | Shcherbo et al., 2009a |
| Katushka2 | Dimer | 588 | 633 | 66,250 × 2 | 0.37 | 25 × 2 | 5.4 | <0.33 | Shcherbo et al., 2009a |
| E2-Crimson | Tetramer | 605 | 646 | 58,500 | 0.12 | 7 | 4.5 | 0.4 | Strack et al., 2009b |
| mNeptune | Monomer | 600 | 650 | 67,000 | 0.20 | 13 | 5.4 | ND | Lin et al., 2009 |
| TagRFP657 | Monomer | 611 | 657 | 34,000 | 0.10 | 3.4 | 5.0 | 2.0 | Morozova et al., 2010 |
Exmax, excitation maximum; Emmax, emission maximum; ε, molar extinction coefficient; QY, quantum yield; pKa, pH value, at which protein retains half of its fluorescent intensity; τ1/2, half-time of protein maturation. Molecular brightness is determined as a product of quantum yield and molar extinction coefficient divided by 1000. ND, not determined.
Table II. Effective brightness of red-shifted FPs using common lasers.
| Protein | Solid-state lasers | Gas lasers | ||||
|---|---|---|---|---|---|---|
|
|
|
|||||
| Line (nm) | Efficiency of excitation (%) | Effective brightness | Line (nm) | Efficiency of excitation (%) | Effective brightness | |
| mOrange | 488 | 20 | 10 | 488 | 20 | 10 |
| 532 | 62 | 30 | 514 | 50 | 24 | |
| 561 | 47 | 23 | 530 | 58 | 28 | |
| 592 | 0.4 | 0.2 | 568 | 18 | 9 | |
|
| ||||||
| mKOκ | 488 | 14 | 9 | 488 | 14 | 9 |
| 532 | 55 | 35 | 514 | 43 | 28 | |
| 561 | 70 | 45 | 530 | 52 | 33 | |
| 592 | 1 | 0.6 | 568 | 33 | 21 | |
|
| ||||||
| mOrange2 | 488 | 20 | 7 | 488 | 20 | 7 |
| 532 | 64 | 22 | 514 | 52 | 18 | |
| 561 | 53 | 19 | 530 | 60 | 21 | |
| 592 | 0.6 | 0.2 | 568 | 22 | 8 | |
|
| ||||||
| tdTomato | 488 | 27 | 26 | 488 | 27 | 26 |
| 532 | 64 | 61 | 514 | 55 | 52 | |
| 561 | 91 | 86 | 530 | 63 | 60 | |
| 592 | 4 | 4 | 568 | 63 | 60 | |
|
| ||||||
| TagRFP | 488 | 5 | 2 | 488 | 5 | 2 |
| 532 | 36 | 14 | 514 | 22 | 9 | |
| 561 | 92 | 37 | 530 | 35 | 14 | |
| 592 | 5 | 2 | 568 | 61 | 24 | |
|
| ||||||
| TagRFP-T | 488 | 5 | 1.6 | 488 | 5 | 1.6 |
| 532 | 36 | 12 | 514 | 22 | 7 | |
| 561 | 92 | 30 | 530 | 35 | 12 | |
| 592 | 5 | 1.6 | 568 | 61 | 20 | |
|
| ||||||
| DsRed-Express2 | 488 | 33 | 5 | 488 | 33 | 5 |
| 532 | 71 | 11 | 514 | 60 | 9 | |
| 561 | 87 | 13 | 530 | 70 | 11 | |
| 592 | 1 | 0.2 | 568 | 60 | 9 | |
|
| ||||||
| mStrawberry | 488 | 12 | 3 | 488 | 12 | 3 |
| 532 | 56 | 15 | 514 | 31 | 8 | |
| 561 | 81 | 21 | 530 | 54 | 14 | |
| 592 | 45 | 12 | 568 | 94 | 24 | |
|
| ||||||
| LSSmKate2 | 405 | 51 | 2 | 407 | 43 | 2 |
| 440 | 85 | 4 | 458 | 98 | 4.4 | |
| 488 | 71 | 3 | 476 | 90 | 4 | |
|
| ||||||
| mCherry | 488 | 8 | 1 | 488 | 8 | 1 |
| 532 | 40 | 6 | 514 | 21 | 3 | |
| 561 | 64 | 10 | 530 | 37 | 6 | |
| 592 | 93 | 15 | 568 | 72 | 12 | |
|
| ||||||
| mKeima | 405 | 62 | 2 | 407 | 65 | 2 |
| 440 | 100 | 3 | 458 | 94 | 3 | |
| 488 | 31 | 0.9 | 476 | 60 | 2 | |
|
| ||||||
| mRaspberry | 488 | 9 | 1 | 488 | 9 | 1 |
| 532 | 44 | 5 | 514 | 27 | 3 | |
| 561 | 74 | 9 | 530 | 42 | 5 | |
| 592 | 99 | 12 | 568 | 77 | 9 | |
|
| ||||||
| mKate2 | 488 | 8 | 2 | 488 | 8 | 2 |
| 532 | 33 | 8 | 514 | 18 | 4.5 | |
| 561 | 59 | 15 | 530 | 31 | 8 | |
| 592 | 97 | 24 | 568 | 68 | 17 | |
|
| ||||||
| tdKatushka2 | 488 | 4 | 2 | 488 | 4 | 2 |
| 532 | 23 | 11 | 514 | 11 | 6 | |
| 561 | 51 | 25 | 530 | 21 | 11 | |
| 592 | 97 | 48 | 568 | 60 | 30 | |
|
| ||||||
| E2-Crimson | 532 | 50 | 3.5 | 514 | 54 | 4 |
| 561 | 59 | 4 | 530 | 51 | 3.5 | |
| 592 | 90 | 6 | 568 | 68 | 5 | |
| 638 | 19 | 1.3 | 633 | 30 | 2 | |
|
| ||||||
| mNeptune | 488 | 11 | 1.4 | 488 | 11 | 1.4 |
| 532 | 37 | 5 | 514 | 24 | 3 | |
| 561 | 64 | 8 | 530 | 35 | 5 | |
| 592 | 97 | 13 | 568 | 69 | 9 | |
| 638 | 13 | 2 | 633 | 20 | 3 | |
|
| ||||||
| TagRFP657 | 561 | 51 | 1.7 | 530 | 22 | 0.7 |
| 592 | 82 | 3 | 568 | 58 | 2 | |
| 638 | 36 | 1.2 | 633 | 50 | 1.7 | |
Effective brightness is determined as a product of quantum yield, molar extinction coefficient, and efficiency of excitation divided by 100,000.
FPs are usually expressed and visualized in cells. Fluorescence brightness of an FP measured in vitro does not always correspond to its actual brightness observed in live cells (Kremers et al., 2007). The in vivo brightness, beside intrinsic spectral characteristics, is determined by a number of parameters such as expressing cell type, expression efficiency, mRNA and protein stability, efficiency and rate of chromophore maturation, and the fusion protein partner. Therefore, in order to choose the best FP for a certain application in cells, it is recommended to screen several optimal candidates, since it is impossible to predict their behavior theoretically.
For the application of FPs in superresolution microscopy and fluorescent correlation spectoscopy, an important characteristic is the single-molecule brightness, which tends to be higher than that measured for an ensemble of FP molecules (Subach et al., 2009a). The single-molecule brightness is defined as the average fluorescence intensity per light-emitting FP molecule; however, not every FP molecule in the ensemble is fluorescent due to an incomplete formation of the chromophore. Importantly, a two-photon brightness, which corresponds to the two-photon action cross-section, cannot be readily predicted from the common one-photon absorbance spectra (Drobizhev et al., 2009). Measurment of both single-molecule and two-photon brightness is not a trivial task and requires sophisticated equipment.
B. Maturation: Protein Folding and Chromophore Formation
FP maturation includes two consecutive steps: protein folding and chromophore formation, the latter usually being a rate-limiting step. The tertiary structure of all known FPs is highly conserved and organized as a capped β-barrel that serves as a shell to prevent chromophore quenching by solvent molecules (Day and Davidson, 2009). The main peculiarity of GFP-like fluorescent proteins is that the formation of the chromophore responsible for protein fluorescent properties occurs without any cofactors or enzymes but requires molecular oxygen. The chromophore is generated as a result of several consecutive autocatalytic reactions involving internal amino acid residues of the FP. Even though the first RFPs were cloned in 1999, it was not until recently that the actual mechanism of red chromophore formation has been revealed. It was shown that the posttranslational modifications of RFPs are more complicated than those for GFPs and do not always lead to the red chromophore formation (Piatkevich and Verkhusha, 2010).
A characteristic parameter for estimating the rate, at which an FP becomes fluorescent, is maturation half-time, which is the time required for the FP to reach a half of its maximal fluorescence. The maturation half-time can range from minutes to hours (Table I). Rapid maturation of an FP enables detection of promoter activation and single translational events, while the slow-maturated FPs have rather limited quantitative applications.
Maturation kinetic is usually measured for a rapidly purified FP after expression under anaerobic conditions (Merzlyak et al., 2007). Alternatively, maturation can be monitored in live bacteria after induction of FP expression (Kremers et al., 2007). Maturation rates measured for common RFPs by these approaches are presented in Table I. It should also be kept in mind that the maturation rate and efficiency for an FP in vivo depend on oxygen concentration, temperature, expressing cell types, and fusion protein partner. To reduce the negative folding interference in one or both of the fusion proteins, a flexible linker of appropriate length should be used. The Gly-Gly-Ser and Gly-Gly-Thr segments usually provide sufficeint flexibility to the linker (Snapp, 2005).
C. Oligomerization and Cytotoxicity
Oligomerization and cytotoxicity of FPs are among the key deciding issues for their use in cell biology. Depending on protein sequence and cellular environment, FPs can display varying degrees of quatenary structure. To further complicate matters, wild-type Anthozoan FPs may also form nonspecific, high-order aggregates. Both in vitro and in vivo studies involving a specific FP can be compromised by a tendency of that protein to either oligomerize or aggregate, causing mislocalization of target proteins, disruption of their function, interference with signaling cascades, and cell toxicity of aggregates.
Aggregation of RFPs, which usually results in brightly fluorescent dots in cells and high cytotoxicity, may be caused by electrostatic interactions between positively and negatively charged surfaces. The interactions between macromolecules of FPs can be significantly reduced by the substitution of the positively charged amino acid cluster near the N-terminus with negatively charged or neutral residues (Yanushevich et al., 2002). The first seven amino acids of enhanced GFP (MVSKGEE) followed by a spacer sequence NNMA have been successfully employed for the majority of improved RFPs (Campbell et al., 2002; Shaner et al., 2004). In many respects, optimization of N- and C-termini helps to reduce the cytotoxicity of RFPs (Strack et al., 2008).
In contrast to GFPs from Hydrozoa species, which are dimers, virtually all wild-type Anthozoan FPs form stable terameric complexes even in diluted solutions and dissociate only in harsh conditions, which cause irreversible denaturation of polypeptide chains (Vrzheshch et al., 2000). Oligomerization tendency increases the rate constants of the thermal and guanidinium chloride-induced denaturation and extends intracellular life span of FPs (Stepanenko et al., 2004; Verkhusha et al., 2003b). Monomerization of wild-type RFPs by mutagenesis has proven to be a challenging task in the course of their enhancement, since the loss of ability to form tetramers can lead to substantional decrease of fluorescence brightness and protein maturation rates (Campbell et al., 2002; Kredel et al., 2009). Oligomerization tendency of an FP can be quantitively characterized by the dissociation constant; however, the majority of papers discribing FPs lack this information. An acceptable approach for the determination of an FP oligomeric state in cells would be to express its fusion with α-tubulin or β-actin to check whether cytoskeletal structures form correctly (Rizzo et al., 2009). However, even FPs performing well in actin and tubulin fusions may form oligomers under other physiological conditions due to their high local concentration. High local concentration can be reached by extreme overexpression of certain FP fusions and is manifested by background fluorescence, aggregate formation, distortion of cellular organelles, misslocalization of targeted protein, and false-positive FRET signals (Rizzo et al., 2009; Zacharias et al., 2002).
For fusion proteins, the FP must be truly monomeric to minimize the interference with the normal function and localization of targeted protein. Nevertheless, tetrameric and dimeric FPs are still suitable for labeling of luminal spaces of organelles and whole cells. Oligomeric FPs can be also used to control the expression level of a protein of interest by means of translation from the same mRNA controled by an internal ribosome entry sequence (Kamio et al., 2010). Another approach for creating “pseudo”-monomers involves covalent “head-to-tail” cross-linking of two identical FP molecules that would result in an intramolecular or “tandem” dimer, which usually possesses identical spectral characteristics as the original proteins and performs essentially as a monomer although at twice as bigger molecular weight and size. This technique was successfully applied to dimeric variants of DsRed (Campbell et al., 2002; Shaner et al., 2004) and to Katushka2 (Shcherbo et al., 2009a).
D. Photostability and Photoactivation
Similarly to low-molecular-weight fluorescent dyes, all FPs undergo photobleaching upon extended irradiation with excitation light. In flow cytometry analyzers and FACS instruments, however, photobleaching of FPs at the interrogation point is negligible due to the short duration of laser illumination. Thus, photostability and phototoxicity of FPs are not crucial for their usage in flow cytometry. For example, cells expressing JRed (Shagin et al., 2004) or KillerRed (Bulina et al., 2006), which are genetically encoded photosensitizers, can be applied to flow cytometers without any light-induced cell killing. This feature of flow cytometry instruments, however, limits FACS applications of PA-FPs by their insufficient photoactivation. Although “soft” in terms of photoconversion PA-FPs, such as PAmCherry (Subach et al., 2009a), can be photoactivated using LED arrays in cultured cells prior to FACS. Fortunately, the gap of PA-FPs' limited use in flow cytometry can be filled by recently developed monomeric FTs, which change their spectral properties simply with time (Subach et al., 2009b; Tsuboi et al., 2010).
Photostability of FPs can be important if postsort analysis by fluorescent microscopy is required. A comparison of bleaching half-times revealed that the DsRed, TagRFP-T, and mOrange2 proteins are the most photostable among the RFPs (Shaner et al., 2008). When choosing an FP for a particular experiment, it should be kept in mind that protein photostability strongly depends on the conditions of the protein biosynthesis and photobleaching (Bogdanov et al., 2009).
E. pH Stability of Fluorescence
The FP β-barrel is stable in a wide range of pH, and so the rapid denaturation and chromophore degradation are observed at pH values lower than 2 and above 12. Oligomerization tends to increase the overall pH stability of FPs (Vrzheshch et al., 2000). Nevertheless, the spectroscopic properties of FPs can be affected in the physiological range of pH. The pH value, at which the fluorescence of an FP equals to half of its maximum, is designated as pKa and is employed for a pH-stability comparison. The majority of RFPs developed to date has an apparent pKa value ranging from 4.0 to 6.5 (Table I). On one hand, high pH stability is advantageous when using FPs in the Golgi, endosomes, lysosomes, secretory granules, and other acidic organelles, as well as for performing quantitative imaging. On the other hand, ratiometric pH-dependence of the FP spectral properties can be efficiently applied for monitoring pH changes in living cells (Hanson et al., 2002).
F. Optimization of Nucleotide and Amino Acid Sequences
Jellyfish and corals, the original source of majority of FPs, differ from mammals by the DNA codon usage. Codon optimization may significantly increase the fluorescence signal of an FP by improving its expression in mammalian cells (Zolotukhin et al., 1996). Usually, commercially available FPs incorporate mammalian codon usage. However, humanized versions of FPs are not necessarily suitable for expression in other model organisms. For instance, the expression of mRFPmars protein, which was optimized for use in Dictyostelium cells, failed in mammalian cells (Fischer et al., 2006).
The secondary structure of mRNA and its stability can have a great impact on the expression level of an FP in cells too. Disruption of a predicted stem-loop involved in the ribosomal binding site in mRNA may account for stronger bacterial expression of some FPs (Strack et al., 2009a). Available software for codon usage analysis (EXPASY) and mRNA structure prediction (Zuker, 2003) can be used for the optimization of FP expression in certain cell types or model organisms.
The analysis of the amino acid sequence of an FP, particularly the amino acid residues external to the protein fold and the amino acid content of the N- and C-termini, can help to prevent FP fusion mislocalization. External cystein resiudes and N-glycosylation sites induce an incorrect folding and mislocalization of FP fusions due to their oligomerization in endoplasmic reticulum (Jain et al., 2001). Sometimes an FP can contain short localization sequences that disturb the original localization of a targeted protein (Kredel et al., 2009). Undesirable FP fusion behavior can be eliminated by a substitution of all external cysteins and glycosilation sites and by truncation of targeting domains.
III. Modern Advanced Red-Shifted FPs
The first-generation monomeric RFPs, such as mFruits (Shaner et al., 2004; Wang et al., 2004), mKO (Karasawa et al., 2004), TagRFP (Merzlyak et al., 2007), and mKate (Shcherbo et al., 2007), can be successfully used as markers for protein localization, dynamics, and interactions. Unfortunately, limited brightness and low photostability of these proteins hampered their applications. That is why, recently, a whole series of FPs with improved brightness and photostability has been developed on the basis of these proteins. The palette of enhanced conventional RFPs has been additionally extended by a number of FTs and RFP variants with a LSS of more than 140 nm. The first far-red FP, which can be efficiently excited by the standard 633 and 638 nm laser lines, has been also created.
All RFPs can be divided into three groups according to the fluorescence emission maximum: orange (with emission maximum from 550 to 590 nm), red (with emission maximum from 590 to 630 nm), and far-red (with emission maximum more than 630 nm) (see Table I and Fig. 2).
Fig. 2.
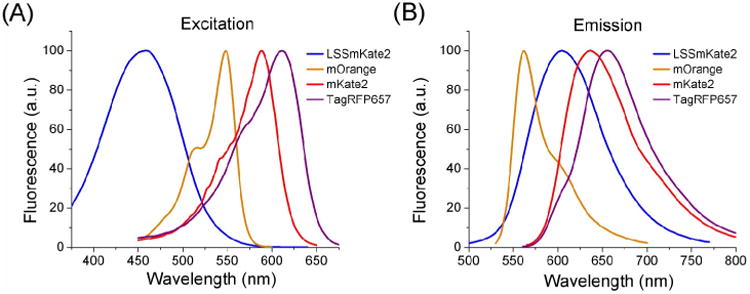
The excitation (A) and emission (B) spectral profiles of the LSS red (LSSmKate2), orange (mOrange), red (mKate2), and far-red (TagRFP657) FPs are shown. (For interpretation of the references to color in this figure legend, the reader is referred to the Web version of this chapter.)
A. Orange Fluorescent Proteins
Recently, several potentially useful orange fluorescent proteins (OFPs) have been derived from various Anthozoan FPs. The brightest monomeric OFP available to date is mKOκ (mKusabira Orange kappa), which was derived from mKO (Karasawa et al., 2004), by introducing seven mutations (Tsutsui et al., 2008). The mKOκ protein is characterized by improved pH stability and maturation rate relative to mKO precursor. Photostability of mKOκ under arc lamp illumination is about threefold lower than that for popular mCherry, but both perform similarly under laser illumination. mKOκ has been used for stably expressing cell lines that can indicate its low cytotoxicity (Sakaue-Sawano et al., 2008). Moreover, mKOκ was successfully used as a FRET acceptor (Tsutsui et al., 2008). Finally, poor localization of some mKO fusions could be treated by its replacement with enhanced mKOκ (Rizzo et al., 2009).
The eqFP578 protein turned out to be a rather prospective precursor for a series of monomeric RFPs. Extensive mutagenesis of eqFP578 resulted in a bright monomeric FP, named TagRFP (Merzlyak et al., 2007). In addition to high brightness and fast maturation, TagRFP possesses good pH stability and performs well as a fusion partner for a variety of proteins in different cell types. The main disadvantage of TagRFP is its low photostability under arc lamp and laser illumination.
Tsien and coworkers succeeded in improving the photostability of TagRFP and mOrange significantly (Shaner et al., 2008). Selection of the brightest bacterial colonies, expressing TagRFP and mOrange mutants, under long-term irradiation by intense green-yellow light allowed for the isolation of photostable clones. The resulting FPs, named TagRFP-T and mOrange2, are 9-fold and 25-fold more photostable than the precursors, respectively. mOrange2, however, possesses the reduced brightness and substantially increased maturation time. Photostability of mOrange2 appeared to be almost insensitive to oxygen. In the case of TagRFP-T, photosensitivity to oxygen remained unchanged. Both TagRFP-T and mOrange2 preserve the monomeric state and perform well as tags for cellular proteins. Unfortunately, there is no literature-supported data on the cytotoxicity of these proteins in mammalian cells.
In addition, enhanced tetrameric versions of DsRed, termed DsRed-Express2 (Strack et al., 2008), and E2-Orange (Strack et al., 2009a) have been developed. These FPs yield minimum cytotoxicity and high maturation rates, which makes them more attractive for expression in transgenic animals and stable cell lines as reporter markers for whole cell labeling or for monitoring gene activity. The cytotoxicity of DsRed-Express2 and E2-Orange with respect to mammalian cells is comparable to that of common enhanced GFP. Their photostabilities are comparable to those of many improved RFPs. The tetrameric state of the proteins, however, prevents them from being used in fusion proteins. Another drawback of these proteins is the existence of green species in the absorbance spectra that may limit their applications for multicolor microscopy. Nonetheless, the usage of DsRed-Express2 and E2-Orange simultaneously with EGFP in flow cytometry has been demonstrated (Strack et al., 2008, 2009a).
The tdTomato protein, which is the tandem dimer orange FP, still holds the position of one of the brightest red-shifted FPs yet developed (Shaner et al., 2004). Besides, it is characterized by high photostability and good maturation rate. While tdTomato can be successfully used for whole-cell and organelle labeling, the large size of the tandem unit may disrupt the function of the target protein.
B. Red Fluorescent Proteins
Continued and intensive optimization of the most red-shifted wild-type RFP, called eqFP611, yielded a bright monomeric mRuby protein (Kredel et al., 2009). Good performance in most fusions and resistance to acidic environments make mRuby potentially useful for many cell biology applications. mRuby turned out to be an effective marker for the visualization of peroxisomes and endoplasmic reticulum in mammalian cells. Another advantage of mRuby is a good separation between excitation and emission spectra (Stokes shift is 47 nm), allowing for better detection of its fluorescence by flow cytometry analyzers and FACS instruments. There are no, however, data regarding mRuby cytotoxicity, and its photostability values in literature are contradictory. The main mRuby runner-ups, mCherry and mStrawberry, have superior maturation rates and exhibit good brightness in mammalian cells. The red-shifted fluorescence spectrum of mRaspberry may allow its good spectral separation with OFPs (Wang et al., 2004).
Recently, a variety of OFPs and RFPs that can be efficiently excited by blue or cyan light have been developed on the basis of conventional FPs (Kogure et al., 2006; Piatkevich et al., 2010b, 2010c). The OFPs and RFPs with an LSS (more than 140 nm) are particularly promising as additional orange and red colors for multiparameter flow cytometry. LSS-RFPs have an absorption maximum at about 440–460 nm, which is ideal for excitation with blue lasers (Table II). The first LSS-RFP, named mKeima, has been already applied to multicolor two-photon microscopy and fluorescence cross-correlation spectroscopy (Kogure et al., 2006). Low brightness and strong pH-dependence of the fluorescence limit its applications though. The presence in Keima samples species with conventional red fluorescence (having the excitation peak at 584 nm) hinders multicolor imaging of common RFPs simultaneously with mKeima (Piatkevich et al., 2010b).
A newly developed LSSmKate2, which was derived from far-red protein mKate, is brighter than mKeima and demonstrates almost pH-independent behavior of the spectral properties in the physiological conditions (Piatkevich et al., 2010b). Its apparent pKa is 2.7, making LSSmKate2 the most pH-stable among all RFPs reported to date. The several types of mammalian cells stably expressing LSSmKate2 either in cytosol or targeted to the nucleus had normal in vitro and in vivo proliferation rates and constant expression level of FPs, indicating low cytotoxicity.
The rare examples of RFPs isolated from Hydrozoa species are JRed (Shagin et al., 2004) and KillerRed (Bulina et al., 2006). These RFPs are the only known genetically encoded intracellular photosensitizers of reactive oxygen species. In addition, recent attempts to develop an RFP on the basis of a commonly used GFP from A. victoria (class Hydrozoa) have finally resulted in the first green-red FP, called R10-3, which has been successfully used in flow cytometry as an additional color (Mishin et al., 2008).
C. Far-Red Fluorescent Proteins
The growing number of researchers is showing interest in far-red FPs due to their superiority over other RFPs for tissue and whole-body imaging, which can make them attractive for application in the biomedical research (Shcherbo et al., 2007, 2009a). Far-red FPs can be simultaneously used for multicolor microscopy and flow cytometry of living cells in conjugation with OFPs and RFPs (Morozova et al., 2010). Monomeric far-red FPs are the proteins of choice for tagging cellular proteins even in strongly autofluorescence conditions. In addition, infrared FPs, obtained on the basis of phytochrome family of proteins, will compete in whole-body and deep-tissue imaging with far-red FPs of the GFP-like family in near future (Shu et al., 2009).
Several far-red FPs have been derived from the wild-type eqFP578 protein. Random mutagenesis of eqFP578 gene yielded a dimeric far-red FP, named Katushka (Shcherbo et al., 2007). A monomeric version of Katushka, called mKate, exhibits high pH sensitivity of fluorescence in the physiological range and a weak photoactivation that complicates quantitative analysis. Subsequent random mutagenesis of mKate has enhanced its brightness, photostability, and pH stability. The improved version, known as mKate2, features rapid maturation with half-time less than 20 min, but it exhibits residual green fluorescence (Shcherbo et al., 2009a). A transgenic expression of mKate2 in Xenopus embryos demonstrated reduced cytotoxicity even at high expression levels. Nevertheless, cytotoxicity assay in transiently transfected HeLa cells revealed a noticeable loss of high expression of mKate and Katushka in 24 h after transfection (Strack et al., 2008). Cytotoxicity of mKate and Katushka has been additionally supported by a bacterial expression assay (Strack et al., 2008).
On the basis of mKate, Lin et al. (2009) succeeded in engineering the bright far-red protein, named mNeptune, achieving the emission maximum of 649 nm. The red-shifted excitation and emission spectra of mNeptune make it preferable for multicolor imaging with OFPs in live cells. Relative to its parental protein, however, mNeptune was shown to have a tendency to form weak dimers, an increased cytotoxicity in bacterial cells, and residual green fluorescence (Morozova et al., 2010).
Another far-red protein, named E2-Crimson, has been derived from DsRed– Express2 (Strack et al., 2009b). E2-Crimson forms a tetramer and features an excitation peak at 605 nm and an emission peak at 646 nm. E2-Crimson possesses fast maturation and high pH stability. Because of its tetrameric state, E2-Crimson should be used to label whole cells or luminal spaces of organelles. The analysis of HeLa cells transiently transfected with E2-Crimson showed a constant level of protein expression through the 120 h after transfection that indicates its low cytotoxicity (Strack et al., 2009b).
Despite the great effort in the development of far-red FPs, none of them has achieved sufficient excitation using a 633 nm HeNe laser. Only recently, the first monomeric far-red FPs, called TagRFP657, with absorbance and emission maxima at 611 and 657 nm, respectively, have been developed (Morozova et al., 2010). The red-shifted absorbance allows for the excitation of TagRFP657 by the standard 633-640 nm red lasers used in flow cytometry analyzers and FACS instruments. Moreover, TagRFP657 was shown to be an efficient protein tag for the superresolution fluorescence imaging using a stimulated emission depletion microscope, as well as for multicolor wide-field microscopy with OFPs. The good pH stability and photostability coupled with low cytotoxicity make TagRFP657 the far-red probe of choice for multicolor labeling.
IV. Simultaneous Detection of Multiple FPs
One of the main prospects presented by the recent development of the spectrally distinct FPs is multicolor flow cytometry. To a large extent, the instrument configuration and available lasers determine the number of FPs that can be detected simultaneously. However, even with a limited number of available lasers and detectors, there can still be a wide range of possible FP combinations. Despite the possible number of simultaneously used FPs, one should consider two basic rules when selecting fluorescent probes for multicolor flow cytometry. Selected fluorophores should possess high brightness and have minimal emission overlap. We have already defined the brightness for FPs above. In this section, we give general recommendations for drafting FP combinations for multicolor flow cytometry.
At present, there is a vast range of GFP-like FPs with colors spanning the whole visible spectrum of emission wavelengths, peaking from 424 to 670 nm. Based on the value of the emission maximum, all FPs can be divided into the following groups: blue FPs (emission peaking at 420–460 nm), cyan FPs (emission peaking at 470–500 nm), green FPs (emission peaking at 500–520 nm), yellow FPs (emission peaking at 520–540 nm), orange FPs (emission peaking at 550–590 nm), red FPs (emission peaking at 590–630 nm), and far-red FPs (emission peaking at 630–650 nm).
The blue, cyan, green, and yellow FPs have been recently described in detail in a number of reviews (Chudakov et al., 2010; Day and Davidson, 2009). Here we only mention the most efficient for flow cytometry FPs from each spectral region. These include blue FPs: Azurite, EBFP2, and TagBFP; cyan FPs: ECFP, Cerulean, mTurquoise, and mTFP1; green FPs: T-Sapphire, EGFP, spGFP, Emerald, and TagGFP2; and yellow FPs: mAmetrine, EYFP, Venus, Citrine, and YPet (Chudakov et al., 2010; Day and Davidson, 2009).
The appropriate optical filter configuration and real-time electronics or postanalysis software-based compensation provide the ability to distinguish between large numbers of different fluorophores with partially overlapping spectra (Hawley et al., 2004). We list a number of possible combinations of FPs with respect to their spectral properties and laser availability often seen in currently existing flow cytometry analyzers and FACS sorters (Table III). Nonetheless, the emission of FPs from the neighboring cells across Table II generally exhibit noticeable spectral overlap. It should be pointed out that a cross talk between emissions occurs toward the red edge of the spectrum (Fig. 2B). Moreover, by increasing the number of detected colors, the experiment also gains an additional complexity. Simultaneous detection of several FPs at the single cell level requires extra circumspection. Several flow cytometry approaches have been reported to detect RFPs with up to three GFP variants using single- or dual-laser excitation (Hawley et al., 2001, 2004; Kamio et al., 2010). The strategies utilizing the multicolor flow cytometry with fluorescent dyes can be also applied for FPs. The lack of yellow and orange lasers on some flow cytometers can be compensated by RFPs with increased Stokes shift, which are useful for combinations with conventional FPs. For instance, TagBFP, T-Sapphire, and LSSmKate2 can be excited with 405–407 nm light, but emit in different spectral ranges: blue, green, and red, respectively. The 458 nm laser can also be used for the simultaneous excitation of LSSmKate2 with ECFP and EYFP.
Table III. Compatibility of various FPs in multiparameter flow cytometry.
| Laser line (nm) | Blue | Cyan | Green | Yellow | Orange | Red | Far-red |
|---|---|---|---|---|---|---|---|
| 350–356 | Azurite | T-Sapphire | mAmetrine | ||||
| EBFP2 | |||||||
| TagBFP | |||||||
|
| |||||||
| 405, 407 | Azurite | ECFP | T-Sapphire | mAmetrine | LSS-mOrange | LSS-mKate1 | |
| EBFP2 | Cerulean | LSS-mKate2 | |||||
| TagBFP | mTurquoise | mKeima | |||||
|
| |||||||
| 440, 458 | ECFP | EGFP | LSS-mOrange | LSS-mKate1 | |||
| Cerulean | spGFP | LSS-mKate2 | |||||
| mTurquoise | Emerald | mKeima | |||||
| TagGFP2 | |||||||
|
| |||||||
| 488 | EGFP | EYFP | |||||
| spGFP | Venus | ||||||
| Emerald | Citrine | ||||||
| TagGFP2 | YPet | ||||||
|
| |||||||
| 514 | EYFP | mKO | |||||
| Venus | mOrange | ||||||
| Citrine | mKOk | ||||||
| YPet | mOrange2 | ||||||
| dTomato | |||||||
|
| |||||||
| 530, 532 | mKO | mStrawberry | |||||
| mOrange | |||||||
| mKOk | |||||||
| mOrange2 | |||||||
| dTomato | |||||||
| TagRFP | |||||||
| TagRFP-T | |||||||
|
| |||||||
| 561 | mKO | mStrawberry | mKate | ||||
| mOrange | mCherry | mKate2 | |||||
| mKOk | mRaspberry | Katushka | |||||
| mOrange2 | mNeptune | ||||||
| dTomato | |||||||
| TagRFP | |||||||
| TagRFP-T | |||||||
|
| |||||||
| 568 | dTomato | mStrawberry | mKate | ||||
| TagRFP | mCherry | mKate2 | |||||
| TagRFP-T | mRaspberry | Katushka | |||||
| E2-Crimson | |||||||
| mNeptune | |||||||
|
| |||||||
| 592 | mStrawberry | mKate | |||||
| mCherry | mKate2 | ||||||
| mRaspberry | Katushka | ||||||
| E2-Crimson | |||||||
| mNeptune | |||||||
| TagRFP657 | |||||||
|
| |||||||
| 633, 638 | TagRFP657 | ||||||
| E2-Crimson | |||||||
The appropriate choice of FPs with minimal emission overlap and the selection of filter sets that detect the fluorescence from one fluorophore can minimize the need for compensation, making the flow cytometry analysis more accurate. A forward estimate of spectral spillover and optimal filters can be theoretically made by overlaying spectral profiles of FPs. There are a number of web resources presenting valuable information on the spectral properties of FPs, which might be useful for designing multicolor flow cytometry experiments (Table IV).
Table IV. Internet resources providing description and characteristics of FPs.
| Resource | Web page | Comments |
|---|---|---|
| Clontech Laboratories | http://www.clontech.com/clontech/gfp/index.shtml | General description of FPs |
| Olympus | http://www.olympusconfocal.com/applications/fpcolorpalette.html | Reviews of FPs |
| Evrogen | http://www.evrogen.com | Detailed information on many FPs |
| MBL International | http://www.mblintl.com | General description of FPs |
| Albert Einstein College of Medicine | http://www.einstein.yu.edu/facs/ | Recommended for flow cytometry FPs |
| Florida State University | http://micro.magnet.fsu.edu | List of useful links |
| MicroscopyU | http://www.microscopyu.com | Interactive applications for selecting filter sets |
V. Fluorescent Timers
Multiparameter flow cytometry can be also performed using only one FP that changes its spectral properties with time. The FPs changing their spectral properties during maturation in a time-dependent manner are known as FTs. Usually, at an early stage of maturation, FTs fluoresces in one spectral region, and after complete maturation, they exhibit a red-shifted fluorescence. The predictable time course of changing fluorescent colors allows for a quantitative analysis of temporal and spatial molecular events, based on the ratio between fluorescence intensities of two forms. Therefore, FTs yield temporal and spatial information regarding protein translation and target promoter activity. Moreover, recently developed new subclass of monomeric FTs enables tracking of protein dynamics and determination of half-life of the tagged proteins.
The first reported FT was tetrameric DsRed-Timer (Terskikh et al., 2000). Its color transition from green to red was shown to be due to superefficient FRET between green and red units in the tetramer (Verkhusha et al., 2004). DsRed-Timer has been utilized for monitoring the dynamics of gene expression in various tissues, for separating cells with different gene activity patterns, and for studying intracellular trafficking and organelle aging (Chudakov et al., 2010).
Recently, the first monomeric FTs, which exhibit distinctive fast, medium, and slow blue-to-red chromophore maturation rates, have been developed (Table V) (Subach et al., 2009b). During the maturation of these monomeric FTs, the fluorescence of the blue forms increases to its maximum value, and after that decreases to zero (Fig. 3). The fluorescence of the red forms increases with time with some delay and then reaches a plateau. Maturation of both fluorescent forms is temperature sensitive; however, monomeric FTs exhibit a similar timing behavior in bacteria, insect, and mammalian cells. The maturation times increase at lower temperatures like 16 °C and 25 °C and decrease at higher temperatures like 45 °C (Table V). The higher the temperature, the faster is the growth of the red-to-blue ratio. This observation provided a unique interpretation for the age of the particular FT. The data suggest that calibration curves based on the FT red-to-blue ratio can be used to determine the time from the start of FT production under any specific conditions. In microscopy, the quantitative analysis can be affected by a blue-to-red photoactivation of FTs under prolonged or intense illumination with violet light. However, in flow cytometry, FTs do not show any noticeable photoconversion (Subach et al., 2009b).
Table V. Spectroscopic and biochemical properties of monomeric fluorescent timers.
| Protein | Exmax (nm) | Emmax (nm) | ε (M−1 cm−1) | QY | pKa | Characteristic time (h) | Optimal excitation laser (nm) |
|---|---|---|---|---|---|---|---|
| Fast-FT | 403 | 466 | 49,700 | 0.30 | 2.8 | 0.25 | 405, 407 |
| 583 | 606 | 75,300 | 0.09 | 4.1 | 7.1 | 532, 561, 592 | |
| Medium-FT | 401 | 464 | 44,800 | 0.41 | 2.7 | 1.2 | 405, 407 |
| 579 | 600 | 73,100 | 0.08 | 4.7 | 3.9 | 532, 561, 592 | |
| Slow-FT | 402 | 465 | 33,400 | 0.35 | 2.6 | 9.8 | 405, 407 |
| 583 | 604 | 84,200 | 0.05 | 4.6 | 28 | 532, 561, 592 | |
| mK-GO | 500 | 509 | 35,900 | ND | 6.0 | 10 | 458, 488 |
| 548 | 561 | 42,000 | ND | 4.8 | ND | 514, 532 |
Exmax, excitation maximum; Emmax, emission maximum; ε, molar extinction coefficient; QY, quantum yield; pKa, pH value, at which protein retain half of its fluorescent intensity. ND, not determined.
Fig. 3.
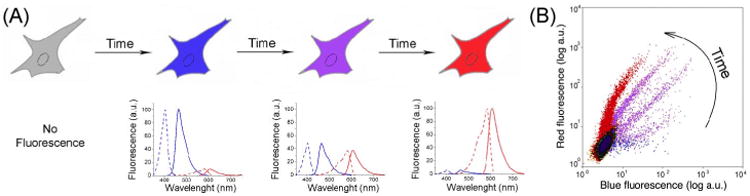
(A) A cell expressing a fluorescent timer gradually changes fluorescence from blue to red with time. The respective time changes of the excitation and emission spectra for the blue and red forms of the fluorescent timer are shown. (B) A flow cytometry plot shows the same population of cells, which expresses the blue-to-red fluorescent timer, analyzed at different times after its expression. (For interpretation of the references to color in this figure legend, the reader is referred to the Web version of this chapter.)
High pH stability of blue and red forms makes it possible to use FTs in a wide range of pH values. The blue and red forms of FTs are bright enough to use them either alone, in protein fusions, or together with green FPs for multicolor imaging. Availability of three monomeric FTs with distinctive blue-to-red maturation times is useful for studies of intracellular processes with different timescales.
Recently, by introducing six mutations into mKO, Tsuboi et al. (2010) generated another monomeric FT, named Kusabira Green-Orange, or mK-GO, that changes fluorescence from green to orange over time (Table V). Absorption of mK-GO is slightly pH sensitive, with the apparent pKa values at 6.0 and 4.8 for the green and orange forms, respectively. The ratio of orange per green fluorescence, determined by in vitro translation, was linearly increased and reached a plateau at approximately 10 h. It is reasonable to expect that the maturation rate is temperature dependent. Monomeric behavior of mK-GO enables its utilization in fusions with the targeting proteins.
The color transition for monomeric FTs is thought to be due to a conversion of one fluorescent species into another. It was discovered that a blue-emitting form of FTs contains the TagBFP-like chromophore, which is converted after autooxidation by molecular oxygen to a red-emitting DsRed-like chromophore (Pletnev et al., 2010; Subach et al., 2010).
Interestingly, color transition of living cell can also be due to regulation of gene expression. For example, spatial and temporal patterns of cell-cycle dynamics can be visualized with a Fucci approach (fluorescent, ubiquitination-based cell cycle indicator) reported by Sakaue-Sawano et al. (2008). Fucci is composed of mKO2-hCdt1 (30/120) and mAG-hGem (1/110) fusion proteins that make the expressing cells being yellow at a start of replication, then switch to green during S phase, and to orange during G1 phase. This approach allows for the analysis and sorting of Fucci-expressing cells using single laser excitation at 488 nm.
VI. FRET-Based Genetically Encoded Biosensors
FPs have been successfully employed in engineering genetically encoded biosensors. FP-based biosensors mediate the monitoring and detection of different intracellular events while preserving spatial and temporal resolution. The genetically encoded biosensors possess a unique advantage of being able to be fused to a certain protein or organelle within a cell, facilitating a noninvasive assay of a specific protein activity or cellular signal. The expansion of the FP palette with newly developed RFPs gives unprecedented opportunities to design biosensors with spectrally distinct properties. Moreover, RFPs may serve as templates for engineering biosensors fundamentally different from what already exists with GFP variants.
Detection and quantification of a FRET signal by flow cytometry provides sensitive measurements of protein–protein interactions or protease activity in live cells. The FACS-based FRET can be efficiently applied for cell-based protein library screening and directed evolution of FP biosensors. Upon FRET, a decrease in the donor fluorescence intensity and an increase in the acceptor fluorescence intensity are observed, from either of which the experimental FRET efficiency can be calculated (Domingo et al., 2007). Based on this phenomenon, the FRET positive events can be easily detected with flow cytometry. Cells expressing a donor and an acceptor either in combination (for negative control) or as a fusion protein (for positive control) should be used for establishing an assay to measure FRET signals. The optical configuration of the instruments for FRET measurements should allow for an efficient excitation of both donor and acceptor by two different lasers and for collection of the donor, acceptor, and FRET signals (Chan et al., 2001). Alternatively, the fluorescence of the donor and acceptor upon excitation by a single laser can be measured simultaneously, and the efficiency of the transfer can be judged from the ratio of fluorescence intensities at two wavelengths, corresponding to the emission of the donor and the acceptor or by donor quenching (He et al., 2003a). This strategy directly analyzes the efficiency of FRET pairs for screening of cell-based libraries using flow cytometry.
A. Conventional FRET Pairs
For a long time, EYFP was the most red-shifted monomeric FP available, while mainly the ECFP–EYFP pair has been extensively used in cell biology. It has been shown that flow cytometry can be effectively used to detect the FRET from ECFP to EYFP (Banning et al., 2010; Chan et al., 2001; He et al., 2003a; Siegel et al., 2000). The ECFP–EYFP pair was applied for detection of protein–protein interactions and for monitoring caspase activity in live yeast and mammalian cells by flow cytometry (Banning et al., 2010; Dye et al., 2005; He et al., 2003b; van Wageningen et al., 2006). Enhanced cyan and yellow FPs, such as CyPet and YPet proteins, overcome performance of the ECFP–EYFP pair in FACS analysis by means of a better signal-to-noise ratio and an improved dynamic range (Nguyen and Daugherty 2005; You et al., 2006), possibly caused by their weak dimerizing tendency. However, the considerable spectral overlap between cyan and yellow FPs makes FRET measurements difficult for the purpose of screening molecular libraries with few positive hits. Thus, development of new FRET pairs is highly desirable. One of the options is to utilize the recently created RFPs as acceptors or even donors. For instance, a combination of GFP and RFP compared to the ECFP–EYFP pair has advantages for flow cytometry analysis due to the minimal emission overlap and superior brightness of GFPs versus ECFP. In addition, orange FPs can be efficient FRET donors for far-red FPs.
Engineering of reliable and efficient FRET pairs requires FPs that combine such properties as true monomeric behavior, high pH stability and photostability, fast maturation, and bright fluorescence. Moreover, in order to achieve a high dynamic range (the donor/acceptor emission ratio change), which is one of most important characteristics of FRET sensors, the donor and the acceptor should ideally have minimal cross talks.
Since FRET is highly distance-sensitive, any oligomerization tendency of the donor and acceptor FP molecules can lead to nonspecific FRET, even if they are expressed in their free, untagged form (Nguyen and Daugherty, 2005). For example, the ECFP–HcRed pair tested for the detection of proteins interacting in the endoplasmic reticulum demonstrated a sufficient FRET signal in FACS screening. However, a high level of nonspecific FRET, which could be attributed to the strong oligomerization of HcRed, noticeably hindered FRET measurements (Johansson et al., 2007). Slowly maturating FPs may demonstrate insufficient or completely abrogated chromophore formation during folding of the biosensor, due to an unpredictable interference with the rest of the biosensor molecule. It can result in a strong variation of measured FRET efficiency (Goedhart et al., 2007). Low pH stability limits the application of FRET pairs in acidic organelles. Sometimes, the postsorting analysis is required to detect FRET in collected cells using fluorescence microscopy. In this case, highly photostable FPs are the proteins of choice for accurate FRET efficiency measurements.
B. Novel Advanced FRET Pairs
A high FRET efficiency has been achieved for the combination of GFPs and recently developed monomeric RFPs. The high extinction coefficient of TagRFP and mCherry makes them attractive FRET acceptors for the GFPs (Shcherbo et al., 2009b; Tramier et al., 2006). Shcherbo et al. generated a bright, high contrast apoptosis reporter, named CaspeR3 (Caspase-3 Reporter), constructed from TagRFP and TagGFP. Both FPs exhibited profound maturation in CasreR3. A combination of LSS green FPs, such as T-Sapphire, with orange or red FPs may be a promising FRET pair due to almost complete separation of fluorescence profiles that simplifies intensity-based FRET experiments (Bayle et al., 2008; Zapata-Hommer and Griesbeck, 2003).
Yellow FPs, which are red-shifted compared to GFP, can achieve a greater spectral overlap with RFPs and still preserve the separation of donor and acceptor fluorescence. Several bright yellow FPs, namely mCitrine, SYFP2, Venus, and LSS mAmetrine, have quantum yields exceeding 0.58 (Ai et al., 2008; Griesbeck et al., 2001; Kremers et al., 2006; Nagai et al., 2002) and are very promising as fluorescent donors for RFPs. The mCitrine and mKate2 proteins can be excited independently and exhibit a limited cross talk. This pair of yellow and far-red FPs has been employed for the construction of a voltage-sensitive biosensor (Mutoh et al., 2009). The fusion of SYFP2 as a donor and mStrawberry or mCherry as an acceptor can be used for protein–protein interaction studies (Goedhart et al., 2007).
Anthozoan cyan and orange FPs exhibit a close spectral overlap of the emission and absorption spectra, respectively. Their improved versions have been utilized as efficient FRET pairs. For example, the MiCy–mKO pair has a high ratio change (14-fold) and was used to monitor the activity of caspase-3 during apoptosis (Karasawa et al., 2004). Another pair, mUKG–mKOk, was optimized for membrane voltage measurements (Tsutsui et al., 2008). Both pairs exhibited reduced cross-excitation and pH sensitivity. All proteins are quite bright and should be easily detected in flow cytometry analysis. However, the performance of the MiCy–mKO pair can be limited by the MiCy dimerization tendency and the slow maturation of mKO. The problem reported for mUKG–mKOk, in turns, is its weak tendency to form fluorescent aggregates (Mutoh et al., 2009). The enhanced versions of mKO, named mKO2, can be also used as a FRET acceptor in conjugation with cyan FPs (Sakaue-Sawano et al., 2008). Moreover, the mKO protein was used as a donor to the mCherry acceptor for quantitative FRET in live cells (Goedhart et al., 2007). However, a significant overlap of orange fluorescence of the donor with red fluorescence of the acceptor can disable FRET detection by flow cytometry.
C. FRET Biosensors in Multicolor Flow Cytometry
Using a FRET-biosensor in combination with a second biosensor makes it possible to monitor and detect multiple biochemical parameters in a single cell. To make the multiparameter analysis effective, the FRET pairs used simultaneously should fulfill certain criteria. Each FRET pair or additional fluorophore should be excited at a wavelength at which the other FRET pair or fluorophore is not excited or excited insignificantly. Another possibility is to collect emission from each FRET pair at a wavelength where another FRET pair does not emit fluorescence. The engineering of FRET pair combinations that meet these demands became possible only with the introduction of RFPs.
In some cases, a multiparameter analysis is possible by means of adding a monomeric RFP to the ECFP–EYFP pair. Depending on experimental conditions, the measurement of FRET signals within a system of three donor–acceptor pairs, such as ECFP–EYFP, ECFP–mRFP, and EYFP–mRFP, can be performed (Galperin et al., 2004). Additionally, in trimeric complexes, the two-step FRET can be achieved: from ECFP to EYFP and, subsequently, from EYFP to mRFP. The “linked” FRET can be accurately separated from individual steps by using a flow cytometer with the six-color three-laser system, which measures distinct signals from FPs and from four possible FRET signals (He et al., 2005). He et al. also described the optical configuration for FRET measurements in details. The linked FRET was used to study the homotrimerization of TRAF2 protein in live cells. This method can be utilized for studying an interaction between three specific proteins. Also, the sequential fusing of ECFP, EYFP, and mRFP using the caspase-3 and caspase-6 recognition motifs yielded a dual parameter FRET sensor (Wu et al., 2006). Flow cytometry facilitated a simultaneous monitoring of the activity of two caspases in apoptotic cells, using the 405 and 488 nm lasers to excite ECFP and EYFP, respectively.
Two spectrally distinct FRET pairs may also enable multiparameter flow cytometry. The cyan-fluorescing mTFP1 and yellow-fluorescing mAmetrine, which possess distinct excitation spectra, were used as donors for yellow FP and bright RFP, named tdTomato, as acceptors (Ai et al., 2008). The mOrange–mCherry and ECFP–EYFP can be excited separately enabling a multiparameter detection. However, the performance of the mOrange–mCherry pair is limited by a strong spectral overlap and a poor-sensitized emission of mCherry (Piljic and Schultz, 2008).
D. Optimizing Biosensors for High-Throughput Screening
Utilization of FP-based sensors in combination with high-throughput techniques has a tremendous potential in basic science research as well as in large-scale approaches for the screening of novel pharmaceuticals or the development of therapeutic strategies. For a sustainable flow cytometry analysis, the FRET-based biosensor should exhibit a reproducible signal and have a wide dynamic range (the difference between maximal and minimal FRET signals). Unfortunately, a poor dynamic range is generally one of the biggest drawbacks for FRET-based biosensors. A biosensor usually consists of a sensing domain, which is fused to FPs, and its dynamic range is highly sensitive to the way in which these two components are connected. The length and the amino acid content of linkers between the sensing domain and FPs have a strong influence on the FRET efficiency and overall dynamic range, because they mainly determine the orientation and the distance between the FPs (van Dongen et al., 2007; Evers et al., 2006; Nagai and Miyawaki, 2004). The process of optimization of a FRET biosensor involves varying the linker length and sequence by generating sensor libraries. Classical linkers in biosensor engineering are (GGSGGS)n and (GGSGGT)n that are flexible and reduce interactions between nearby domains (van Dongen et al., 2007; Nagai and Miyawaki, 2004). Constructed libraries, which may contain up to 108 independent clones, can be efficiently screened by flow cytometry, in order to choose variants with improved characteristics for further application in high-throughput screening (Nguyen and Daugherty, 2005).
VII. Biosensors Consisting of a Single FP
Spectral properties of some FPs can change in response to a specific stimulus. This feature allows the construction of a single FP-based biosensor, which contains only one engineered FP molecule. In certain cases, it is possible to modulate the optical properties of a single FP. One of the options is a mechanical deformation of the FP's β-barrel. The mechanical deformation can be caused by changing conformation of the inserted into the FP molecule additional peptide or domain or by manipulating the new N- and C-termini in the middle of the barrel after a circular permutation of the FP.
Circularly permutated GFP variants have been widely utilized to design efficient biosensors of hydrogen peroxide, calcium, phosphorylation, and membrane potential (Chudakov et al., 2010). In general, RFPs are less tolerant to the polypeptide or domain insertions and circular permutations in comparison to GFPs, probably due to the more complicated posttranslational chemistry of the chromophore formation (Subach et al., 2010). However, Gautam et al. (2009) succeeded in engineering a circularly permuted mKate with new N- and C-termini formed by residues 180 and 182, respectively. The cpmKate180 permutant was shown to serve a promising sensing platform for the development of a series of voltage-sensitive probes, which can be used in live cells. In mCherry, six distinct sites in β-barrel have been identified that were used to create circular permutation variants (Li et al., 2008). Recently, the extensive directed evolution of the most promising cpmCherry variant has yielded a mutant that exhibited 61% of parental mCherry brightness and was found to be highly tolerant of the circular permutation at other locations within the amino acid sequence (Carlson et al., 2010). The main advantage of the circularly permutated FPs as biosensors over the FRET-based biosensors is their dynamic range that can be further improved (Nagai et al., 2004).
Some FP variants exhibit different spectral properties depending on the presence of the particular ions, such as proton, halides, or heavy metal cations. Some examples of biosensors utilizing this feature are YFP-H148Q to detect halides (Jayaraman et al., 2000) and ratiometric deGFPs to measure intracellular pH (Hanson et al., 2002). There are also several examples of a similar behavior among RFPs. A DsRed derivative, known as mNectarine, exhibits a strong pH-dependent fluorescence in physiological pH range with apparent pKa value about 6.9 (Johnson et al., 2009). The mNectarine fusion with human concentrative nucleoside transporter was used to measure pH during the H+–nucleoside cotransport in live cells. However, the calibration required for intensity-based pH measurements and a nonuniform biosensor distribution complicate mNectarine application as a ratio-mentric pH biosensors. It has been shown that mKeima is ratiometric by excitation. Upon alkalization from pH 5.0 to 8.0, the fluorescence of mKeima increased almost 3-fold and decreased more than 12-fold, when excited at 440 and 584 nm, respectively (Piatkevich et al., 2010b). A red fluorescent biosensor based on mKeima may provide a ratiometric readout of intracellular pH for high-throughput assays. A quenching of the red fluorescence of HcRed in the presence of copper ions was employed to develop a soluble copper-sensing system (Rahimi et al., 2007). The same principle can be utilized for the determination of copper concentrations in live cells, based on HcRed as a sensing platform.
Another recently described approach for the detection of protein–protein interactions, as well as for measuring changes in protein complexes upon drug influence and identification of compounds interfering in protein–protein binding, is a bimolecular fluorescent complementation (BiFC) (Kerppola, 2008). The principle of the BiFC assay is to split an FP into two nonfluorescent fragments that can be fused to two proteins of interest. If the proteins of interest interact, the two nonfluorescent fragments are brought into close proximity, so that an FP barrel is reconstituted, and fluorescence arises. All BiFC systems are irreversible: once a split FP is formed, it stays in conjugation, even if the proteins of interest do not interact any more. In contrast to FRET, an interpretation of the BiFC assay results requires less analysis and fewer corrections. However, temporal resolution is limited to the length of time necessary for the chromophore formation after the nonfluorescent fragments association.
Coupling BiFC to flow cytometry has been proven to be a powerful technique for the validation of weak protein interactions and for a screening and identification of optimal ligands in biologically synthesized libraries (Morell et al., 2008). A novel red fluorescent BiFC system that can support fluorescence complementation in most mammalian cell-based studies have been reported recently (Chu et al., 2009). This advanced BiFC system is based on mLumin, a mKate derivative, and has a good performance and sensitivity at 37 °C. Indeed previously developed red fluorescent BiFC systems based on mRFP1-Q66T (Jach et al., 2006) or mCherry (Fan et al., 2008) worked at a lower temperature only, possibly due to the misfolding of the RFP fragments at 37 °C. The GFP variants, which support BiFC under physiological conditions, namely, Cerulean, Citrine, and Venus, can be used in combination with the mLumin-based BiFC system to facilitate simultaneous monitoring of multiple intracellular protein-protein interactions (Shyu et al., 2006). Furthermore, a recently described BiFC-based FRET technique enables an identification of the ternary complexes in live cells (Shyu et al., 2008).
VIII. Perspectives
In a near future, we expect to observe significant efforts to design enhanced bright noncytotoxic FPs for the far-red and infrared regions, which can be efficiently excited with conventional red sources such as 633 nm HeNe and 635–640 nm solid-state lasers.
Further development of the commercial imaging flow cytometers and scanning cytometers and equipping them with green and yellow lasers will allow for more extensive use of OFP and RFP to detect subcellular events and intracellular protein localization.
A wider use of orange solid-state lasers and white supercontinuum lasers will enable the closing the gap between 568 and 633 nm in the excitation sources currently available for flow cytometry (Kapoor et al., 2007, 2008; Telford et al., 2009).
Engineering the next generation of the bright and efficiently folding orange, red, and far-red LSS FPs, which can be excited with 405–457 nm laser sources, will provide the additional red-shifted colors for the multiparameter flow cytometry applications. The LSS FPs will also enable the detection of three FRET pairs or three FRET-based biosensors in a live cell.
Acknowledgments
For helpful discussions, the authors thank Drs. Jinghang Zhang and Steven Porcelli of the Einstein Flow Cytometry Core Facility (supported by the Einstein Cancer Center (NIH/NCI grant CA013330) and the Einstein Center for AIDS Research (NIH grant AI-51519)). This work was supported by the NIH/NIGMS grant GM073913 to V.V.V.
Footnotes
All other uses, reproduction and distribution, including without limitation commercial reprints, selling or licensing copies or access, or posting on open internet sites, your personal or institution’s website or repository, are prohibited. For exceptions, permission may be sought for such use through Elsevier's permission site at: http://www.elsevier.com/locate/permissionusematerial
References
- Ai HW, Hazelwood KL, Davidson MW, Campbell RE. Fluorescent protein FRET pairs for ratiometric imaging of dual biosensors. Nat Methods. 2008;5:401–403. doi: 10.1038/nmeth.1207. [DOI] [PubMed] [Google Scholar]
- Banning C, Votteler J, Hoffmann D, Koppensteiner H, Warmer M, Reimer R, Kirchhoff F, Schubert U, Hauber J, Schindler M. A flow cytometry-based FRET assay to identify and analyse protein–protein interactions in living cells. PLoS One. 2010;5:e9344. doi: 10.1371/journal.pone.0009344. [DOI] [PMC free article] [PubMed] [Google Scholar]
- Bayle V, Nussaume L, Bhat RA. Combination of novel green fluorescent protein mutant TSapphire and DsRed variant mOrange to set up a versatile in planta FRET-FLIM assay. Plant Physiol. 2008;148:51–60. doi: 10.1104/pp.108.117358. [DOI] [PMC free article] [PubMed] [Google Scholar]
- Bogdanov AM, Bogdanova EA, Chudakov DM, Gorodnicheva TV, Lukyanov S, Lukyanov KA. Cell culture medium affects GFP photostability: a solution. Nat Methods. 2009;6:859–860. doi: 10.1038/nmeth1209-859. [DOI] [PubMed] [Google Scholar]
- Bulina ME, Chudakov DM, Britanova OV, Yanushevich YG, Staroverov DB, Chepurnykh TV, Merzlyak EM, Shkrob MA, Lukyanov S, Lukyanov KA. A genetically encoded photosensitizer. Nat Biotechnol. 2006;24:95–99. doi: 10.1038/nbt1175. [DOI] [PubMed] [Google Scholar]
- Campbell RE, Tour O, Palmer AE, Steinbach PA, Baird GS, Zacharias DA, Tsien RY. A monomeric red fluorescent protein. Proc Natl Acad Sci USA. 2002;99:7877–7882. doi: 10.1073/pnas.082243699. [DOI] [PMC free article] [PubMed] [Google Scholar]
- Carlson HJ, Cotton DW, Campbell RE. Circularly permuted monomeric red fluorescent proteins with new termini in the beta-sheet. Protein Sci. 2010;19:1490–1499. doi: 10.1002/pro.428. [DOI] [PMC free article] [PubMed] [Google Scholar]
- Chalfie M, Tu Y, Euskirchen G, Ward WW, Prasher DC. Green fluorescent protein as a marker for gene expression. Science. 1994;263:802–805. doi: 10.1126/science.8303295. [DOI] [PubMed] [Google Scholar]
- Chan FK, Siegel RM, Zacharias D, Swofford R, Holmes KL, Tsien RY, Lenardo MJ. Fluorescence resonance energy transfer analysis of cell surface receptor interactions and signaling using spectral variants of the green fluorescent protein. Cytometry. 2001;44:361–368. doi: 10.1002/1097-0320(20010801)44:4<361::aid-cyto1128>3.0.co;2-3. [DOI] [PubMed] [Google Scholar]
- Chu J, Zhang Z, Zheng Y, Yang J, Qin L, Lu J, Huang ZL, Zeng S, Luo Q. A novel far-red bimolecular fluorescence complementation system that allows for efficient visualization of protein interactions under physiological conditions. Biosens Bioelectron. 2009;25:234–239. doi: 10.1016/j.bios.2009.06.008. [DOI] [PubMed] [Google Scholar]
- Chudakov DM, Matz MV, Lukyanov S, Lukyanov KA. Fluorescent proteins and their applications in imaging living cells and tissues. Physiol Rev. 2010;90:1103–1163. doi: 10.1152/physrev.00038.2009. [DOI] [PubMed] [Google Scholar]
- Day RN, Davidson MW. The fluorescent protein palette: tools for cellular imaging. Chem Soc Rev. 2009;38:2887–2921. doi: 10.1039/b901966a. [DOI] [PMC free article] [PubMed] [Google Scholar]
- van Dongen EM, Evers TH, Dekkers LM, Meijer EW, Klomp LW, Merkx M. Variation of linker length in ratiometric fluorescent sensor proteins allows rational tuning of Zn(II) affinity in the picomolar to femtomolar range. J Am Chem Soc. 2007;129:3494–3495. doi: 10.1021/ja069105d. [DOI] [PubMed] [Google Scholar]
- Domingo B, Sabariegos R, Picazo F, Llopis J. Imaging FRET standards by steady-state fluorescence and lifetime methods. Microsc Res Tech. 2007;70:1010–1021. doi: 10.1002/jemt.20509. [DOI] [PubMed] [Google Scholar]
- Drobizhev M, Tillo S, Makarov NS, Hughes TE, Rebane A. Absolute two-photon absorption spectra and two-photon brightness of orange and red fluorescent proteins. J Phys Chem B. 2009;113:855–859. doi: 10.1021/jp8087379. [DOI] [PMC free article] [PubMed] [Google Scholar]
- Evers TH, van Dongen EM, Faesen AC, Meijer EW, Merkx M. Quantitative understanding of the energy transfer between fluorescent proteins connected via flexible peptide linkers. Biochemistry. 2006;45:13183–13192. doi: 10.1021/bi061288t. [DOI] [PubMed] [Google Scholar]
- Fan JY, Cui ZQ, Wei HP, Zhang ZP, Zhou YF, Wang YP, Zhang XE. Split mCherry as a new red bimolecular fluorescence complementation system for visualizing protein-protein interactions in living cells. Biochem Biophys Res Commun. 2008;367:47–53. doi: 10.1016/j.bbrc.2007.12.101. [DOI] [PubMed] [Google Scholar]
- Fischer M, Haase I, Wiesner S, Müller-Taubenberger A. Visualizing cytoskeleton dynamics in mammalian cells using a humanized variant of monomeric red fluorescent protein. FEBS Lett. 2006;580:2495–2502. doi: 10.1016/j.febslet.2006.03.082. [DOI] [PubMed] [Google Scholar]
- Galperin E, Verkhusha VV, Sorkin A. Three-chromophore FRET microscopy to analyze multiprotein interactions in living cells. Nat Methods. 2004;1:209–217. doi: 10.1038/nmeth720. [DOI] [PubMed] [Google Scholar]
- Gautam SG, Perron A, Mutoh H, Knöpfel T. Exploration of fluorescent protein voltage probes based on circularly permuted fluorescent proteins. Front Neuroengineering. 2009;2:14. doi: 10.3389/neuro.16.014.2009. [DOI] [PMC free article] [PubMed] [Google Scholar]
- Goedhart J, Vermeer JE, Adjobo-Hermans MJ, van Weeren L, Gadella TW., Jr Sensitive detection of p65 homodimers using red-shifted and fluorescent protein-based FRET couples. PLoS One. 2007;2:e1011. doi: 10.1371/journal.pone.0001011. [DOI] [PMC free article] [PubMed] [Google Scholar]
- Griesbeck O, Baird GS, Campbell RE, Zacharias DA, Tsien RY. Reducing the environmental sensitivity of yellow fluorescent protein. Mechanism and applications. J Biol Chem. 2001;276:29188–29194. doi: 10.1074/jbc.M102815200. [DOI] [PubMed] [Google Scholar]
- Hanson GT, McAnaney TB, Park ES, Rendell ME, Yarbrough DK, Chu S, Xi L, Boxer SG, Montrose MH, Remington SJ. Green fluorescent protein variants as ratiometric dual emission pH sensors. 1. Structural characterization and preliminary application. Biochemistry. 2002;41:15477–15488. doi: 10.1021/bi026609p. [DOI] [PubMed] [Google Scholar]
- Hawley TS, Herbert DJ, Eaker SS, Hawley RG. Multiparameter flow cytometry of fluorescent protein reporters. Methods Mol Biol. 2004;263:219–238. doi: 10.1385/1-59259-773-4:219. [DOI] [PubMed] [Google Scholar]
- Hawley TS, Telford WG, Ramezani A, Hawley RG. Four-color flow cytometric detection of retrovirally expressed red, yellow, green, and cyan fluorescent proteins. Biotechniques. 2001;30:1028–1034. doi: 10.2144/01305rr01. [DOI] [PubMed] [Google Scholar]
- He L, Bradrick TD, Karpova TS, Wu X, Fox MH, Fischer R, McNally JG, Knutson JR, Grammer AC, Lipsky PE. Flow cytometric measurement of fluorescence resonance energy transfer from cyan fluorescent protein to yellow fluorescent protein using single laser excitation at 458 nm. Cytometry A. 2003a;53:39–54. doi: 10.1002/cyto.a.10037. [DOI] [PubMed] [Google Scholar]
- He L, Olson DP, Wu X, Karpova TS, McNally JG, Lipsky PE. A flow cytometric method to detect protein-protein interaction in living cells by directly visualizing donor fluorophore quenching during CFP-YFP fluorescence resonance energy transfer (FRET) Cytometry A. 2003b;55:71–85. doi: 10.1002/cyto.a.10073. [DOI] [PubMed] [Google Scholar]
- He L, Wu X, Simone J, Hewgill D, Lipsky PE. Determination of tumor necrosis factor receptor-associated factor trimerization in living cells by CFP-YFP-mRFP FRET detected by flow cytometry. Nucleic Acids Res. 2005;33:e61. doi: 10.1093/nar/gni057. [DOI] [PMC free article] [PubMed] [Google Scholar]
- Jach G, Pesch M, Richter K, Frings S, Uhrig JF. An improved mRFP1 adds red to bimolecular fluorescence complementation. Nat Methods. 2006;3:597–600. doi: 10.1038/nmeth901. [DOI] [PubMed] [Google Scholar]
- Jain RK, Joyce PB, Molinete M, Halban PA, Gorr SU. Oligomerization of green fluorescent protein in the secretory pathway of endocrine cells. Biochem J. 2001;360:645–649. doi: 10.1042/0264-6021:3600645. [DOI] [PMC free article] [PubMed] [Google Scholar]
- Jayaraman S, Haggie P, Wachter RM, Remington SJ, Verkman AS. Mechanism and cellular applications of a green fluorescent protein-based halide sensor. J Biol Chem. 2000;275:6047–6050. doi: 10.1074/jbc.275.9.6047. [DOI] [PubMed] [Google Scholar]
- Johansson DX, Brismar H, Persson MA. Fluorescent protein pair emit intracellular FRET signal suitable for FACS screening. Biochem Biophys Res Commun. 2007;352:449–455. doi: 10.1016/j.bbrc.2006.11.042. [DOI] [PubMed] [Google Scholar]
- Johnson DE, Ai HW, Wong P, Young JD, Campbell RE, Casey JR. Red fluorescent protein pH biosensor to detect concentrative nucleoside transport. J Biol Chem. 2009;284:20499–20511. doi: 10.1074/jbc.M109.019042. [DOI] [PMC free article] [PubMed] [Google Scholar]
- Kamio N, Hirai H, Ashihara E, Tenen DG, Maekawa T, Imanishi J. Use of bicistronic vectors in combination with flow cytometry to screen for effective small interfering RNA target sequences. Biochem Biophys Res Commun. 2010;393:498–503. doi: 10.1016/j.bbrc.2010.02.033. [DOI] [PMC free article] [PubMed] [Google Scholar]
- Kapoor V, Karpov V, Linton C, Subach FV, Verkhusha VV, Telford WG. Solid state yellow and orange lasers for flow cytometry. Cytometry A. 2008;73:570–577. doi: 10.1002/cyto.a.20563. [DOI] [PMC free article] [PubMed] [Google Scholar]
- Kapoor V, Subach FV, Kozlov VG, Grudinin A, Verkhusha VV, Telford WG. New lasers for flow cytometry: filling the gaps. Nat Methods. 2007;4:678–679. doi: 10.1038/nmeth0907-678. [DOI] [PubMed] [Google Scholar]
- Karasawa S, Araki T, Nagai T, Mizuno H, Miyawaki A. Cyan-emitting and orange-emitting fluorescent proteins as a donor/acceptor pair for fluorescence resonance energy transfer. Biochem J. 2004;381:307–312. doi: 10.1042/BJ20040321. [DOI] [PMC free article] [PubMed] [Google Scholar]
- Kerppola TK. Bimolecular fluorescence complementation (BiFC) analysis as a probe of protein interactions in living cells. Annu Rev Biophys. 2008;37:465–487. doi: 10.1146/annurev.biophys.37.032807.125842. [DOI] [PMC free article] [PubMed] [Google Scholar]
- Kogure T, Karasawa S, Araki T, Saito K, Kinjo M, Miyawaki A. A fluorescent variant of a protein from the stony coral Montipora facilitates dual-color single-laser fluorescence cross-correlation spectroscopy. Nat Biotechnol. 2006;24:577–581. doi: 10.1038/nbt1207. [DOI] [PubMed] [Google Scholar]
- Kredel S, Oswald F, Nienhaus K, Deuschle K, Röcker C, Wolff M, Heilker R, Nienhaus GU, Wiedenmann J. mRuby, a bright monomeric red fluorescent protein for labeling of subcellular structures. PLoS One. 2009;4:e4391. doi: 10.1371/journal.pone.0004391. [DOI] [PMC free article] [PubMed] [Google Scholar]
- Kremers GJ, Goedhart J, van den Heuvel DJ, Gerritsen HC, Gadella TW., Jr Improved green and blue fluorescent proteins for expression in bacteria and mammalian cells. Biochemistry. 2007;46:3775–3783. doi: 10.1021/bi0622874. http://physrev.physiology.org/cgi/external_ref?access_num=10.1021%2Fbi0622874&link_type=DOI. [DOI] [PubMed] [Google Scholar]
- Kremers GJ, Goedhart J, van Munster EB, Gadella TW., Jr Cyan and yellow super fluorescent proteins with improved brightness, protein folding, and FRET Forster radius. Biochemistry. 2006;45:6570–6580. doi: 10.1021/bi0516273. [DOI] [PubMed] [Google Scholar]
- Li Y, Sierra AM, Ai HW, Campbell RE. Identification of sites within a monomeric red fluorescent protein that tolerate peptide insertion and testing of corresponding circular permutations. Photochem Photobiol. 2008;84:111–119. doi: 10.1111/j.1751-1097.2007.00206.x. [DOI] [PubMed] [Google Scholar]
- Lin MZ, McKeown MR, Ng HL, Aguilera TA, Shaner NC, Campbell RE, Adams SR, Gross LA, Ma W, Alber T, Tsien RY. Autofluorescent proteins with excitation in the optical window for intravital imaging in mammals. Chem Biol. 2009;16:1169–1179. doi: 10.1016/j.chembiol.2009.10.009. [DOI] [PMC free article] [PubMed] [Google Scholar]
- Matz MV, Fradkov AF, Labas YA, Savitsky AP, Zaraisky AG, Markelov ML, Lukyanov SA. Fluorescent proteins from nonbioluminescent Anthozoa species. Nat Biotechnol. 1999;17:969–973. doi: 10.1038/13657. [DOI] [PubMed] [Google Scholar]
- Merzlyak EM, Goedhart J, Shcherbo D, Bulina ME, Shcheglov AS, Fradkov AF, Gaintzeva A, Lukyanov KA, Lukyanov S, Gadella TW, Chudakov DM. Bright monomeric red fluorescent protein with an extended fluorescence lifetime. Nat Methods. 2007;4:555–557. doi: 10.1038/nmeth1062. [DOI] [PubMed] [Google Scholar]
- Mishin AS, Subach FV, Yampolsky IV, King W, Lukyanov KA, Verkhusha VV. The first mutant of the Aequorea victoria green fluorescent protein that forms a red chromophore. Biochemsitry. 2008;47:4666–4673. doi: 10.1021/bi702130s. [DOI] [PMC free article] [PubMed] [Google Scholar]
- Morell M, Espargaro A, Aviles FX, Ventura S. Study and selection of in vivo protein interactions by coupling bimolecular fluorescence complementation and flow cytometry. Nat Protoc. 2008;3:22–33. doi: 10.1038/nprot.2007.496. [DOI] [PubMed] [Google Scholar]
- Morozova KS, Piatkevich KD, Gould TJ, Zhang J, Bewersdorf J, Verkhusha VV. Far-red fluorescent protein excitable with red lasers for flow cytometry and superresolution STED nanoscopy. Biophys J. 2010;99:L13–L15. doi: 10.1016/j.bpj.2010.04.025. [DOI] [PMC free article] [PubMed] [Google Scholar]
- Mutoh H, Perron A, Dimitrov D, Iwamoto Y, Akemann W, Chudakov DM, Knöpfel T. Spectrally-resolved response properties of the three most advanced FRET based fluorescent protein voltage probes. PLoS One. 2009;4:e4555. doi: 10.1371/journal.pone.0004555. [DOI] [PMC free article] [PubMed] [Google Scholar]
- Nagai T, Ibata K, Park ES, Kubota M, Mikoshiba K, Miyawaki A. A variant of yellow fluorescent protein with fast and efficient maturation for cell-biological applications. Nat Biotechnol. 2002;20:87–90. doi: 10.1038/nbt0102-87. [DOI] [PubMed] [Google Scholar]
- Nagai T, Miyawaki A. A high-throughput method for development of FRET-based indicators for proteolysis. Biochem Biophys Res Commun. 2004;319:72–77. doi: 10.1016/j.bbrc.2004.04.147. [DOI] [PubMed] [Google Scholar]
- Nagai T, Yamada S, Tominaga T, Ichikawa M, Miyawaki A. Expanded dynamic range of fluorescent indicators for Ca(2+) by circularly permuted yellow fluorescent proteins. Proc Natl Aca Sci USA. 2004;101:10554–10559. doi: 10.1073/pnas.0400417101. [DOI] [PMC free article] [PubMed] [Google Scholar]
- Nguyen AW, Daugherty PS. Evolutionary optimization of fluorescent proteins for intracellular FRET. Nat Biotechnol. 2005;23:355–360. doi: 10.1038/nbt1066. [DOI] [PubMed] [Google Scholar]
- Piatkevich KD, Efremenko EN, Verkhusha VV, Varfolomeev SD. Red fluorescent proteins and their properties. Russ Chem Rev. 2010a;79:243–258. [Google Scholar]
- Piatkevich KD, Hulit J, Subach OM, Wu B, Abdulla A, Segall JE, Verkhusha VV. Monomeric red fluorescent proteins with a large Stokes shift. Proc Natl Acad Sci USA. 2010b;107:5369–5374. doi: 10.1073/pnas.0914365107. [DOI] [PMC free article] [PubMed] [Google Scholar]
- Piatkevich KD, Malashkevich VN, Almo SC, Verkhusha VV. Engineering ESPT pathways based on structural analysis of LSSmKate red fluorescent proteins with large Stokes shift. J Am Chem Soc. 2010c;132:10762–10770. doi: 10.1021/ja101974k. [DOI] [PMC free article] [PubMed] [Google Scholar]
- Piatkevich KD, Verkhusha VV. Advances in engineering of fluorescent proteins and photoactivatable proteins with red emission. Curr Opin Chem Biol. 2010;14:23–29. doi: 10.1016/j.cbpa.2009.10.011. [DOI] [PMC free article] [PubMed] [Google Scholar]
- Piljic A, Schultz C. Simultaneous recording of multiple cellular events by FRET. ACS Chem Biol. 2008;3:156–160. doi: 10.1021/cb700247q. [DOI] [PubMed] [Google Scholar]
- Pletnev S, Subach FV, Dauter Z, Wlodawer A, Verkhusha VV. Understanding blue-to-red conversion in monomeric fluorescent timers and hydrolytic degradation of their chromophores. J Am Chem Soc. 2010;132:2243–2253. doi: 10.1021/ja908418r. [DOI] [PMC free article] [PubMed] [Google Scholar]
- Rahimi Y, Shrestha S, Banerjee T, Deo SK. Copper sensing based on the far-red fluorescent protein, HcRed, from Heteractis crispa. Anal Biochem. 2007;370:60–67. doi: 10.1016/j.ab.2007.05.018. [DOI] [PubMed] [Google Scholar]
- Rizzo MA, Davidson MW, Piston DW. Fluorescent protein tracking and detection: applications using fluorescent proteins in living cells. Cold Spring Harb Protoc 2009. 2009 doi: 10.1101/pdb.top64. pdb.top64. [DOI] [PubMed] [Google Scholar]
- Sakaue-Sawano A, Kurokawa H, Morimura T, Hanyu A, Hama H, Osawa H, Kashiwagi S, Fukami K, Miyata T, Miyoshi H, Imamura T, Ogawa M, Masai H, Miyawaki A. Visualizing spatiotemporal dynamics of multicellular cell-cycle progression. Cell. 2008;132:487–498. doi: 10.1016/j.cell.2007.12.033. [DOI] [PubMed] [Google Scholar]
- Shagin DA, Barsova EV, Yanushevich YG, Fradkov AF, Lukyanov KA, Labas YA, Semenova TN, Ugalde JA, Meyers A, Nunez JM, Widder EA, Lukyanov SA, Matz MV. GFP-like proteins as ubiquitous metazoan superfamily: evolution of functional features and structural complexity. Mol Biol Evol. 2004;21:841–850. doi: 10.1093/molbev/msh079. [DOI] [PubMed] [Google Scholar]
- Shaner NC, Campbell RE, Steinbach PA, Giepmans BN, Palmer AE, Tsien RY. Improved monomeric red, orange and yellow fluorescent proteins derived from Discosoma sp. red fluorescent protein. Nat Biotechnol. 2004;22:1567–1572. doi: 10.1038/nbt1037. [DOI] [PubMed] [Google Scholar]
- Shaner NC, Lin MZ, McKeown MR, Steinbach PA, Hazelwood KL, Davidson MW, Tsien RY. Improving the photostability of bright monomeric orange and red fluorescent proteins. Nat Methods. 2008;5:545–551. doi: 10.1038/nmeth.1209. [DOI] [PMC free article] [PubMed] [Google Scholar]
- Shcherbo D, Merzlyak EM, Chepurnykh TV, Fradkov AF, Ermakova GV, Solovieva EA, Lukyanov KA, Bogdanova EA, Zaraisky AG, Lukyanov S, Chudakov DM. Bright far-red fluorescent protein for whole-body imaging. Nat Methods. 2007;4:741–746. doi: 10.1038/nmeth1083. [DOI] [PubMed] [Google Scholar]
- Shcherbo D, Murphy CS, Ermakova GV, Solovieva EA, Chepurnykh TV, Shcheglov AS, Verkhusha VV, Pletnev VZ, Hazelwood KL, Roche PM, Lukyanov S, Zaraisky AG, Davidson MW, Chudakov DM. Far-red fluorescent tags for protein imaging in living tissues. Biochem J. 2009a;418:567–574. doi: 10.1042/BJ20081949. [DOI] [PMC free article] [PubMed] [Google Scholar]
- Shcherbo D, Souslova EA, Goedhart J, Chepurnykh TV, Gaintzeva A, Shemiakina II, Gadella TW, Lukyanov S, Chudakov DM. Practical and reliable FRET/FLIM pair of fluorescent proteins. BMC Biotechnol. 2009b;9:24. doi: 10.1186/1472-6750-9-24. [DOI] [PMC free article] [PubMed] [Google Scholar]
- Shu X, Royant A, Lin MZ, Aguilera TA, Lev-Ram V, Steinbach PA, Tsien RY. Mammalian expression of infrared fluorescent proteins engineered from a bacterial phytochrome. Science. 2009;324:804–807. doi: 10.1126/science.1168683. [DOI] [PMC free article] [PubMed] [Google Scholar]
- Shyu YJ, Liu H, Deng X, Hu CD. Identification of new fluorescent protein fragments for bimolecular fluorescence complementation analysis under physiological conditions. Biotechniques. 2006;40:61–66. doi: 10.2144/000112036. [DOI] [PubMed] [Google Scholar]
- Shyu YJ, Suarez CD, Hu CD. Visualization of AP-1 NF-kappaB ternary complexes in living cells by using a BiFC-based FRET. Proc Natl Acad Sci USA. 2008;105:151–156. doi: 10.1073/pnas.0705181105. [DOI] [PMC free article] [PubMed] [Google Scholar]
- Siegel RM, Chan FK, Zacharias DA, Swofford R, Holmes KL, Tsien RY, Lenardo MJ. Measurement of molecular interactions in living cells by fluorescence resonance energy transfer between variants of the green fluorescent protein. Science STKE. 2000;2000(38):l1. doi: 10.1126/stke.2000.38.pl1. [DOI] [PubMed] [Google Scholar]
- Snapp E. Design and use of fluorescent fusion proteins in cell biology. Curr Protoc Cell Biol. 2005;Chapter 21:21.4.1–21.4.13. doi: 10.1002/0471143030.cb2104s27. Unit 21.4. [DOI] [PMC free article] [PubMed] [Google Scholar]
- Stepanenko OV, Verkhusha VV, Kazakov VI, Shavlovsky MM, Kuznetsova IM, Uversky VN, Turoverov KK. Comparative studies on the structure and stability of fluorescent proteins EGFP, zFP506, mRFP1, dimer2 and DsRed. Biochemistry. 2004;43:14913–14923. doi: 10.1021/bi048725t. [DOI] [PubMed] [Google Scholar]
- Strack RL, Bhattacharyya D, Glick BS, Keenan RJ. Noncytotoxic orange and red/green derivatives of DsRed-Express2 for whole-cell labeling. BMC Biotechnol. 2009a;9:32. doi: 10.1186/1472-6750-9-32. [DOI] [PMC free article] [PubMed] [Google Scholar]
- Strack RL, Hein B, Bhattacharyya D, Hell SW, Keenan RJ, Glick BS. A rapidly maturing far-red derivative of DsRed-Express2 for whole-cell labeling. Biochemistry. 2009b;48:8279–8281. doi: 10.1021/bi900870u. [DOI] [PMC free article] [PubMed] [Google Scholar]
- Strack RL, Strongin DE, Bhattacharyya D, Tao W, Berman A, Broxmeyer HE, Keenan RJ, Glick BS. A noncytotoxic DsRed variant for whole-cell labeling. Nat Methods. 2008;5:955–957. doi: 10.1038/nmeth.1264. [DOI] [PMC free article] [PubMed] [Google Scholar]
- Subach FV, Patterson GH, Manley S, Gillette JM, Lippincott-Schwartz J, Verkhusha VV. Photoactivatable mCherry for high-resolution two-color fluorescence microscopy. Nat Methods. 2009a;6:153–159. doi: 10.1038/nmeth.1298. [DOI] [PMC free article] [PubMed] [Google Scholar]
- Subach FV, Subach OM, Gundorov IS, Morozova KS, Piatkevich KD, Cuervo AM, Verkhusha VV. Monomeric fluorescent timers that change color from blue to red report on cellular trafficking. Nat Chem Biol. 2009b;5:118–126. doi: 10.1038/nchembio.138. [DOI] [PMC free article] [PubMed] [Google Scholar]
- Subach OM, Malashkevich VN, Zencheck WD, Morozova KS, Piatkevich KD, Almo SC, Verkhusha VV. Structural characterization of acylimine-containing blue and red chromophores in mTagBFP and TagRFP fluorescent proteins. Chem Biol. 2010;17:333–341. doi: 10.1016/j.chembiol.2010.03.005. [DOI] [PMC free article] [PubMed] [Google Scholar]
- Telford WG, Subach FV, Verkhusha VV. Super-continuum white light lasers for flow cytometry. Cytometry A. 2009;75:450–459. doi: 10.1002/cyto.a.20687. [DOI] [PMC free article] [PubMed] [Google Scholar]
- Terskikh A, Fradkov A, Ermakova G, Zaraisky A, Tan P, Kajava AV, Zhao X, Lukyanov S, Matz M, Kim S, Weissman I, Siebert P. “Fluorescent timer”: protein that changes color with time. Science. 2000;290:1585–1588. doi: 10.1126/science.290.5496.1585. [DOI] [PubMed] [Google Scholar]
- Tsutsui H, Karasawa S, Okamura Y, Miyawaki A. Improving membrane voltage measurements using FRET with new fluorescent proteins. Nat Methods. 2008;5:683–685. doi: 10.1038/nmeth.1235. [DOI] [PubMed] [Google Scholar]
- Tsuboi T, Kitaguchi T, Karasawa S, Fukuda M, Miyawaki A. Age-dependent preferential dense-core vesicle exocytosis in neuroendocrine cells revealed by newly developed monomeric fluorescent timer protein. Mol Biol Cell. 2010;21:87–94. doi: 10.1091/mbc.E09-08-0722. [DOI] [PMC free article] [PubMed] [Google Scholar]
- Tramier M, Zahid M, Mevel JC, Masse MJ, Coppey-Moisan M. Sensitivity of CFP/YFP and GFP/mCherry pairs to donor photobleaching on FRET determination by fluorescence lifetime imaging microscopy in living cells. Microsc Res Tech. 2006;69:933–939. doi: 10.1002/jemt.20370. [DOI] [PubMed] [Google Scholar]
- Verkhusha VV, Chudakov DM, Gurskaya NG, Lukyanov S, Lukyanov KA. Common pathway for the red chromophore formation in fluorescent proteins and chromoproteins. Chem Biol. 2004;11:845–854. doi: 10.1016/j.chembiol.2004.04.007. [DOI] [PubMed] [Google Scholar]
- Verkhusha VV, Matz MV, Sakurai T, Lukyanov KA. GFP-like fluorescent proteins and chromoproteins of the class Anthozoa. In: Uversky VN, editor. Protein Structures: Kaleidoscope of Structural Properties and Functions. Research Signpost; Kerala, India: 2003a. pp. 405–439. [Google Scholar]
- Verkhusha VV, Pozhitkov AE, Smirnov SA, Borst JW, van Hoek A, Klyachko NL, Levashov AV, Visser AJ. Effect of high pressure and reversed micelles on the fluorescent proteins. Biochim Biophys Acta. 2003b;1622:192–195. doi: 10.1016/s0304-4165(03)00140-5. [DOI] [PubMed] [Google Scholar]
- Vrzheshch PV, Akovbian NA, Varfolomeyev SD, Verkhusha VV. Denaturation and partial renaturation of a tightly tetramerized DsRed protein under mildly acidic conditions. FEBS Lett. 2000;487:203–208. doi: 10.1016/s0014-5793(00)02344-9. [DOI] [PubMed] [Google Scholar]
- van Wageningen S, Pennings AH, van der Reijden BA, Boezeman JB, de Lange F, Jansen JH. Isolation of FRET-positive cells using single 408-nm laser flow cytometry. Cytometry A. 2006;69:291–298. doi: 10.1002/cyto.a.20254. [DOI] [PubMed] [Google Scholar]
- Wang L, Jackson WC, Steinbach PA, Tsien RY. Evolution of new nonantibody proteins via iterative somatic hypermutation. Proc Natl Acad Sci USA. 2004;101:16745–16749. doi: 10.1073/pnas.0407752101. [DOI] [PMC free article] [PubMed] [Google Scholar]
- Wu X, Simone J, Hewgill D, Siegel R, Lipsky PE, He L. Measurement of two caspase activities simultaneously in living cells by a novel dual FRET fluorescent indicator probe. Cytometry A. 2006;69:477–486. doi: 10.1002/cyto.a.20300. [DOI] [PubMed] [Google Scholar]
- Yanushevich YG, Staroverov DB, Savitsky AP, Fradkov AF, Gurskaya NG, Bulina ME, Lukyanov KA, Lukyanov SA. A strategy for the generation of non-aggregating mutants of Anthozoa fluorescent proteins. FEBS Lett. 2002;511:11–14. doi: 10.1016/s0014-5793(01)03263-x. [DOI] [PubMed] [Google Scholar]
- You X, Nguyen AW, Jabaiah A, Sheff MA, Thorn KS, Daugherty PS. Intracellular protein interaction mapping with FRET hybrids. Proc Natl Acad Sci USA. 2006;103:18458–18463. doi: 10.1073/pnas.0605422103. [DOI] [PMC free article] [PubMed] [Google Scholar]
- Zacharias DA, Violin JD, Newton AC, Tsien RY. Partitioning of lipid-modified monomeric GFPs into membrane microdomains of live cells. Science. 2002;296:913–916. doi: 10.1126/science.1068539. [DOI] [PubMed] [Google Scholar]
- Zapata-Hommer O, Griesbeck O. Efficiently folding and circularly permuted variants of the Sapphire mutant of GFP. BMC Biotechnol. 2003;3:5. doi: 10.1186/1472-6750-3-5. [DOI] [PMC free article] [PubMed] [Google Scholar]
- Zolotukhin S, Potter M, Hauswirth WW, Guy J, Muzyczka N. A “humanized” green fluorescent protein cDNA adapted for high-level expression in mammalian cells. J Virol. 1996;70:4646–4654. doi: 10.1128/jvi.70.7.4646-4654.1996. [DOI] [PMC free article] [PubMed] [Google Scholar]
- Zuker M. Mfold web server for nucleic acid folding and hybridization prediction. Nucleic Acids Res. 2003;31:3406–3415. doi: 10.1093/nar/gkg595. [DOI] [PMC free article] [PubMed] [Google Scholar]