

Summary
The sleep EEG changes across adolescence, however, there are conflicting data as to whether EEG changes are regionally specific, are evident in NREM and REM sleep, and whether there are sex differences. The present study seeks to resolve some of these issues in a combined cross-sectional and longitudinal analysis of sleep EEG in adolescents. Thirty three healthy adolescents (18 boys, 15 girls; 11-14 years) were studied on two occasions 6-8 months apart. Cross-sectional analysis of data from the initial visit revealed significantly less slow wave sleep, delta (0.3 to <4 Hz), and theta (4 - <8 Hz) power in both NREM and REM sleep with advancing age. The age-delta power relationship was significant at the occipital site, with age accounting for 26 % of the variance. Longitudinal analysis revealed that NREM delta power declined significantly from the initial to follow-up visit, in association with declining amplitude and incidence (p < 0.01), with the effect being greatest at the occipital site. REM delta power also declined over time in association with reduced amplitude (p < 0.01). There were longitudinal reductions in theta, alpha and sigma power in NREM and REM sleep evident at the occipital site at follow-up (p < 0.01). No sex differences were apparent in the pattern of change with age for NREM or REM sleep. Declines in sleep EEG spectral power occur across adolescence in both boys and girls, particularly in the occipital derivation, and are not state-specific, occurring in both NREM and REM sleep.
Keywords: delta power, sex differences, REM sleep, topographic
Introduction
Adolescence is characterized by dramatic changes in sleep, most notably a marked reduction in slow wave sleep (SWS) as reviewed in (Colrain and Baker, 2011). Quantitative analysis of the sleep electroencephalogram (EEG) has provided a more detailed description of the changes in sleep across adolescence with an emphasis on changes in the characteristics of slow waves. Cross-sectional studies have reported a dramatic decrease in slow wave (delta) activity (Feinberg et al., 2006, Jenni and Carskadon, 2004), slow wave amplitude and slope of slow waves (Kurth et al., 2010a) across adolescence. A recent longitudinal study of adolescents across the age range of 9 to 17 years has confirmed the decline in delta and theta power during NREM sleep and provided further insight of the timing of maturational development in adolescence (Campbell and Feinberg, 2009). NREM delta power is maintained between age 9 and 11 years, followed by a steep decline of about 66 % beginning between age 11 and 12 years (Campbell and Feinberg, 2009). Spectral activity within higher frequency bands, including sigma and beta is also lower in older, more mature adolescents compared to prepubertal adolescents (Jenni and Carskadon, 2004).
The decline in total EEG spectral power across adolescence is evident in wakefulness (Gasser et al., 1988b), and both NREM and rapid eye movement (REM) sleep (Jenni and Carskadon, 2004, Tarokh and Carskadon, 2010), suggesting that EEG-generating mechanisms change across adolescence (Jenni and Carskadon, 2004). There are also substantial changes in brain structure, with a loss of gray matter volume (Giedd et al., 1999), reduction in cortical thickness (Tamnes et al., 2009) and increased white matter volume (Giedd et al., 1999, Lebel et al., 2008, Tamnes et al., 2009) across adolescence. It has been hypothesized (Feinberg, 1982) that the decline in NREM EEG power is driven by the decrease in synaptic density, or ‘pruning’ and represents a process of brain maturation during adolescence. Buchmann and colleagues (Buchmann et al., 2011) provided support for this hypothesis by showing significant correlations between slow wave amplitude and cortical gray matter volume in a population of children and adolescents aged 8 – 19 years.
The maturational changes in the brain are regionally-specific, with maturation generally progressing in a posterior-to-anterior and peripheral-to-central manner (Shaw et al., 2008). Whether there are also regional differences in the decline in EEG power across adolescence has been investigated only to a limited extent. Jenni and colleagues (Jenni et al., 2005) reported that the decrease in delta power in NREM sleep in mature compared with pre-pubertal adolescents was equally evident at both frontal and posterior regions suggesting that maturational changes in the sleep EEG occur independent of derivation. Recently, another study reported that the decline in power over a 2-year period of adolescence was most pronounced in the left central and right occipital region, suggesting an asymmetrical decline (Tarokh and Carskadon, 2010). Recordings were not made from the frontal region in that study. Feinberg and colleagues (Feinberg et al., 2011) reported longitudinal data recorded in children aged 6-18 years. They found that delta power declined earliest at O1 and latest at Fz, a pattern consistent with dendritic pruning patterns evident in brain development (Shaw et al., 2008), however they only present data from NREM sleep. Recently, one group used 128 channel EEG recordings to evaluate sleep EEG in subjects aged 2.4 - 19.4 years. In the younger children, SWA was seen predominantly over occipital regions, with anterior movement of the topography with increasing age (Kurth et al. 2010b).
There are conflicting reports about sex differences in sleep during adolescence and whether there are sex differences in the trajectory of change in delta power across adolescence. Studies have found few differences in PSG sleep between adolescent boys and girls (Carskadon, 1983, Karacan et al., 1975) and both boys and girls show a similar rate of decline in SWS across Tanner stage (Carskadon, 1983). Few studies have investigated sex-related differences in development of the sleep EEG, based on quantitative analysis, across adolescence. One study reported no sex differences in sleep EEG power bands in pre-pubertal and mature boys and girls (Jenni et al., 2005). However, Campbell et al (Campbell et al., 2005) found higher NREM delta power in 12 year-old boys, due to higher delta wave amplitude compared to girls, but no sex differences in 9 year-olds suggesting that the decline in NREM delta power may start at an earlier age in girls than in boys. Additional data from their longitudinal study has further shown that girls and boys have similar NREM delta power between ages 9 to 11 years but that girls have less delta power than boys between ages 12 to 14 years, although the rate of decline in delta power across adolescence is similar in both sexes (Feinberg et al., 2006). There was no longer any difference in NREM delta power between boys and girls when they reached 16 years of age (Feinberg and Campbell, 2010). This type of analysis has not been conducted on REM EEG.
The aim of this study was to further investigate changes in sleep and sleep EEG at different EEG derivations during adolescence using a combined cross-sectional and longitudinal design over a short time period (6-8 months) in boys and girls. Specifically, we aimed to investigate regional and sex-related differences in EEG power density across a broad frequency range (0.3 – 23 Hz), in both NREM and REM sleep.
Methods
Subjects
Adolescents (11 – 14 years old) were recruited from the community to participate in the study, which was approved by the IRB at SRI International. After a brief phone screen with a parent, the adolescent and parent were invited for a screening interview at SRI International. At this visit, parents gave informed consent for their children to participate and the children gave assent. At their initial interview and again at a follow-up interview, 6-8 months later, parents and their children were interviewed with a structured interview (Kiddie Schedule for Affective Disorders, K-SADS) to assess current and lifetime history of psychiatric disorders (Kaufman et al., 1997). None of the children met criteria for diagnosis of past or current psychiatric disorders. Other exclusion criteria were history of loss of consciousness > 30 minutes or central nervous system diseases. At each interview, adolescents were given the self-administered rating scale for pubertal development (Carskadon and Acebo, 1993). Boys and girls were classified as prepubertal (Tanner 1), early pubertal (Tanner 2), midpubertal (Tanner 3), Late pubertal (Tanner 4), post pubertal (Tanner 5) (Crockett, 1988). Characteristics of the thirty three adolescents (18 boys and 15 girls) who met criteria and participated in the study are given in Table 1. Only seven participants showed an advance in pubertal scores at the follow-up visit compared with the initial visit.
Table 1. Characteristics of participants at the start of the study.
| Boys | Girls | |
|---|---|---|
| Sample size | 18 | 15 |
| Age (years, mean (SD)) | 12.7 (0.9) | 12.4 (0.7) |
| Tanner Stage (median) | 2* | 3 |
| Height (m) | 1.61 (0.1) | 1.58 (0.07) |
| Weight (Kg) | 50.8 (10.7) | 47.8 (8.4) |
significantly different from girls (X2 = 51.4, p< 0.01, n = 14 girls)
Study Design
All participants had an initial clinical PSG screening night to ensure that they did not suffer from a sleep disorder. Seventeen adolescents had their PSG screening night in the laboratory (Compumedics E-Series, Compumedics, Abbotsford Vic. Australia) and 16 adolescents had the screening at home (Compumedics Somté PSG, Compumedics, Abbotsford Vic. Australia) using Compumedics Profusion 3 software. None of the participants showed evidence of obstructive sleep apnea syndrome (apnea-hypopnea index > 1). Following screening, participants came to the laboratory for a sleep EEG recording on two occasions: an initial recording and a follow-up recording, which occurred 6 – 8 months later (average: 7.4 ± 1 months). At each visit, adolescents were accompanied by a parent. Adolescents were requested to maintain their usual schedules for at least five nights before their overnight study and went to bed and awoke at their usual times in the laboratory.
Data acquisition and analysis
Electroencephalographic (EEG), electro-oculographic (EOG) and electromyographic (EMG) recordings were made using E-series amplifiers and Profusion software linked to appropriate transducers. Electrodes for EEG recordings were placed at F3, F4, C3, C4, O1, and O2 sites according to the international 10-20 system and were cross-referenced to A1 or A2. EEG signals were digitized at a sampling rate of 256 Hz. Data were filtered offline with a bandpass of 0.3-30 Hz for visual scoring of the PSG. Thirty-second epochs were scored according to standard criteria (Rechtschaffen and Kales, 1968) by two scorers blind to diagnosis of the subjects. Inter-rater reliability of sleep scoring was set at 0.90 with discrepancies resolved by a third scorer.
Quantitative EEG analysis of NREM and REM sleep
Power spectral and period-amplitude analyses were performed using PASS PLUS EEG analysis software (Delta Software, St. Louis, Mo.) on Frontal (F3 or F4), Central (C3 or C4) and Occipital (O1 or O2) EEG signals referenced to contralateral mastoids; left or right derivations were chosen depending on quality of the signal. We analyzed the left derivations (F3-A2, C3-A2 and O1-A2) for the majority (90 %) of subjects in our study, with the right derivations being used only if poor signal quality prevented using the left derivations. Spectral power reflects both the incidence and amplitude of waves in a particular EEG frequency band whereas period amplitude analysis can determine the separate contributions of wave amplitude and incidence (Feinberg et al., 2000). Data were refiltered with a bandpass of 0.15-60 Hz. A fast fourier transform (FFT) routine was performed on epochs of 4 s Welch tapered windows with 2.0 s overlap, resulting in a frequency resolution of 0.25 Hz. Spectral power density (μV2/Hz) was calculated for the main frequency bands: delta (or slow wave activity, defined in this study as 0.3 – <4 Hz comprising slow and delta rhythms); theta (4 - <8 Hz); alpha (8- <12 Hz); sigma (12 - <15 Hz); beta1 (15 – <23 Hz). We also analyzed the delta band with period-amplitude analysis (PAA) using zero-cross measures. The specific PAA measures investigated were wave incidence (‘time in band’, sum of all half-wave durations, measured in seconds) per 30-s epoch, and ‘average sample amplitude’ (measured in μV).
Epochs containing movement or artifact were excluded using a fully-automated process described elsewhere (Feige et al., 1999). Power spectra and period amplitude values were averaged across NREM sleep (stages 2, 3, and 4) and REM sleep separately for the entire night. Power density values for each of the broad frequency bands were normalized with a logarithmic transformation.
Statistical Analysis
One girl and one boy did not complete the second recording and another boy had extremely poor sleep (sleep efficiency < 60 %) at follow-up. Further, one initial night (boy) and one follow-up recording (girl) could not be subjected to computerized analysis due to excessive artifact. The total sample size, therefore, was 30 for longitudinal analysis of visually-scored PSG data and 28 for PSA and PAA data. Data from another subject was excluded from analysis of REM sleep EEG due to insufficient artifact-free REM sleep on both nights.
All results are reported as means (±SD) unless otherwise indicated. Two-way repeated-measures ANOVAs were used to investigate changes in visually-scored PSG variables with time (Initial visit and 6-8 month follow-up) as a within factor and sex as a between-group factor. Variables derived from power spectral and period amplitude analyses were analyzed with a repeated-measures ANOVA, with time and derivation (Frontal, Central, Occipital) as repeated measures, and sex as a between-group factor. When Maunchly's test of sphericity showed significance for derivation, degrees of freedom were adjusted using the Greenhouse-Geisser correction but original degrees of freedom are reported. Linear regression analysis was conducted to determine whether age at the initial visit predicted the extent of change between the initial and follow-up visits in variables derived from PSA and PAA of the EEG.
Additional cross-sectional analyses were conducted on data collected from the initial visit only. Linear regression models with age as the independent variable were used to determine how well age predicted visually-scored PSG variables derived from data collected at the initial visit. Repeated-measures ANOVA models were used to investigate differences in power spectral and period amplitude variables collected at the initial visit according to age, sex and derivation (frontal, central, occipital). Age was entered as a covariate. The age × derivation interaction term in this model provided a test of differences of the age regression slopes between different electrode derivations. When this term was significant, regression was conducted to determine how well age predicted each variable.
Results
Cross-sectional analyses of data from initial visit
Variables derived from visual scoring of the polysomnogram are shown in Table 2. Age was a significant predictor of time spent in slow wave sleep [F (1,30) = 4.6, p = 0.041, B = -14.1, r2 = 0.13]. None of the other PSG variables was significantly predicted by age.
Table 2. Variables derived from visual scoring of the polysomnogram in 16 adolescent boys and 14 adolescent girls at an initial visit.
| PSG variable | Boys | Girls | |||
|---|---|---|---|---|---|
| Visit 1 | Visit 2 | Visit 1 | Visit 2 | ANOVA | |
| Total Recording Time (min) | 559.5 | 518.9 | 554.4 | 545.8 | Time: F (1,28) = 5.8, p = 0.02 Sex: ns Interaction: p = 0.13 (ns) |
| Total Sleep Time (min) | 484.6 (50.9) | 476.8 (39.9) | 492.4 (49.7) | 492.7 (58.3) | Time: ns Sex: ns Interaction: ns |
| Sleep Efficiency (%) | 87.7 (7.0) | 92.7 (4.1) | 89.7 (4.7) | 92.7 (3.4) | Time: F (1,28) = 10.2, p = 0.004 Sex: ns Interaction: ns |
| Wake after sleep onset (min) | 45.2 (34.8) | 18.7 (9.8) | 38.9 (27.5) | 24.1 (29.5) | Time: F (1,28) = 15.0, p = 0.001 Sex: ns Interaction: ns |
| Sleep onset latency (min) | 23.2 (13.6) | 18.8 (20.8) | 19.1 (11.3) | 21.1 (17.8) | Time: ns Sex: ns Interaction: ns |
| REM latency (min) | 117.5 (28.0) | 128.8 (54.6) | 150.3 (81.6) | 133.0 (38.8) | Time: ns Sex: ns Interaction: ns |
| Number of wake periods | 24.1 (8.3) | 20.2 (6.9) | 24.1 (6.5) | 13.0 (4.7) | Time: F (1,28) = 18.7, p < 0.001 Sex: p = 0.06 (ns) Interaction: F (1,28) = 4.3, p = 0.048 |
| Stage 1 (% of TST) | 3.3 (1.7) | 2.3 (1.1) | 3.3 (1.8) | 2.4 (1.2) | Time: F (1,28) = 8.2, p = 0.008 Sex: ns Interaction: ns |
| Stage 2 (% of TST) | 51.1 (5.6) | 51.9 (5.3) | 52.7 (6.2) | 50.9 (2.9) | Time: ns Sex: ns Interaction: ns |
| SWS (% of TST) | 24.9 (6.9) | 23.9 (5.0) | 26.4 (6.0) | 25.1 (5.7) | Time: ns Sex: ns Interaction: ns |
| REM (%of TST) | 20.8 (4.2) | 21.8 (3.8)a | 17.6 (5.4) | 21.6 (3.4)a | Time: F (1,28) = 9.1, p = 0.005 Sex: ns Interaction: p = 0.09 (ns) |
ns = not significant
NREM sleep EEG
For delta power, there was a significant main effect of age [F (1,29) = 4.4, p = 0.04] and a significant interaction between derivation and age [F (2,58) = 7.3, p = 0.004]. The linear regression equation was significant for the occipital region only [F (1,30) = 10.5, p = 0.003, B = -0.131, r2 = 0.26], –with delta power declining with advancing age in the occipital region (Figure 1). Delta incidence also declined significantly with age [F(1,29) = 8.9, p = 0.006] and there was a significant interaction between derivation and age [F(2,58) = 3.9, p = 0.04], with the decline being steepest at the occipital site. Regression equations were significant for central [F (1,30) = 6.8, p = 0.01, B = -0.48, r2 = 0.19] and occipital [F(1,30) = 12.7, p = 0.001, B = -0.72, r2 = 0.30] derivations. Delta amplitude tended to decline across adolescence regardless of derivation although the effect was not significant [F (1,29) = 3.3, p = 0.08]. There were no significant sex effects or interaction for delta power, incidence or amplitude in NREM sleep. There was a significant derivation effect for delta power [F(2,58) = 3.8, p = 0.04], which was highest at the frontal site.
Figure 1.
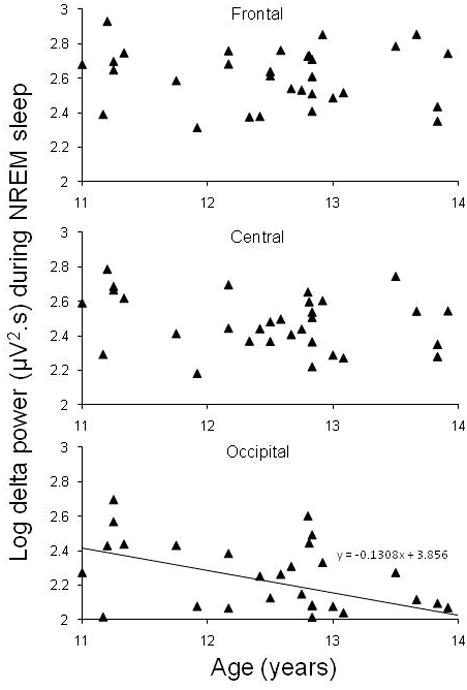
Absolute delta power (log) at Frontal (F3-A2 or F4-A1), Central (C3-A2 or C4-A1), and Occipital (O1-A2 or O2-A1) sites during NREM sleep as a function of age in the cross-sectional analysis of adolescents at their initial visit. Data represent one point per subject. The solid line indicates a significant linear regression function fitted to the data for the occipital derivation.
Age predicted theta power decline [F (1,29) = 5.3, p = 0.03], with no age × derivation interaction. Linear regression equations were significant for central [F(1,30) = 4.7, p = 0.04, B = -0.07, r2 = 0.14] and occipital [F (1,30) = 7.6, p = 0.01, B = -0.1, r2 = 0.20] sites. There were no significant age, derivation, sex or interaction effects for alpha, sigma, or beta1 power.
REM sleep EEG
There were significant main effects of age for delta power [F(1,28) = 5.4, p = 0.027] and amplitude [F(1,28) = 6.3, p = 0.018], but not for delta incidence. Delta power and amplitude both declined with increasing age across adolescence. There were no significant derivation, sex, or interaction effects for any delta variables in REM sleep.
Theta power declined with age [F(1,28) = 6.9, p = 0.014]. The main effect of age was not significant for power in alpha, sigma, or beta1 frequency bands. There were no significant derivation, sex or interaction effects for theta, alpha, sigma, or beta1 power.
Longitudinal analyses of data from initial and follow-up visits
Variables derived from visual scoring of the polysomnogram are shown in Table 2, together with their ANOVA statistics. Time in bed (total recording time) was significantly shorter but TST was unchanged at follow-up compared with the initial visit. Sleep efficiency was better due to less WASO and fewer awakenings during follow-up compared with the initial visit. Girls showed a greater decrease in number of awakenings at follow-up than boys. There were also significant effects of time for %Stage 1 sleep and %REM sleep, with both boys and girls having less Stage 1 sleep and more REM sleep during the follow-up visit.
EEG power spectra and period amplitude analysis
Figure 2 shows the average absolute EEG power (0.3 – 23 Hz) in 1 Hz bins, during NREM sleep and REM sleep at the follow-up visit expressed as a percentage of the initial night for three sites (Frontal, Central, Occipital) for the combined group of male and female adolescents. Significant results from the Time × Sex × Derivation ANOVAs for NREM and REM sleep spectral activity in the five main frequency bands are shown in Table 3. There were no significant effects of sex for any of the frequency bands.
Figure 2.
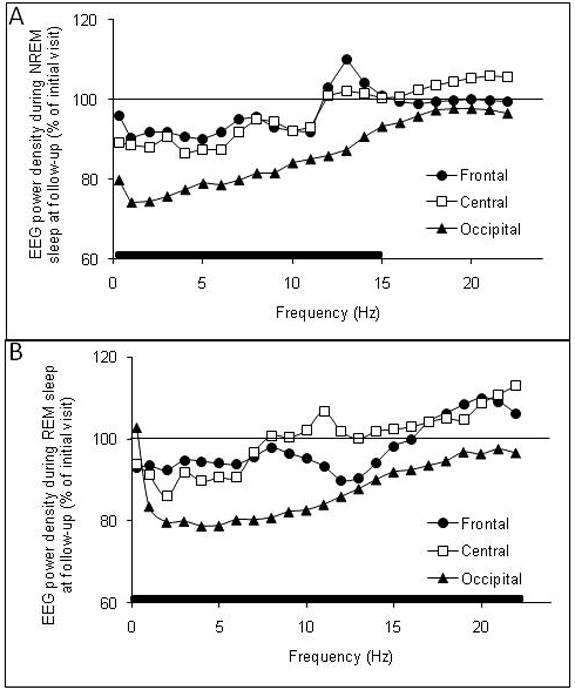
Absolute electroencephalogram (EEG) power density in the frequency range of 0.3 – 23 Hz at Frontal (F3-A2 or F4-A2), Central (C3-A2 or C4-A1), and Occipital (O1-A2 or O2-A1) derivations during (A) NREM sleep and (B) REM sleep in adolescents at a 6-8 month follow-up visit expressed as a percentage of the initial visit. Solid bars along the x-axis denote significant time × derivation interaction effects. See text for details of statistical comparisons.
Table 3.
Time, Derivation, and Time × Derivation effects for repeated-measures ANOVAs for NREM and REM sleep spectral activity.
| EEG frequency band (Hz) | Time effect | Derivation effect | Time × Derivation interaction | |||
|---|---|---|---|---|---|---|
| F (1, 26) | P | F (2, 52) | P | F (2, 52) | P | |
| NREM sleep | ||||||
| Delta (0.3 – <4 Hz) | 23.9 | < 0.001 | 157.8 | < 0.001 | 6.4 | 0.009 |
| Theta (4 - <8 Hz) | 31.2 | < 0.001 | 71.1 | < 0.001 | 4.2 | 0.04 |
| Alpha (8 - <12 Hz) | 31.6 | < 0.001 | 98.6 | < 0.001 | 5.0 | 0.021 |
| Sigma (12 - < 15 Hz) | 3.3 | ns | 125.9 | < 0.001 | 6.9 | 0.005 |
| Beta1 (15 - <23 Hz) | 1.9 | ns | 17.2 | < 0.001 | 1.1 | ns |
| F (1, 25) | P | F (2, 50) | P | F (2, 50) | P | |
| REM sleep | ||||||
| Delta | 44.9 | < 0.001 | 8.9 | 0.005 | 6.1 | 0.01 |
| Theta | 46.9 | < 0.001 | 30.5 | < 0.001 | 5.9 | 0.01 |
| Alpha | 14.1 | 0.001 | 13.4 | < 0.001 | 8.2 | 0.005 |
| Sigma | 17.4 | < 0.001 | 0.9 | ns | 6.2 | 0.008 |
| Beta1 | 1.4 | ns | 19.1 | < 0.001 | 5.1 | 0.01 |
NREM sleep
Delta power, delta wave incidence, and delta wave amplitude for three sites (Frontal, Central, Occipital) during NREM sleep in the adolescents at their initial and follow-up visits are shown in Figure 3. Delta power was lower at the follow-up visit, with a significant time × derivation interaction showing that the effect was greatest at the occipital site (Table 3). Both delta incidence and amplitude were significantly lower at the follow-up visit with no time × derivation interactions. There were significant main effects of derivation for all delta frequency measures, with delta power (Table 3), incidence [F (2,52) = 37.6, p < 0.001] and amplitude [F (2,52) = 176.9, p < 0.001] being higher at the frontal site (Figure 3).
Figure 3.
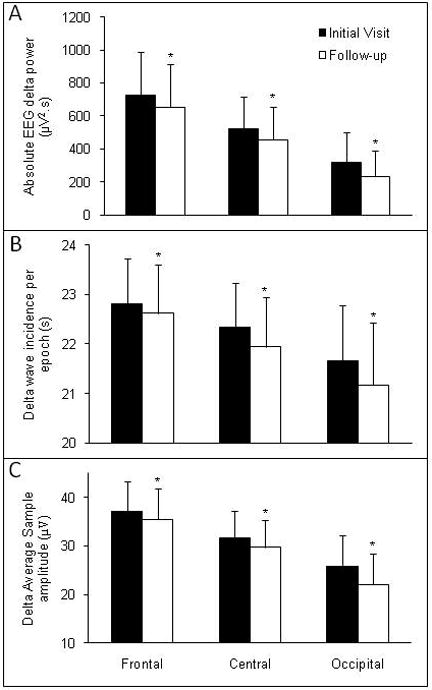
Results of quantitative analysis of the delta frequency band (0.3 – 4 Hz) of the EEG at Frontal (F3-A2 or F4-A1), Central (C3-A2 or C4-A1) and Occipital (O1-A2 or O2-A1) derivations during NREM sleep in adolescents at an initial visit and follow-up visit, 6-8 months later. Power density (Panel A) was calculated based on a fast Fourier transform of the EEG signal. Statistical comparisons were performed on log-transformed data but absolute values are presented in the Figure. Delta incidence (Panel B) and Amplitude (Panel C) were calculated from period amplitude analysis of the EEG signal. Values are shown as mean + SD. * p < 0.05, significantly different from initial visit. Delta power, incidence, and amplitude were highest at the frontal site.
There was a significant time effect and time × derivation interaction for theta power in NREM sleep which was lower at the follow-up visit, particularly at the occipital site (Table 3). There was a significant main effect of electrode derivation for theta power which was higher at frontal sites (Table 3). Alpha and sigma power showed significant time × derivation interaction effects indicating a greater drop in power at occipital sites at the follow-up visit (Table 3, Figure 2A). There were no significant time or time × derivation effects for beta1 power in NREM sleep. Alpha, sigma and beta 1 power showed significant derivation effects with more power at occipital sites (Table 3).
Linear regression models indicated that age at the initial visit was not a significant predictor of the extent of change over time in any of the EEG measures in NREM sleep except frontal alpha power [F(1,26) = 4.8, p = 0.04, B = 0.847], which showed that older adolescents were more likely to have a greater decline in alpha power in NREM sleep at the frontal site at follow-up relative to the initial visit.
REM sleep
There were significant time and time × derivation effects for REM sleep delta power (Table 3), which was significantly lower at the follow-up visit compared with the initial visit, with the effect being most pronounced at the occipital site (Figure 2B). There were significant time [F (1,25) = 28.7, p < 0.001] and time × derivation [F (2,50) = 4.2, p = 0.029] interaction effects for delta amplitude, which was lower at the follow-up visit, particularly at the occipital site. The main effect of time for delta incidence was not significant, although delta incidence tended to be lower at follow-up [F (1,25) = 2.5, p = 0.1]. The time × derivation interaction effect for delta incidence in REM sleep was also not significant (p = 0.7). Delta power (Table 3), amplitude [F (2,50) = 5.3, p = 0.021] and incidence [F (2,50) = 8.2, p = 0.004] all displayed significant main effects of derivation with values being highest at frontal and lowest at occipital sites.
There were significant time and time × derivation interaction effects for theta power (Table 3), which declined over time, particularly at the occipital site. There was also a significant derivation effect for theta power, which was highest at the frontal site.
There were significant time and time × derivation interaction effects for alpha and sigma power (Table 3), which both declined over time most prominently at the occipital site (Figure 2B). There was a significant interaction effect for beta1 power, which declined over time at the occipital site. Alpha and beta 1 power showed significant derivation effects with more power at occipital sites.
For REM sleep, linear regression indicated that age at the initial visit significantly predicted the extent of change in delta power [F (1,25) = 4.3, p = 0.049, B = -21.6] and theta power [F (1,25) = 4.6, p = 0.041, B = -1.7] at the occipital site from initial to follow-up visit.
Discussion
Delta power in NREM and REM sleep declined most prominently in the occipital region with increasing age due to a combined decrease in incidence and amplitude of delta waves in NREM sleep and a decrease in delta amplitude in REM sleep. Theta, alpha, and sigma power in NREM and REM sleep also declined from the initial to follow-up visit in the occipital region. These findings add to the existing literature showing that adolescence is a period of remarkable change in the EEG across a broad frequency spectrum that presumably is related to underlying changes in brain structure and connectivity during this period.
We found no significant sex effects for any of the EEG variables from our cross-sectional or longitudinal analyses. These findings are in contrast to those of others (Campbell et al., 2005), who reported that girls had lower delta power at a central derivation compared with boys across the 12 - 14 age range. The adolescents in our study were in that age bracket, being between the ages of 11 – 14 years old. Therefore, it is unclear why we did not find any significant sex-related differences. Possibly, pubertal status may play a role; the girls in our study were more mature than boys at both recordings. However, another study (Jenni et al., 2005) did not find significant differences in sleep EEG power in any frequency bands between adolescent boys and girls who were matched based on pubertal status rather than age. Studies that have investigated potential sex differences in the characteristics of the wake EEG have also produced conflicting results (Clarke et al., 2001, Gasser et al., 1988b). Further longitudinal studies may help clarify whether there are sex-related differences in the sleep EEG across a wider window of pubertal development.
Our results confirm those of others showing that delta and theta power during sleep decline across adolescence (Campbell and Feinberg, 2009, Feinberg et al., 2006, Jenni and Carskadon, 2004, Jenni et al., 2005, Tarokh and Carskadon, 2010, Feinberg and Campbell, 2010). These effects are apparent in NREM and REM sleep and are therefore state independent as shown by others (Jenni and Carskadon, 2004, Jenni et al., 2005, Tarokh and Carskadon, 2010). Longitudinal analysis clearly showed that the decline in delta power in NREM sleep was associated with a combination of decline in delta amplitude and delta incidence, which supports findings from other studies showing a decrease in both amplitude (Feinberg and Campbell, 2010, Kurth et al., 2010a) and incidence of slow waves (Coble et al., 1987, Feinberg and Campbell, 2010) during NREM sleep across adolescence. The decline in REM sleep delta power was associated with a decline in amplitude and a non-significant trend for a decline in delta incidence.
As shown previously in adolescents (Feinberg et al., 2011, Jenni et al., 2005), we found that delta and theta power were greatest at frontal sites. This finding confirms the typical frontal predominance of delta activity measured as spontaneous (Ferri et al., 2005, Finelli et al., 2001), or evoked (Colrain et al., 1999, Cote et al., 1999) delta waveforms. Despite the frontal predominance of the waveforms, both longitudinal and cross-sectional analyses of our data showed that the decline in delta and theta power during NREM and REM sleep during adolescence is greatest at occipital sites. This result clearly supports recent findings (Feinberg et al., 2011) and stands in contrast to an earlier study (Jenni et al., 2005) that found that delta and theta power differed between developmental groups to a similar extent regardless of derivation. The present data and those in (Feinberg et al., 2011) are from electrodes distributed across the scalp referenced to the contralateral mastoid whereas Jenni et al (Jenni et al., 2005) used bipolar differential derivations (Fz/Cz and Pz/Oz), which may be a reason for discrepant results. Tarokh and Carskadon (Tarokh and Carskadon, 2010) found that changes in EEG power across adolescence were most pronounced at the left central (C3/A2) and right occipital (O2/A1) derivations. These findings suggest there may be hemispheric asymmetries in the development of sleep EEG power, which we did not investigate.
Similar to our findings, studies that have investigated changes in the characteristics of the wake EEG across adolescence have reported that the decline in absolute delta, theta and alpha1 power with age is strongest at posterior derivations (Clarke et al., 2001, Gasser et al., 1988a). It should be emphasized that while positron emission tomography (PET) (Dang-Vu et al., 2005) and high density EEG array (Massimini et al., 2004) studies imply a role for frontal cortex in the generation of delta activity during sleep in adults, delta activity scalp areas, and is manifest when cortical tissue is in an appropriate hyperpolarized state necessary for burst firing (Steriade et al., 1993). Thus a change in occipital delta activity with development is probably more reflective of a change in occipital cortical tissue properties rather than in delta generation mechanisms per se. Kurth et al. (Kurth et al., 2010b) have also demonstrated an occipital maximum for slow wave activity in younger children in contrast to the frontal maximum in older adolescents, implying a decline in occipital delta activity
It is hypothesized that a reduction in EEG power is related to an underlying reduction in synaptic density of the cortex (Feinberg and Campbell, 2010). Our findings of a steeper decline in occipital delta and theta power across a short window of adolescence suggest that delta and theta bands mature at a faster rate possibly in association with a faster reduction in synaptic density in the occipital region compared with more frontal regions. A cross-sectional study that investigated wake EEG characteristics and regional gray matter volume in adolescents found significant positive correlations between gray matter volumes and corresponding regional slow wave powers, supporting the likelihood of a relationship between the number of active synapses and absolute EEG power (Whitford et al., 2007). Buchmann et al. (Buchmann et al., 2011) also provide cross sectional data showing significant correlations between slow wave amplitude at a central site (C4) and whole brain cortical gray matter volume in children and adolescents over a wider age range. The general point of cortical gray matter volume being related to sleep delta amplitude is also supported by recent data showing a significant cross sectional relationship between these measures in adult alcoholics and controls (Colrain et al., In press).
Changes in the sleep EEG across adolescence were not restricted to the lower frequency bands in our subjects. As reported by others (Jenni and Carskadon, 2004, Jenni et al., 2005, Tarokh and Carskadon, 2010), we found a decrease in absolute alpha power in NREM and REM sleep from the initial visit to follow-up, however, as for lower frequency bands, the effect appeared to be most prominent over the occipital region. We also found a decrease in sigma power in REM sleep across the time period, most prominently at the occipital site. In NREM sleep, the decline in sigma power was only evident at the occipital site.
A limitation of our study was our method of rating sexual development. We used a self-report categorical pubertal development scale, which is not as accurate as physician report (Desmangles et al., 2006) and serves as a crude downstream estimate of secondary sex characteristics (Feinberg et al., 2006). Since the majority of participants did not show a change in pubertal rating from the initial to follow-up recording, we did not enter pubertal stage into analyses. In their longitudinal analysis, Feinberg and colleagues (Feinberg et al., 2006) separated the effects of age and Tanner stage and showed that the decline in NREM delta power is strongly related to age and not Tanner stage. However, more refined measures of changes in reproductive maturation are required to determine whether reproductive development plays a role in the sleep EEG changes across adolescence.
We focused our study on a small window of adolescence, a limitation in terms of being able to describe developmental changes longitudinally. However, our finding of significant changes even over this short 6-8 month time period is testament to the rapid changes that occur in EEG characteristics during adolescence. Whether these changes in the EEG are related to underlying brain structural changes in the same adolescents is currently under investigation.
Acknowledgments
We thank the adolescents and their parents for their participation. We thank Lindsay Hoffman, Amanda Wagstaff, and Benjamin Mayer for their excellent technical support. This work was supported by NIH grant R21-AA17320.
This work was supported by NIH grant R21-AA17320.
Ian Colrain is PI of a multi center clinical trial supported by ApniCure.
Footnotes
Disclosures: Other authors have no conflict of interest to report.
References
- Buchmann A, Ringli M, Kurth S, et al. EEG sleep slow-wave activity as a mirror of cortical maturation. Cereb Cortex. 2011;21:607–15. doi: 10.1093/cercor/bhq129. [DOI] [PubMed] [Google Scholar]
- Campbell IG, Darchia N, Khaw WY, Higgins LM, Feinberg I. Sleep EEG evidence of sex differences in adolescent brain maturation. Sleep. 2005;28:637–43. doi: 10.1093/sleep/28.5.637. [DOI] [PMC free article] [PubMed] [Google Scholar]
- Campbell IG, Feinberg I. Longitudinal trajectories of non-rapid eye movement delta and theta EEG as indicators of adolescent brain maturation. Proc Natl Acad Sci U S A. 2009;106:5177–80. doi: 10.1073/pnas.0812947106. [DOI] [PMC free article] [PubMed] [Google Scholar]
- Carskadon MA, Acebo C. A self-administered rating scale for pubertal development. J Adolesc Health. 1993;14:190–5. doi: 10.1016/1054-139x(93)90004-9. [DOI] [PubMed] [Google Scholar]
- Carskadon MA, Orav EJ, Dement WC. Evolution of sleep and daytime sleepiness in adolescents. New York: Raven Press; 1983. [Google Scholar]
- Clarke AR, Barry RJ, Mccarthy R, Selikowitz M. Age and sex effects in the EEG: development of the normal child. Clin Neurophysiol. 2001;112:806–14. doi: 10.1016/s1388-2457(01)00488-6. [DOI] [PubMed] [Google Scholar]
- Coble PA, Reynolds CF, Kupfer DJ, 3rd, Houck P. Electroencephalographic sleep of healthy children. Part II: Findings using automated delta and REM sleep measurement methods. Sleep. 1987;10:551–62. [PubMed] [Google Scholar]
- Colrain IM, Baker FC. Changes in sleep as a function of adolescent development. Neuropsychol Rev. 2011;21:5–21. doi: 10.1007/s11065-010-9155-5. [DOI] [PMC free article] [PubMed] [Google Scholar]
- Colrain IM, Sullivan EV, Rohlfing T, et al. Independent contributions of Cortical Gray matter, aging, sex and alcoholism to K-complex amplitude evoked during sleep. Sleep. doi: 10.5665/SLEEP.1050. In press. [DOI] [PMC free article] [PubMed] [Google Scholar]
- Colrain IM, Webster KE, Hirst G. The N550 component of the evoked K-complex: a modality non-specific response? J Sleep Res. 1999;8:273–80. doi: 10.1046/j.1365-2869.1999.00163.x. [DOI] [PubMed] [Google Scholar]
- Cote KA, De Lugt DR, Langley SD, Campbell KB. Scalp topography of the auditory evoked K-complex in stage 2 and slow wave sleep. J Sleep Res. 1999;8:263–72. doi: 10.1046/j.1365-2869.1999.00164.x. [DOI] [PubMed] [Google Scholar]
- Crockett L. Pubertal Development Scale: Pubertal categories Unpublished thesis Minneapolis. University of Minnesota; 1988. [Google Scholar]
- Dang-Vu TT, Desseilles M, Laureys S, et al. Cerebral correlates of delta waves during non-REM sleep revisited. Neuroimage. 2005;28:14–21. doi: 10.1016/j.neuroimage.2005.05.028. [DOI] [PubMed] [Google Scholar]
- Desmangles JC, Lappe JM, Lipaczewski G, Haynatzki G. Accuracy of pubertal Tanner staging self-reporting. J Pediatr Endocrinol Metab. 2006;19:213–21. doi: 10.1515/jpem.2006.19.3.213. [DOI] [PubMed] [Google Scholar]
- Feige B, Voderholzer U, Riemann D, Hohagen F, Berger M. Independent sleep EEG slow-wave and spindle band dynamics associated with 4 weeks of continuous application of short-half-life hypnotics in healthy subjects. Clin Neurophysiol. 1999;110:1965–74. doi: 10.1016/s1388-2457(99)00147-9. [DOI] [PubMed] [Google Scholar]
- Feinberg I. Schizophrenia: caused by a fault in programmed synaptic elimination during adolescence? J Psychiatr Res. 1982;17:319–34. doi: 10.1016/0022-3956(82)90038-3. [DOI] [PubMed] [Google Scholar]
- Feinberg I, Campbell IG. Sleep EEG changes during adolescence: an index of a fundamental brain reorganization. Brain Cogn. 2010;72:56–65. doi: 10.1016/j.bandc.2009.09.008. [DOI] [PubMed] [Google Scholar]
- Feinberg I, De Bie E, Davis NM, Campbell IG. Topographic Differences in the Adolescent Maturation of the Slow Wave EEG during NREM Sleep. Sleep. 2011;34:325–33. doi: 10.1093/sleep/34.3.325. [DOI] [PMC free article] [PubMed] [Google Scholar]
- Feinberg I, Higgins LM, Khaw WY, Campbell IG. The adolescent decline of NREM delta, an indicator of brain maturation, is linked to age and sex but not to pubertal stage. Am J Physiol Regul Integr Comp Physiol. 2006;291:R1724–9. doi: 10.1152/ajpregu.00293.2006. [DOI] [PMC free article] [PubMed] [Google Scholar]
- Feinberg I, Maloney T, Campbell IG. Effects of hypnotics on the sleep EEG of healthy young adults: new data and psychopharmacologic implications. J Psychiatr Res. 2000;34:423–38. doi: 10.1016/s0022-3956(00)00038-8. [DOI] [PubMed] [Google Scholar]
- Ferri R, Bruni O, Miano S, Terzano MG. Topographic mapping of the spectral components of the cyclic alternating pattern (CAP)..6(1):29-36. Sleep Med. 2005;6:29–36. doi: 10.1016/j.sleep.2004.06.010. [DOI] [PubMed] [Google Scholar]
- Finelli LA, Borbely AA, Achermann P. Functional topography of the human nonREM sleep electroencephalogram. Eur J Neurosci. 2001;13:2282–90. doi: 10.1046/j.0953-816x.2001.01597.x. [DOI] [PubMed] [Google Scholar]
- Gasser T, Jennen-Steinmetz C, Sroka L, Verleger R, Mocks J. Development of the EEG of school-age children and adolescents. II. Topography. Electroencephalogr Clin Neurophysiol. 1988a;69:100–9. doi: 10.1016/0013-4694(88)90205-2. [DOI] [PubMed] [Google Scholar]
- Gasser T, Verleger R, Bacher P, Sroka L. Development of the EEG of school-age children and adolescents. I. Analysis of band power. Electroencephalogr Clin Neurophysiol. 1988b;69:91–9. doi: 10.1016/0013-4694(88)90204-0. [DOI] [PubMed] [Google Scholar]
- Giedd JN, Blumenthal J, Jeffries NO, et al. Brain development during childhood and adolescence: a longitudinal MRI study. Nat Neurosci. 1999;2:861–3. doi: 10.1038/13158. [DOI] [PubMed] [Google Scholar]
- Jenni OG, Carskadon MA. Spectral analysis of the sleep electroencephalogram during adolescence. Sleep. 2004;27:774–83. [PubMed] [Google Scholar]
- Jenni OG, Van Reen E, Carskadon MA. Regional differences of the sleep electroencephalogram in adolescents. J Sleep Res. 2005;14:141–7. doi: 10.1111/j.1365-2869.2005.00449.x. [DOI] [PubMed] [Google Scholar]
- Karacan I, Anch M, Thornby JI, Okawa M, Williams RL. Longitudinal sleep patterns during pubertal growth: four-year follow up. Pediatr Res. 1975;9:842–6. doi: 10.1203/00006450-197511000-00008. [DOI] [PubMed] [Google Scholar]
- Kaufman J, Birmaher B, Brent D, et al. Schedule for Affective Disorders and Schizophrenia for School-Age Children-Present and Lifetime Version (K-SADS-PL): initial reliability and validity data. J Am Acad Child Adolesc Psychiatry. 1997;36:980–8. doi: 10.1097/00004583-199707000-00021. [DOI] [PubMed] [Google Scholar]
- Kurth S, Jenni OG, Riedner BA, Tononi G, Carskadon MA, Huber R. Characteristics of sleep slow waves in children and adolescents. Sleep. 2010a;33:475–80. doi: 10.1093/sleep/33.4.475. [DOI] [PMC free article] [PubMed] [Google Scholar]
- Kurth S, Ringli M, Geiger A, Lebourgeois M, Jenni OG, Huber R. Mapping of cortical activity in the first two decades of life: a high-density sleep electroencephalogram study. J Neurosci. 2010b;30:13211–9. doi: 10.1523/JNEUROSCI.2532-10.2010. [DOI] [PMC free article] [PubMed] [Google Scholar]
- Lebel C, Walker L, Leemans A, Phillips L, Beaulieu C. Microstructural maturation of the human brain from childhood to adulthood. Neuroimage. 2008;40:1044–55. doi: 10.1016/j.neuroimage.2007.12.053. [DOI] [PubMed] [Google Scholar]
- Massimini M, Huber R, Ferrarelli F, Hill S, Tononi G. The sleep slow oscillation as a traveling wave. J Neurosci. 2004;24:6862–70. doi: 10.1523/JNEUROSCI.1318-04.2004. [DOI] [PMC free article] [PubMed] [Google Scholar]
- Rechtschaffen A, Kales A. National Institutes of Health Publication No 204. Washington, DC, U.S: Government Printing Office; 1968. A Manual of Standardized Terminology, Techniques, and Scoring System for Sleep Stages of Human Subjects. [Google Scholar]
- Shaw P, Kabani NJ, Lerch JP, et al. Neurodevelopmental trajectories of the human cerebral cortex. J Neurosci. 2008;28:3586–94. doi: 10.1523/JNEUROSCI.5309-07.2008. [DOI] [PMC free article] [PubMed] [Google Scholar]
- Steriade M, Nunez A, Amzica F. A novel slow (< 1 Hz) oscillation of neocortical neurons in vivo: depolarizing and hyperpolarizing components. J Neurosci. 1993;13:3252–65. doi: 10.1523/JNEUROSCI.13-08-03252.1993. [DOI] [PMC free article] [PubMed] [Google Scholar]
- Tamnes CK, Ostby Y, Fjell AM, Westlye LT, Due-Tonnessen P, Walhovd KB. Brain maturation in adolescence and young adulthood: regional age-related changes in cortical thickness and white matter volume and microstructure. Cereb Cortex. 2009;20:534–48. doi: 10.1093/cercor/bhp118. [DOI] [PubMed] [Google Scholar]
- Tarokh L, Carskadon MA. Developmental changes in the human sleep EEG during early adolescence. Sleep. 2010;33:801–9. doi: 10.1093/sleep/33.6.801. [DOI] [PMC free article] [PubMed] [Google Scholar]
- Whitford TJ, Rennie CJ, Grieve SM, Clark CR, Gordon E, Williams LM. Brain maturation in adolescence: concurrent changes in neuroanatomy and neurophysiology. Hum Brain Mapp. 2007;28:228–37. doi: 10.1002/hbm.20273. [DOI] [PMC free article] [PubMed] [Google Scholar]