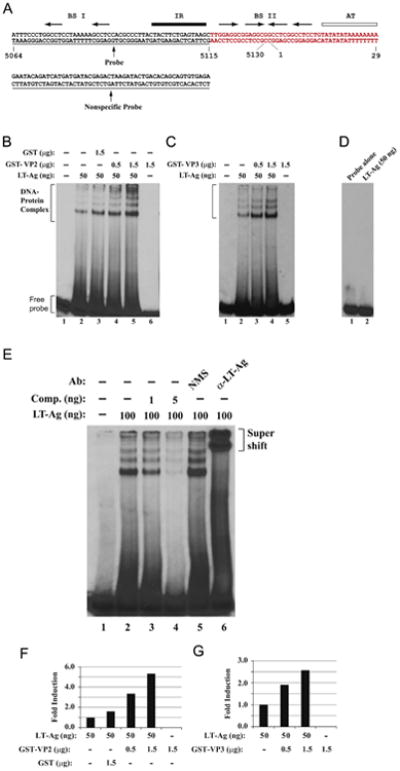
Fig. 4.

JCV VP2 and VP3 enhance LT-Ag binding to Ori DNA sequences. (A) Double-stranded nucleotide structure of the putative JCV core origin of replication. Arrows indicate the positions of JCV LT-Ag recognition sites. The positions of binding sites I (BS I) and II (BSII) are also indicated. The inverted repeat region (IR) is underlined and the A+T-rich tract (AT) is identified by an open bar. Position of the probe used in the band shift assays is marked by a thin line which encompasses the nucleotides of 5064–5115 (JCV Mad-1, NC_001699). (B and C) Band shift assays. The double-stranded nucleotide encompassing nt 5064–5115 Mad-1 was end-labeled with γ-[32P]-dATP (40,000 cpm/lane) and was incubated with different amount and combinations of the baculovirus-produced JCV LT-Ag, and bacterially produced GST or GST-VP2 or GST-VP3 as indicated on the respective figures. DNA-protein complexes were then separated on a 6% native polyacrylamide gel (PAGE) and visualized by autoradiography. In lane 1, probe alone was loaded on the gel. (D) Incubation of LT-Ag with a nonspecific DNA probe. In parallel to Fig. 4B, a γ-[32P]-ATP-labeled double stranded nonspecific DNA probe (see the sequence for it on panel A) was incubated with baculovirus-produced JCV LT-Ag (50 ng/lane) and formed DNA-protein complexes, if any, were then separated on a 6% native polyacrylamide gel (PAGE) and visualized by autoradiography. (E) Competitive band shift and antibody super-shift assay. Labeled probe was incubated with fixed amount of LT-Ag (100 ng/lane) as indicated plus with different amounts of unlabeled oligonucleotide (Comp.= Competitor) (1 ng and 5 ng, lanes 3 and 4 respectively). In addition, the reaction mixture was also incubated with either normal mouse serum (NMS) (2 μg) or α-LT-Ag (2 μg, Ab-2) antibody as indicated. In lane 1, probe alone was loaded on the gel. DNA-protein-antibody complexes were separated on a 6% PAGE under non-denaturing conditions and analyzed by autoradiography. (F and G) Quantitative analysis of the “DNA-protein complexes” on panels B and C by a semi-quantitative densitometry method using ImageJ program (NIH) and bar graph presentation of the results in arbitrary units in fold. The DNA binding efficiency of LT-Ag in the presence of VP2 or VP3 was expressed relative to that of LT-Ag binding to Ori alone.
