Abstract
We imaged the microvascular network in both the retina and the choroid in an albino rat eye using photoacoustic ophthalmoscopy guided by optical coherence tomography. Relying on optical absorption and ultrasonic detection, photoacoustic ophthalmoscopy can image both retinal and choroidal vessel networks with high contrast.
Keywords: photoacoustic microscopy, optical coherence tomography, ophthalmology
1. Introduction
Choroidal vascular circulation is critical to maintaining a healthy physiological environment to support normal vision. Dysfunctions in the choroidal vascular system may lead to, for example, glaucoma and choroidal neovascularisation (CNV), and eventually, macular degeneration. Noninvasive imaging can provide insight into the development of choroidal vascular dysfunctions and may lead to better understanding and treatment of several blinding diseases.
Existing technologies that have the capability to image choroidal vascular include fluorescein angiography (FA) [1], indocyanine green angiography (ICGA) [2,3], and several variations of optical coherence tomography [4–6]. FA and ICGA both require administering extrinsic contrast agents and then waiting for the agents to reach the chorioretinal circulation system. FA typically uses an excitation optical wavelength range of 460–490 nm and detects the emission wavelength of 520–530 nm. In ICGA, the excitation wavelength is around 800 nm and the detection wavelength is around 830 nm. When imaging the choroidal vascular system, ICGA is advantageous over FA because of its better penetration depth of near infrared (NIR) light. The limitations of FA and ICGA are that they cannot be used as screening tools and they can only image the anatomy of the chorioretinal vascular.
Optical coherence tomography (OCT) can image chorioretinal vascular system bases on the detected phase variations caused by blood flow. The optical micro-angiography (OMAG) reported by An et al. [6] has demonstrated superior image quality and sensitivity in imaging the microcirculations in human eyes for both anatomic morphology and functional blood flow; however the functional imaging capability of OMAG is limited to properties that are associated with optical scattering. Measuring the optical absorption properties, which are strongly correlated with, for example, hemoglobin oxygen saturation, are still beyond the reach of existing OCT technologies.
Here, we report on imaging the optical absorption properties of the chorioretinal microvascular network using photoacoustic ophthalmoscopy (PAOM) guided by a spectral-domain OCT (SD-OCT) [7].
2. Methods and materials
PAOM measures the optical absorption properties in the retina through the photoacoustic (PA) effect. When short laser pulses irradiate biological tissue, optical energy is absorbed by tissue pigments such as melanin and hemoglobin and converted to heat (causing a milli-degree temperature rise). Then, thermo-elastic expansions occur, which lead to the vibration of local tissue, and, thus, the generation of wideband ultrasonic waves. Such ultrasonic waves (referred to as PA waves) are detected by an ultrasonic detector to form an image according to the amplitudes and time-of-arrival of the PA waves to the ultrasonic detector. Because the amplitude of the induced PA wave is proportional to the optical energy deposition (specific absorption), the PA image reflects internal optical absorption distribution.
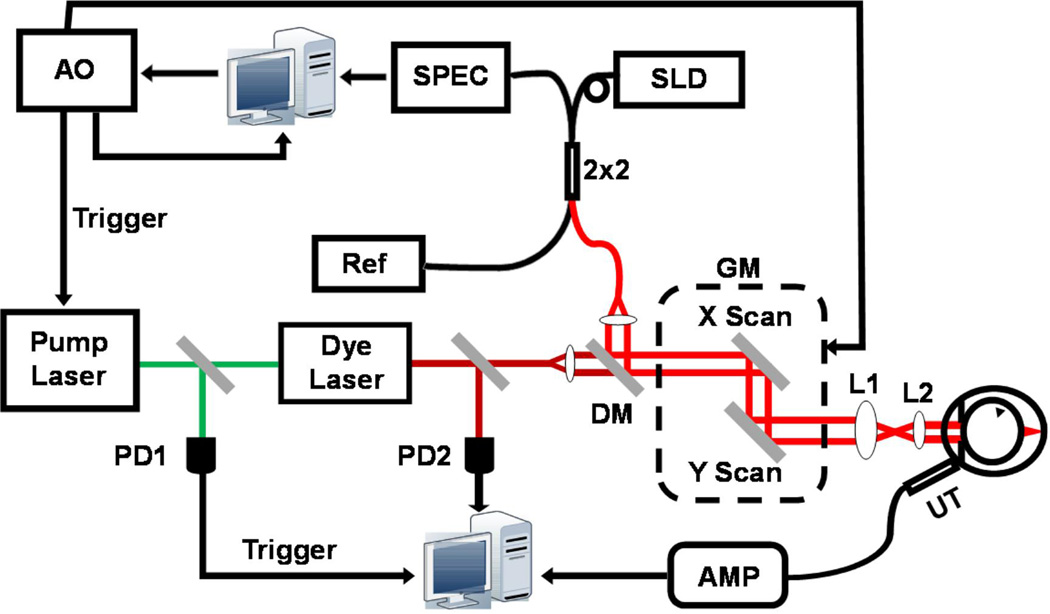
PAOM was developed from laser-scanning optical-resolution photoacoustic microscopy [8], which was further integrated with an SD-OCT [9]. Figure 1a shows a schematic of the OCT-guided PAOM. The illumination source of PAOM was a tunable dye laser (Cobra, Sirah Laser and Plasmatchnik GmbH; output optical wavelength: 578 nm) pumped by an Nd:YLF laser (IS8II-E, Edge-Wave GmbH; pulse duration: 6 ns; repetition rate: 3 kHz). The light source of SD-OCT was a broadband super-luminescent diode (SLD) (IPSDD0804, InPhenix; center wavelength λ0: 840 nm; 3-dB bandwidth Δλ: 50 nm). The PAOM illumination laser pulse energy was 0.04 µJ and the SD-OCT probing light power was 0.8 mW. The two beams were combined by a dichroic mirror and scanned by a 2D galvanometer (QS-10, Nutfield Technology), and the beam diameters were reduced from 2 mm to 0.4 mm by a telescope-type optical assembly. Both PAOM and SD-OCT were synchronized by an analogue output board (PCI-6731, National Instruments) and worked at 3-kHz A-line rate, in which the total data acquisition time was 18 seconds.
Figure 1.
Schematic of the in vivo experimental system. PD: photodiode; DM: dichroic mirror; GM: 2D galvanometer; AMP: amplifier; UT: ultrasonic transducer; AO: analogous output board; SLD: super-luminescent laser diode; SPEC: home-built spectrometer; Ref: OCT reference arm; 2×2: 2×2 single-mode fiber coupler. L1: relay lens; L2: objective lens.
The induced PA waves were detected by a custom-built, unfocused needle ultrasonic detector (central frequency 35 MHz; bandwidth: 50%; active element size: 1×1 mm2) and were amplified by 40 dB before being digitized and stored in a computer. The ultrasonic detector was placed in contact with the eye lid coupled by medical-grade ultrasound gel for better acoustic coupling. A photodiode PD1 sampled the energy of each laser pulse to compensate for the PA signal amplitude fluctuation caused by the illumination pulse energy instability. In SD-OCT, a home-built, high-speed spectrometer was used [10] for signal detection.
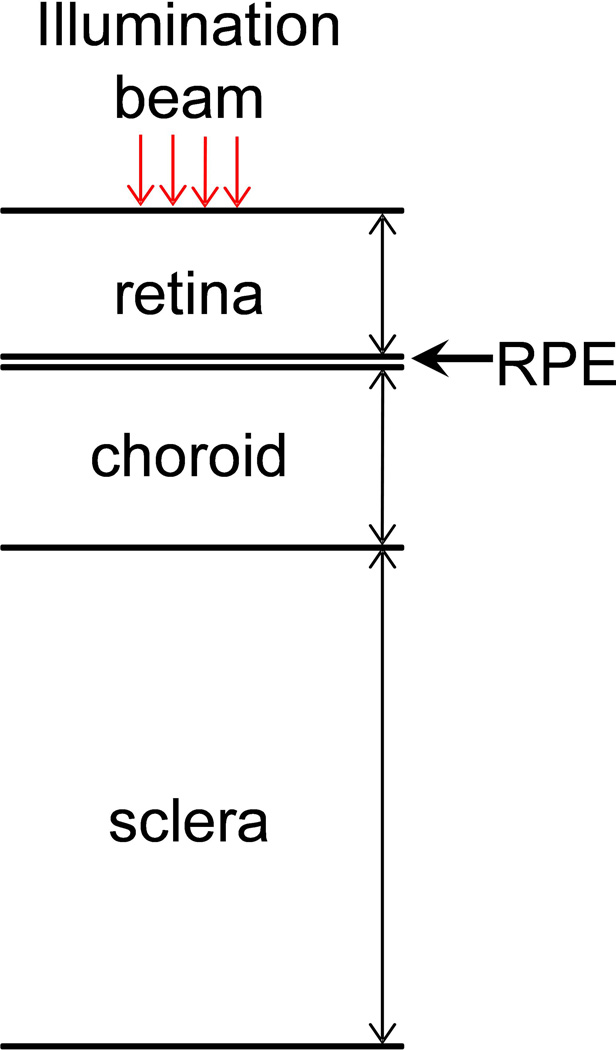
Figure 1b is a schematic of the layered anatomic structure of the back of the eye. When illumination beams pass through the cornea and ocular lens, they will naturally focus onto the back of the eye, which consists of multiple layers. The top layer is the retina, which includes retinal vessels, neuron cells, and photoreceptor cells. Below the photoreceptor cell layer is the retinal pigmented epithelium (RPE) layer, which supports the photoreceptors and may contain a high concentration of pigments such as melanin; however, albino rats lack RPE melanin. The choroids contains a high-density vessel network to maintain normal vision functions, and the sclera is a hard layer that supports the whole eyeball. In our study, both the PAOM and SD-OCT can reach the choroid layer [11].
In the in vivo rat retinal imaging, the PAOM and the SD-OCT have a comparable lateral resolution of around 20 µm [7]. The axial resolution of PAOM is 23 µm, which is primarily determined by the ultrasonic bandwidth. The axial resolution of the SD-OCT is 6 µm, which is primarily determined by the bandwidth of the light source. To acquire a full-field fundus image, the scan angle was 34°, which covered an area of approximately 3.0×3.0 mm2 on the rat retina. To ensure ocular laser safety, the PAOM laser pulse energy was set below 40 nJ per pulse. A detailed derivation of the conformance to the ANSI laser safety standard [12] can be found in [7,13].
In this study, an albino rat (300-g Sprague Dawley rat, Harlan Laboratory) eye was imaged. The rat was anesthetized and kept motionless by a mixture of 1.5% isoflurane and oxygen at a flow rate of 1.5 liter/minute. During imaging, the animal was placed in a homemade animal holder. We applied 0.5% Tetracaine Hydrochloride ophthalmic solution for local anesthesia and applied 1% Tropicamide ophthalmic solution for pupil dilation; as a result, no serious motion artifacts were observed when data acquisition was completed between two breathing events. All experiments were performed in compliance with the laboratory animal protocol approved by the Animal Care and Use Committee of Northwestern University.
The PAOM data were processed with the following procedure: (1) The acquired three-dimensional raw data was processed by removing the DC components and then applying Hilbert transform on each A-line; (2) The max-amplitude-projection was used to generate the displayed two-dimensional figures; (3) All grey scales were normalized from 0 to 1 with linear distribution.
3. Results and discussions
Figure 2 shows the in vivo PAOM images of the chorioretinal vasculature. The signal-to-noise ratio (SNR) is over 40 dB; as a result, the vessels can be distinguished easily from the background. Although PAOM acquires volumetric data of the retina, only two-dimensional, maximum-amplitude-projection images are shown here. Figure 2a is the PAOM image of both the retinal and choroidal vessels that are projected onto the same 2D image. There are dual circulation systems in the rodent retina: the retinal vessels supply the nerve fiber layer and the external aspect of the inner nuclear layer; and the choroidal vessels support the rest of the retina [14]. In rodent eyes, the optic disk is usually located at the center of the posterior orbit. During imaging, the optic disk was intentionally placed off-centred within the field-of-view in order to emphasize the choroidal vessel in regions where the retinal vessel density is low. As all the retinal arteries come out from the optic disk and the retinal veins return to the optic disk, the retinal vessels demonstrate a star-shaped architecture [15,16], as can be seen in Figure 2a.
Figure 2.
PAOM images of the chorioretinal vasculature. (a) Complete chorioretinal vessel network image; (b) segmented retinal vessels; (c) segmented chorodial vessels. Bar: 500 µm
We segmented the retinal vessel layer from the rest of the retinal layers in the PAOM volumetric data and visualized them independently. Based on the simultaneously acquired SD-OCT cross-sectional images, the distance from the retinal vessel layer to the choroid is around 200 µm [17]. Because the axial resolution of PAOM is 23 µm, the retinal and choroidal vessels can be well resolved along the axial direction. The segmented retinal vessels and choroidal projection images are shown in Figure 2b and Figure 2c, respectively. Beside the star-shaped architecture, tiny retinal vessels, as highlighted in Figure 2b, occupy only a single pixel in the PAOM image, which suggests a vessel diameter around 15–20 µm. In Figure 2c, a much higher vessel density is observed compared with Figure 2b. Note that many of the vessels in the choroidal network appear to have much larger diameters than those of the retinal vessels. Such observation corresponds well with the known anatomy of the rodent ocular circulation [14,18].
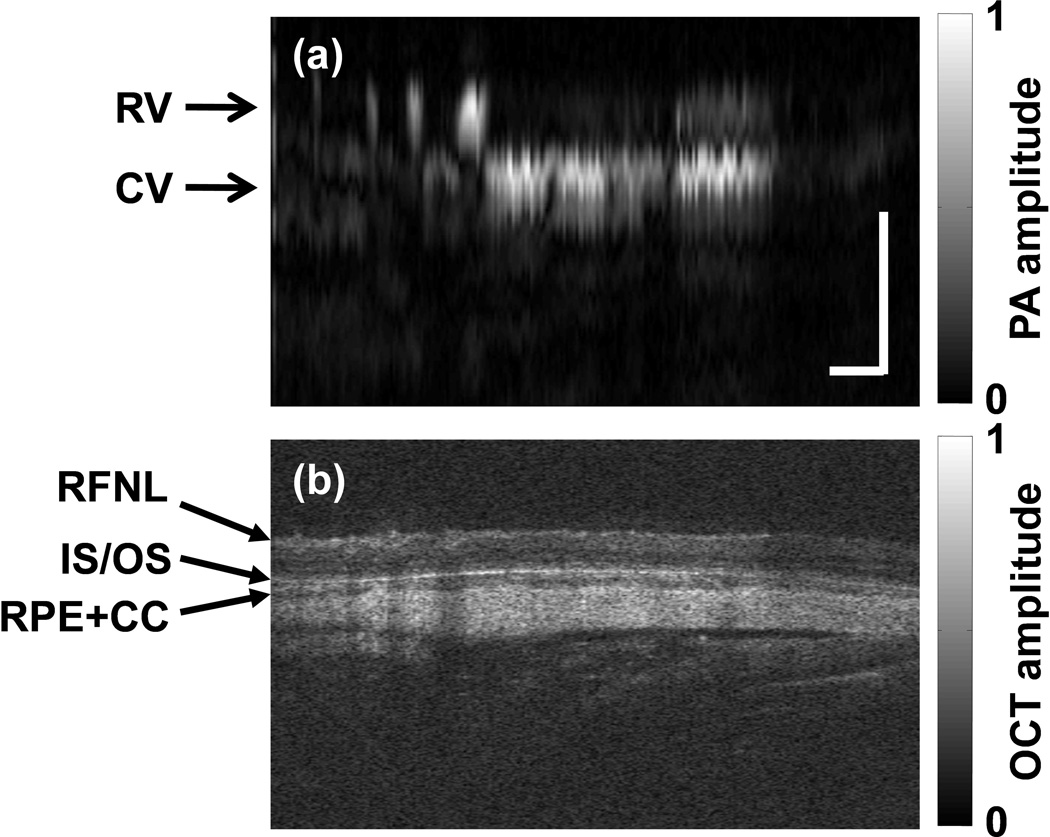
Figure 3 shows the simultaneously acquired B-scan images (at the location as marked in Figure 2a) by PAOM (Figure 3a) and SD-OCT (Figure 3b). In the PAOM B-scan image, only two vessel layers, retinal vessels (RV) and choroidal vessels (CV), can be observed. In comparison, the SD-OCT B-scan image reveals much more information of the retinal anatomic layers, including the retinal nerve fiber layer (RFNL), the photoreceptor inner and outer segment junction (IS/OS), the retinal pigmented epithelium (RPE), and the choroid layer. Two factors contribute to the different observations between PAOM and SD-OCT B-scan images. First, as reported previously, the axial resolution of PAOM (23 µm) is much worse than that of the SD-OCT (6 µm), therefore, the finer retinal structures were not resolved by PAOM. Second, although the RFNL and IS/OS induced strong optical back-scattering signals in SD-OCT due to their differences in refractive indexes and scattering coefficients, their optical absorption are very low and induced no detectable signals in PAOM.
Figure 3.
Comparison of PAOM and SD-OCT B-scan images. (a) The PAOM B-scan at the location marked by the dashed line in Figure 2a; (b) the SD-OCT B-scan image at the same location. RV: retinal vessel; CV: choroidal vessel; RNFL: retinal nerve fiber layer; IS/OS: photoreceptor inner and outer segment junction; RPE: retinal pigment epithelium; CC: choriocapillaris. Bar: 250µm
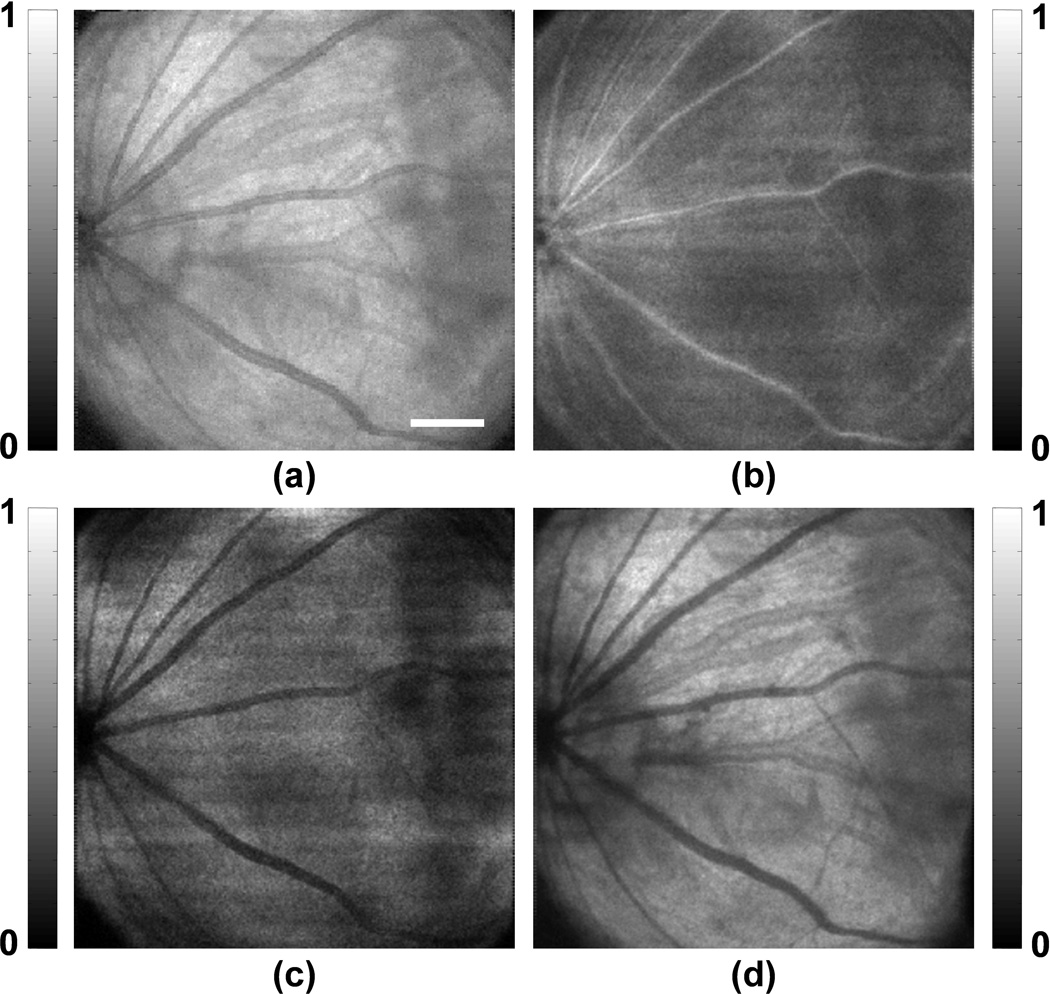
Within the choroidal layer, however, PAOM reveals much richer features of the vasculature than SD-OCT due to the optical absorption contrast mechanism and comparable lateral resolution with SD-OCT. Figure 4 shows the SD-OCT fundus image. Figure 4a is the mean-intensity-projection fundus image of the complete OCT volume. The retinal vessels appear darker than a homogeneous background because fewer back-scattered photons were detected from the vessels than the vessel-less regions. In comparison, the retinal vessels generated a much stronger signal than the background in PAOM. Due to lack of optical contrast in SD-OCT, the tiny vessels, as highlighted in Figure 2b, are not observable in the Figure 4b, where only the retinal layers around the RNFL are projected. The segmented SD-OCT image of the IS/OS is shown in Figure 4c, where only the shadows created by the retinal vessels on a “uniform” reflective background can be observed. When comparing the segmented PAOM with SD-OCT images of the choroid, both modalities have shadows from the retinal vessels; however, the SD-OCT image (Figure 4d) only shows a few larger vessels rather than a densely packed vessel network, as can be seen from Figure 2c.
Figure 4.
SD-OCT fundus images. (a) image of the complete imaged retina; (b) segmented image of the RNFL and adjacent layer; (c) segmented image of the IS/OS and adjacent layer; (d) segmented image of the RPE and choroid. Bar: 500µm
The experimental results clearly demonstrate the contrast advantage of PAOM in visualizing the chorioretinal vessel network. However, when imaging the choroidal vessels, current PAOM is limited to albino animals because the illumination light within the visible spectrum range cannot penetrate through the retinal pigment epithelium (RPE), where there is a high melanin concentration, to generate sufficient PA signal from choroidal vessel for imaging. In contrast, existing Doppler-based SD-OCT can operate within near infrared (NIR) spectral range (having much improved penetration depth) to image pigmented eyes.
One possible solution for using PAOM to image choroidal vasculature in pigmented eyes is to use NIR illumination. The challenge comes from the greatly reduced PA signal amplitude. According to the molar extinction coefficients of oxyhemoglobin and deoxyhemoglobin, the optical absorption of whole blood in the visible spectral range can be a few orders of magnitude stronger than that in the NIR spectral range [19]. As a result, the single-to-noise ratio (SNR) in PAOM becomes an issue, and an ultrasonic detector with sensitivity several times higher is required in the further experiment. On the other hand, laser pulse energy that is about six times higher can be tolerated in the NIR spectral range than in the visible spectral range [12], which may improve the SNR of PAOM to some extent. Another alternative is to take advantage of a contrast agent, such as ICG, to improve the SNR in PAOM when using NIR illumination. Although extrinsic contrast agents need to be administered, ICG-based PAOM has the potential to image choroidal vasculature in pigmented eyes, whereas no other existing imaging technology can.
4. Conclusion
In summary, we have shown the strong optical absorption-based imaging contrast in PAOM in albino rat eyes in vivo. Such a contrast advantage is further demonstrated by imaging the complete chorioretinal vasculature, including both well-resolved retinal and choroidal vessels. The detailed features of the chorioretinal vessel network are not obvious in the simultaneously acquired SD-OCT images.
Acknowledgement
We thank Dr. Dennis P. Han and Dr. Janice Burke for fruitful discussions. We also thank Wei Song and Dr. Fengli Gao for experimental assistance. This work is supported in part by the NIH 1RC4EY021357, the NSF CAREER CBET-1055379, the Shaw Scientist Award, and the Juvenile Diabetes Research Foundation Innovative Grant No. 5-2009-489.
References
- 1.Holz FG, Spaide RF. Medical retina. Springer; 2010. [Google Scholar]
- 2.Stanga PE, Lim JI, Hamilton P. Indocyanine green angiography in chorioretinal diseases: Indications and interpretation - An evidence-based update. Ophthalmology. 2003;110(1):15–21. doi: 10.1016/s0161-6420(02)01563-4. [DOI] [PubMed] [Google Scholar]
- 3.Coscas G, Coscas F, Souied E, Soubrane G. Clinical typical patterns in AMD: FA, ICG-A and OCT. Journal Francais D Ophtalmologie. 2007;30:S34–S54. [Google Scholar]
- 4.Makita S, Hong Y, Yamanari M, Yatagai T, Yasuno Y. Optical coherence angiography. Optics Express. 2006;14(17):7821–7840. doi: 10.1364/oe.14.007821. [DOI] [PubMed] [Google Scholar]
- 5.Hong Y, Makita S, Yamanari M, Miura M, Kim S, Yatagai T, Yasuno Y. Three-dimensional visualization of choroidal vessels by using standard and ultra-high resolution scattering optical coherence angiography. Optics Express. 2007;15(12):7538–7550. doi: 10.1364/oe.15.007538. [DOI] [PubMed] [Google Scholar]
- 6.An L, Wang RK. In vivo volumetric imaging of vascular perfusion within human retina and choroids with optical micro-angiography. Optics Express. 2008;16(15):11438–11452. doi: 10.1364/oe.16.011438. [DOI] [PubMed] [Google Scholar]
- 7.Jiao SL, Jiang MS, Hu JM, Fawzi A, Zhou QF, Shung KK, Puliafito CA, Zhang HF. Photoacoustic ophthalmoscopy for in vivo retinal imaging. Optics Express. 2010;18(4):3967–3972. doi: 10.1364/OE.18.003967. [DOI] [PMC free article] [PubMed] [Google Scholar]
- 8.Xie ZX, Jiao SL, Zhang HF, Puliafito CA. Laser-scanning opticalresolution photoacoustic microscopy. Optics Letters. 2009;34(12):1771–1773. doi: 10.1364/ol.34.001771. [DOI] [PubMed] [Google Scholar]
- 9.Jiao SL, Xie ZX, Zhang HF, Puliafito CA. Simultaneous multimodal imaging with integrated photoacoustic microscopy and optical coherence tomography. Optics Letters. 2009;34(19):2961–2963. doi: 10.1364/OL.34.002961. [DOI] [PMC free article] [PubMed] [Google Scholar]
- 10.Ruggeri M, Webbe H, Jiao SL, Gregori G, Jockovich ME, Hackam A, Duan YL, Puliafito CA. In vivo three-dimensional high-resolution imaging of rodent retina with spectral-domain optical coherence tomography. Investigative Ophthalmology & Visual Science. 2007;48(4):1808–1814. doi: 10.1167/iovs.06-0815. [DOI] [PubMed] [Google Scholar]
- 11.Ruggeri M, Webbe H, Jiao SL, Gregori G, Jockovich ME, Hackam A, Duan YL, Puliafito CA. In vivo three-dimensional high-resolution imaging of rodent retina with spectral-domain optical coherence tomography. Investigative Ophthalmology & Visual Science. 2007;48(4):1808–1814. doi: 10.1167/iovs.06-0815. [DOI] [PubMed] [Google Scholar]
- 12.New York, NY: American National Standards Institute Inc.; 2007. American National Standard for Safe Use of Lasers ANSI Z136.1-2007. [Google Scholar]
- 13.Hu S, Rao B, Maslov K, Wang LV. Label-free photoacoustic ophthalmic angiography. Optics Letters. 2010;35(1):1–3. doi: 10.1364/OL.35.000001. [DOI] [PMC free article] [PubMed] [Google Scholar]
- 14.Smith RS, editor. Systematic Evaluation of the Mouse Eye Anatomy Pathology, and Biomethods. CRC Press; 2002. [Google Scholar]
- 15.Paques M, Sirnonutti M, Roux MJ, Picaud S, Levavasseur E, Bellman C, Sahel JA. High resolution fundus imaging by confocal scanning laser ophthalmoscopy in the mouse. Vision Research. 2006;46(8-9):1336–1345. doi: 10.1016/j.visres.2005.09.037. [DOI] [PubMed] [Google Scholar]
- 16.Seeliger MW, Beck SC, Pereyra-Munoz N, Dangel S, Tsai JY, Luhmann UFO, van de Pavert SA, Wijnholds J, Samardzija M, Wenzel A, Zrenner E, Narfstrom K, Fahl E, Tanimoto N, Acar N, Tonagel F. In vivo confocal imaging of the retina in animal models using scanning laser ophthalmoscopy. Vision Research. 2005;45(28):3512–3519. doi: 10.1016/j.visres.2005.08.014. [DOI] [PubMed] [Google Scholar]
- 17.Srinivasan VJ, Ko TH, Wojtkowski M, Carvalho M, Clermont A, Bursell SE, Song QH, Lem J, Duker JS, Schuman JS, Fujimoto JG. Noninvasive volumetric Imaging and morphometry of the rodent retina with high-speed, ultrahigh-resolution optical coherence tomography. Investigative Ophthalmology & Visual Science. 2006;47(12):5522–5528. doi: 10.1167/iovs.06-0195. [DOI] [PMC free article] [PubMed] [Google Scholar]
- 18.Lens A, Nemeth SC, Ledford JK. Ocular Anatomy and Physiology. SLACK Incorporated; 2007. [Google Scholar]
- 19.Scott Prahl, Optical Absorption of Hemoglobin. http://omlc.ogi.edu/spectra. [Google Scholar]


