Abstract
In contrast to most glomerular diseases, the injury pattern in focal segmental glomerulosclerosis (FSGS) is highly heterogeneous, even though podocytes are genetically identical and exposed to the same environmental factors. To understand changes in individual podocytes, we generated and analyzed a stochastic multicolor Cre-reporter, encoding four fluorescent proteins. In these animals podocytes were randomly labeled allowing individual cells and their foot processes to be distinguished. In healthy animals podocyte size and structure showed little cell to cell variability. In the doxorubicin-induced FSGS model, fluorescent-labeled glomerular podocyte numbers decreased and fluorescent cells could be recovered from the urine. The size of the remaining podocytes showed a high degree of heterogeneity, some cells remained small, while others enlarged. Both enlarged and non-enlarged podocytes showed alterations in their foot process morphology. Thus, by the virtue of a multicolor cre-reporter, individual podocytes could be viewed in real time at a cellular resolution indicating a heterogeneous podocyte injury response during the pathogenesis of FSGS.
Introduction
Our kidneys filter approximately 180 liters of plasma every day. The glomerular filtration barrier has 3 layers; fenestrated endothelial cells, basement membrane and the foot processes of glomerular epithelial cells 1. The highly organized podocyte foot process architecture is critical for maintaining the filtration barrier 2. Foot process effacement or widening of the foot processes are almost universally observed in patients with nephrotic syndrome 2, therefore it is considered to be the “diagnostic lesion” of nephrotic syndrome. The highly dynamic podocyte slit diaphragm and associated actin cytoskeleton are responsible for maintaining the foot process architecture 3. Genetic mutations of different actin cytoskeletal and slit-associated proteins cause nephrotic syndrome and foot process effacement in humans. Most of these mutations show histopathological lesions consistent with focal segmental glomerulosclerotic (FSGS) 4,5. FSGS, however most commonly occurs secondary to glomerular hyperfiltration in the setting of low nephron number, obesity, viral infection (HIV) or medication use 6. Podocyte injury, apoptosis and loss of functional podocytes are thought to be the root cause of FSGS. In addition to podocyte apoptosis, foot process effacement and hypertrophy are also shown to play an important role in the pathogenesis of FSGS. At present it is not clear whether or not podocyte death, foot process effacement and hypertrophy are coupled mechanisms.
As the name indicates, glomerular lesions are heterogeneous in FSGS; only certain glomerular segments of some glomeruli are affected. The focal and segmental lesions are in striking contrast with other disease entities including diabetes, IgAN, membranous nephropathy where cells and glomeruli are similarly affected. The cause and the mechanism of disease heterogeneity are not well understood. The cell-to-cell and glomerulus-to-glomerulus heterogeneity are even more puzzling as coding mutations, viral infections, obesity or drugs should influence all cells similarly 7. With the exception of electron microscopy (EM) the present methods do not really allow us to distinguish individual podocytes. On the other hand, electron microscopy is time consuming, tedious, only a few cells and glomeruli can be studied and requires the use of harsh fixatives. To understand events occurring in individual podocytes, here we developed a podocyte specific stochastic multicolor reporter, which allowed us to monitor individual cells. We found that in healthy mice podocyte architecture is highly organized, showing little cell-to cell variation. Podocytes exhibited very heterogeneous structural changes following injury. This heterogeneous injury and adaptation might explain the development of heterogeneous histological pattern of FSGS. Defining pathways that control this heterogeneity will likely be important for the understanding of focal segmental glomerulosclerosis. This new mouse model and imaging modality will help us to achieve this.
Results
Generation and characterization of podocyte specific stochastic multicolor reporter
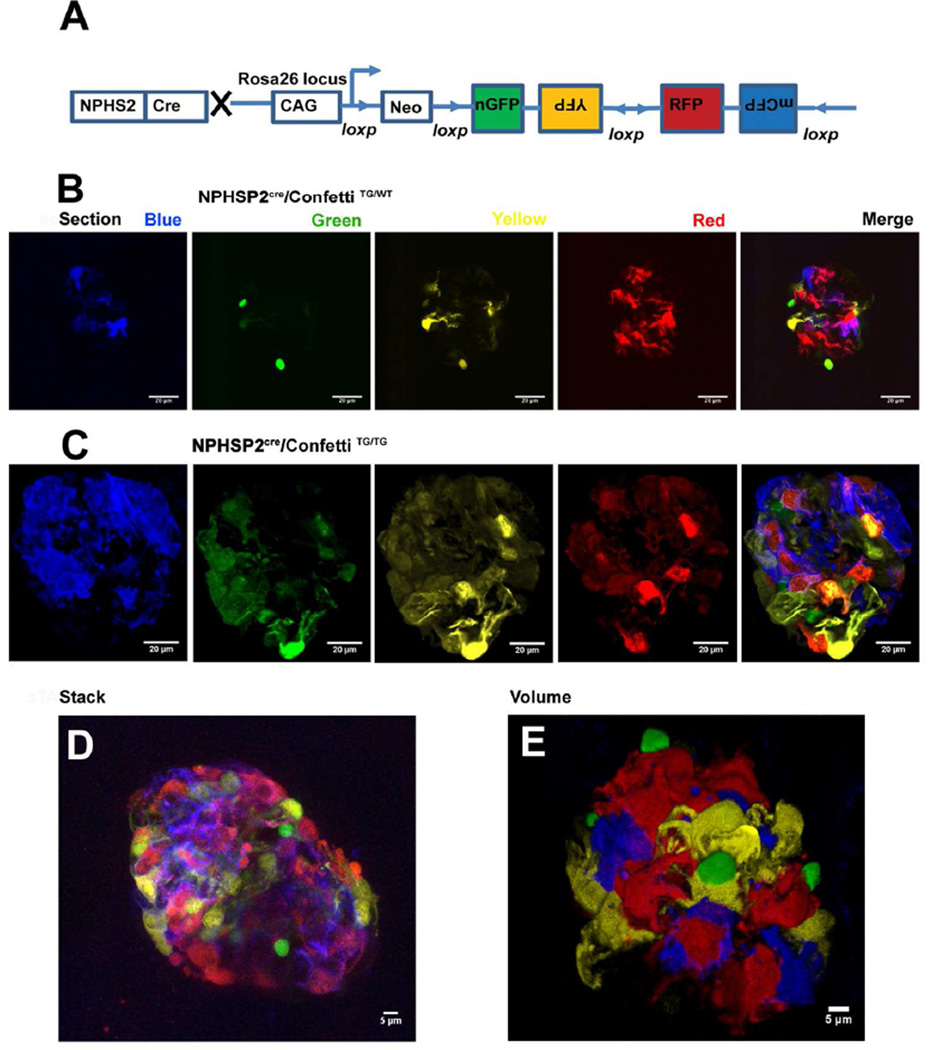
Understanding local changes and cell-cell interaction in podocytes requires visualization of individual cells and individual foot processes. As cultured podocytes show significant differences when compared to their native state, it would be desirable to characterize them in vivo 8. Here we generated a stochastic multicolor reporter mouse line by intercrossing the NPHS2Cre 9 (podocincre) line with a reporter strain that contained four different fluorescent reporters 10; cytoplasmic targeted yellow fluorescent protein (cYFP), cytoplasmic targeted red fluorescent protein (cRFP), membrane targeted cyan fluorescent protein (mCFP) and nuclear targeted green fluorescent protein (nGFP) (Fig 1A). Fluorescent proteins are expressed from the Rosa26 locus. The construct consists of the strong CAGG promoter, the LoxP-flanked neomycin resistance cassette, which serves as a transcriptional roadblock, and the original Brainbow-2.1 cassette. After Cre-mediated recombination, the roadblock is removed and the fluorescent marker proteins are stochastically placed under the control of the CAGG promoter. As the fluorescent proteins were cloned in reverse orientation, only one sequence per cell will be in the correct orientation to express. Therefore in heterozygous Confetti animals (NPHSP2Cre/ConfettiTG/WT) each cell where recombination took place will express only one fluorescent protein. As recombination is random, neighboring cells can be identified with high precision 11. First, we analyzed images from 6-week-old control male NPHSP2Cre/ConfettiTG/WT mice. As shown in figure 1B, the Cre-mediated recombination efficiency was relatively high and the model allowed for distinction of individual podocytes. As the spectra of GFP and YFP overlap, we focused on distinguishing these cells based on their nuclear vs. cytoplasmic location of the fluorescent signal.
Figure 1. Generation of podocyte-specific stochastic multicolor reporter mice.
(A) The experimental approach for the generation of podocyte specific multicolor reporter mice. The brainbow-2.1 construct encoding four fluorescent proteins driven by the strong CAG promoter was inserted into the Rosa26 locus. Upon Cre recombination, the Neomycin (Neo) cassette is removed and the multicolor construct recombines randomly to result in four possible outcomes with different fluorescent proteins being expressed. Representative 2-D images of a glomerular cross-section from a healthy six-week old male (B) NPHS2Cre/R26R-ConfettiTG/WT (C) NPHS2Cre/R26R-ConfettiTG/TG mice, showing randomly labeled podocyte cell bodies (red or yellow), podocyte cell nuclei (green) or podocyte cell membranes (blue). (D) Representative z-stack projection reconstruction of all colors from NPHS2Cre/R26R-ConfettiTG/TG mouse. (E) Representative 3-D volume (Volocity-based) reconstruction of all four color channels of the NPHS2Cre /R26R-ConfettiTG/WT mice.
The percent of fluorescent labeled podocytes was similar in the NPHSP2Cre/ConfettiTG/TG homozygous mice and in the NPHSP2Cre/ConfettiTG/WT mice, however in the homozygous mice we also observed double flourophore labeled cells (Fig 1C). Using z-stack images obtained with the Leica SP5 confocal microscope, and freshly removed kidneys, we generated stacked reconstruction images of the glomeruli (Fig 1D). Volocity Software-based volume reconstruction gave the best overview of the glomerulus (Fig 1E). Furthermore the complete 3-D reconstruction also helped to fully distinguish individual cells and foot processes. The YFP and RFP gave the strongest fluorescence and also allowed the most comparable visualization of cell architecture including foot processes and their interactions. Mice with a single Confetti allele, allowed for much better spectral discrimination of adjacent cells. In double transgenic animals adjacent podocytes sometimes labeled with the same fluorescent proteins making them difficult to distinguish (Fig 1C). In summary, we found that the volume reconstruction method of YFP and RFP from a single allele allowed the best discrimination of the podocyte architecture (Fig 1E).
Healthy podocytes display little architectural variability
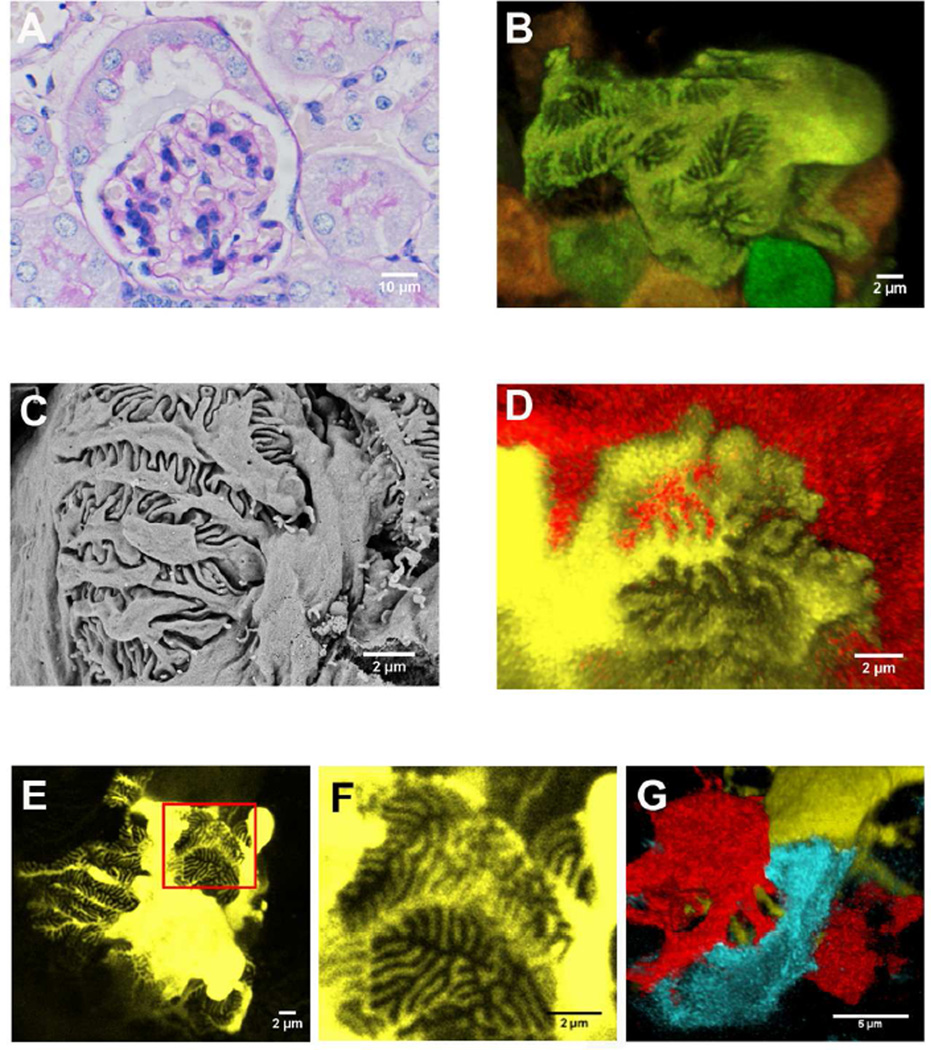
We compared established imaging methods with our new fluorescent method using control NPHSP2Cre/ConfettiTG/WT mouse. PAS stained light microscope (Fig 2A), confocal fluorescent microscope (Fig 2B, D-G) and scanning electron microscope (Fig 2C) as shown side by side. Pictures obtained with the new confetti fluorescent imaging method showed structural details that were similar to scanning electron microscope images (Fig 2C). The fluorescent detection method however, was far superior in its ability to image entire glomeruli, thereby allowing the detection of podocyte heterogeneity and cell-cell interactions. As expected, individual podocyte foot processes interacted only with adjacent podocyte foot processes, and we never observed interdigitation between processes originating from the same cell body (Fig 2D-F). The images also seem to indicate that podocyte processes follow a monopodial branching pattern in the primary, secondary and tertiary branches. The branching is likely to be guided as they carefully align and cover glomerular capillary loops. Primary processes were fairly long and we were able to follow them up to 20–25 µm. Secondary processes were of similar length to primary processes and we were able to identify tertiary processes to about 5 µm. The slit density was about 3–4 slits per µm, similar to previous publications 12. The images appear to indicate that primary and secondary branches are of differing in lengths, however, tertiary branch width and branch-to-branch distance seemed to be tightly controlled to create a highly organized pattern. In summary, podocytes in the healthy NPHSP2Cre/ConfettiTG/WT mice showed little architectural variability.
Figure 2. Representative glomerular images from the NPHS2Cre/R26R-ConfettiTG/WT mice.
(A) Representative PAS stained kidney section of a control NPHS2Cre/R26R-ConfettiTG/WT mouse. (B) Representative confocal image of a six-week-old male NPHS2Cre/R26R-ConfettiTG/WT glomerulus showing podocyte cell body, primary, secondary and tertiary processes and their interrelationship with adjacent podocytes. (C) Foot process architecture of a glomerulus from the same mouse as 2A analyzed by scanning electron microscope. (D) Confocal images of YFP and RFP labeled podocytes and their interdigitating foot processes. (E, F) Yellow fluorescent protein labeled podocyte of a control, twelve-week-old male NPHS2Cre /R26R-ConfettiTG/WT mouse (the same mouse as 2A). (G) Adjacent podocyte processes can be separated by different fluorescent protein label.
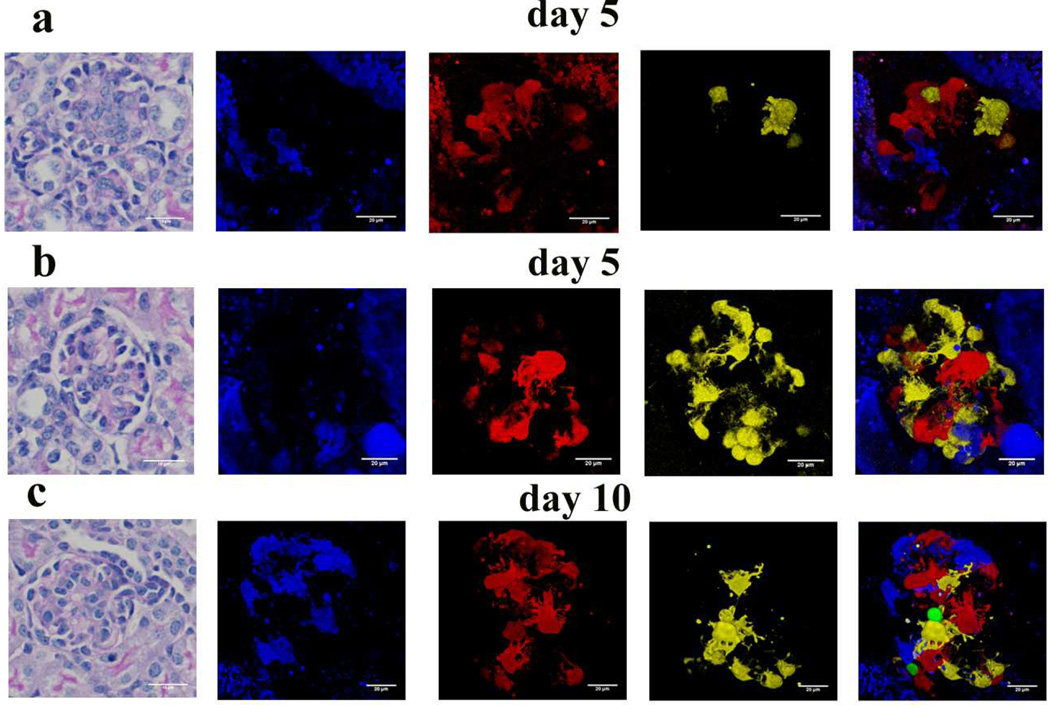
Next we analyzed glomeruli of younger (5 and 10 days old) animals. We observed significant heterogeneity of glomerular maturation in kidneys taken from 5 day old animals (Fig 3A, B). In immature glomeruli, the fluorescent podocyte number and the overall fluorescence level were much lower when compared to the 6-week-old animals. This is consistent with the observation that the podocin gene is only expressed in mature podocytes. Sometimes we also observed clusters of podocytes with the same color potentially indicating recently dividing cells (yellow cells at 6 o’clock in Fig 3B). Fairly simple podocyte architecture was observed in immature glomeruli, some podocytes having only a few short primary processes. The number of podocin expressing podocytes and the podocyte foot process architecture increased as the animals aged (Fig 3). The foot process architecture of the 10 day old animals were similar to those of 6 week old animals (Fig 3C). In summary the model appears to be a very useful tool to study the development of podocyte architecture.
Figure 3. Morphology of immature podocytes.
PAS stained kidney section of 5 day old (A, B) and 10 days old (C) NPHS2Cre /R26R-ConfettiTG/WT mouse. (B) Representative confocal images of a 5 days old (A, B) and 10 days old (C) NPHS2Cre/R26R-ConfettiTG/WT glomerulus showing podocyte cell body, primary, secondary and tertiary processes and their interrelationship with adjacent podocytes.
Heterogeneous changes in podocyte number, cell shape and individual cell volume after single dose of doxorubicin
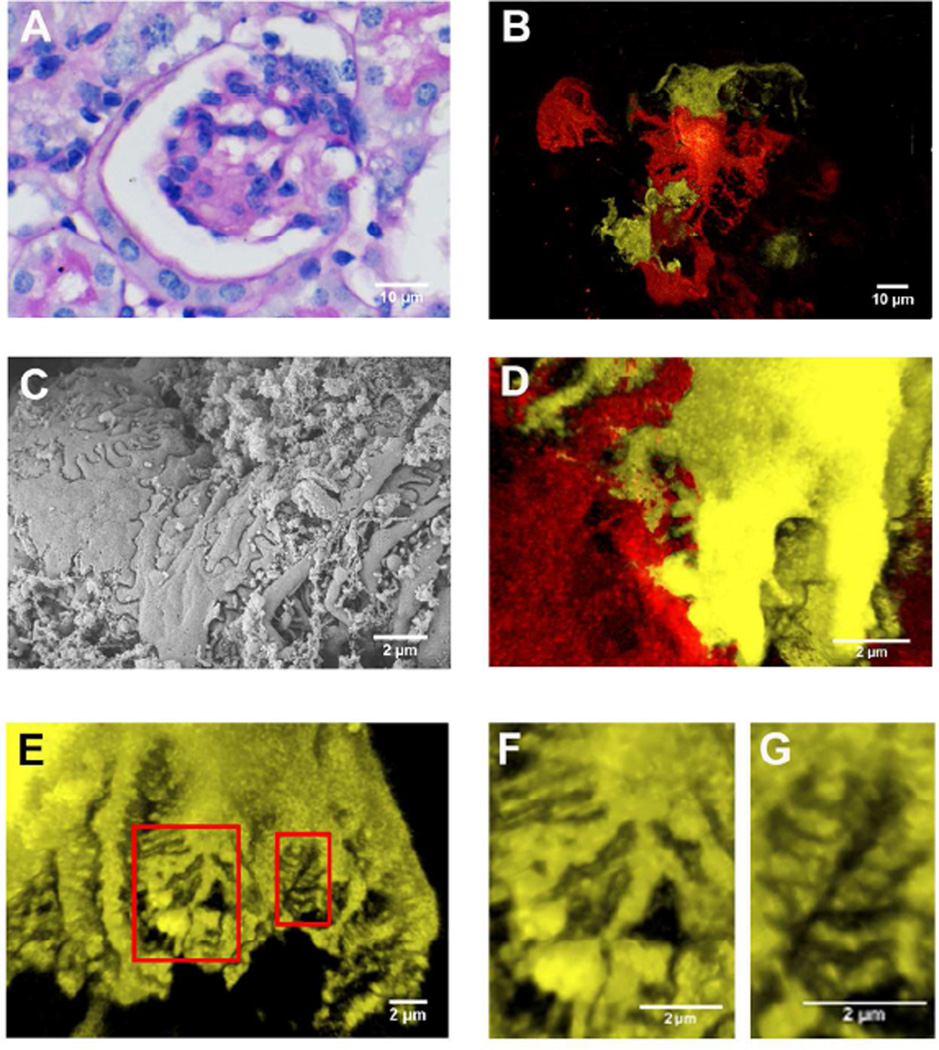
Next, we induced podocyte injury in the NPHSP2Cre/ConfettiTG/WT animals by intravenous doxorubicin injection 13,14. Kidney sections showed increased accumulation of PAS positive material in glomerular segments 7 days after the injection (Fig 4A). Animals developed severe foot process effacement as shown both by the scanning EM (Fig 4B) and by confocal images (Fig 4C). The confocal images of the doxorubicin injected confetti reporter mice showed significant widening and shortening of the foot processes (Fig 4D). Using the fluorescent images, we were able to examine foot processes originating from a single cell and compare them to other cells within a single glomerulus. We found that even within the same cell (Fig 4E), widened (Fig 4F) and normal appearing (Fig 4G) foot processes were present at same time and sometimes these areas were in close proximity to one another. This observation indicates that foot process effacement (FPE) is focal even on an individual cell level, supporting the hypothesis that local and peripheral microdomains might control FPE.
Figure 4. Representative images from doxorubicin injected NPHS2Cre/R26R-ConfettiTG/WT mice.
(A) Representative PAS stained kidney section of a doxorubicin injected NPHS2Cre/R26R-ConfettiTG/WT mouse. (B) Confocal fluorescence images of podocytes from the doxorubicin injected NPHS2Cre /R26R-ConfettiTG/WT mouse shows podocyte loss and heterogeneous cell hypertrophy. (C) Foot processes architecture analyzed by scanning electron microscope from doxorubicin injected mouse. (D) Confocal fluorescence image showing focal foot process effacement. (E) Confocal fluorescence image show heterogeneous foot process effacement. (F) The closer view of the larger red inset in E, showing the foot process effacement. (G) The closer view of the smaller red inset in E, showing the adjacent normal structure of foot process.
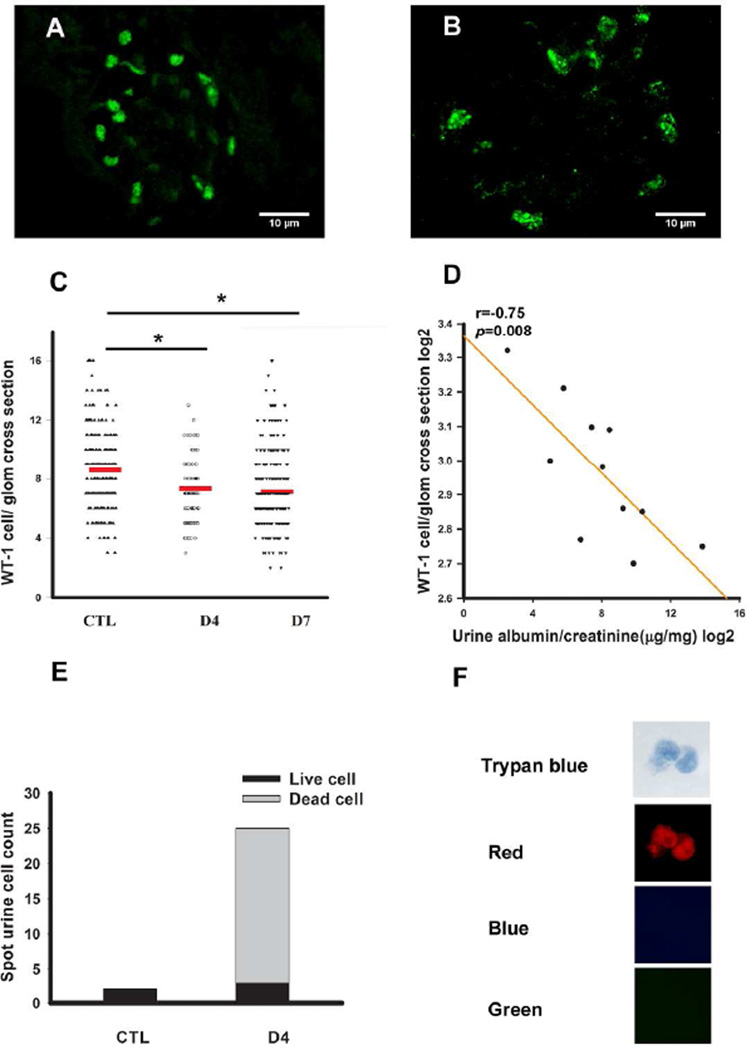
Doxorubicin is known to induce podocyte apoptosis and subsequent podocyte loss 15. Consistent with this observation, immunofluorescence of doxorubicin treated confetti mice showed a significant decline of the Wt1 positive cell number (Fig 5A-B). Statistical analysis indicated that podocyte loss occurs early in this model, as Wt1 positive cell number per glomerular cross section was already statistically lower on day 4 after doxorubicin treatment. Glomerular podocyte number between days 4 and day 7 was not significantly different (Fig 5C). On the other hand, we observed a strong and statistically significant negative correlation glomerular Wt1 positive cell number and albuminuria (Fig 5D).
Figure 5. Decrease in glomerular podocyte number and increase in urinary podocytes after doxorubicin injection.
Representative images of Wt-1 immunofluorescence staining of control (A) and doxorubicin injected mouse (B). (C) Statistical comparison of Wt1 positive cell number per glomerulus of control (n=3) and doxorubicin injected animals on D4 (n=3) and on D7 (n=6). Each dot represents one value from one glomerulus. The red line shows the mean value. (D) Correlation plot between albuminuria (x-axis) Wt-1 positive cells per glomeruli (y-axis). The albuminuria is presented as log2 of the urine albumin (ug) divided by urine creatinine (mg). (E) In control mice, spot urine contained few cells only. Large number of fluorescent cells can be found in the urine on day4 after doxorubicin injection. Dead cells were trypan blue positive, the cell on the picture were also red fluorescent protein positive indicating that are of podocyte origin (F).
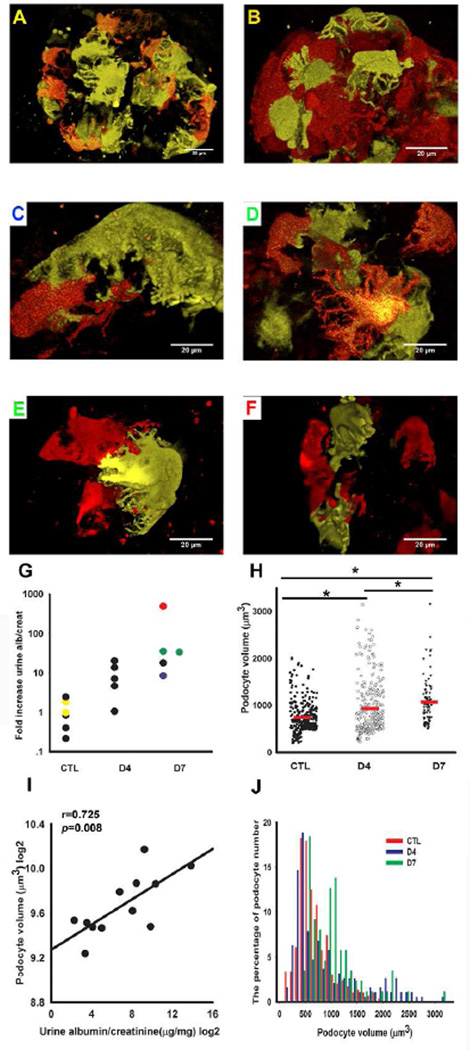
If glomerular podocyte number is decreasing, we should be able to detect podocytes in the urine. Indeed, we observed a significant increase in urinary podocyte number (determined as fluorescent positive cells) 4 days after doxorubicin injection (Fig 5E). Close to 90% of urinary cells, however were trypan blue positive, while a small fraction of the cells were still alive in the urine (Fig 5E, F). This observation confirms that the cells previously described in the urine using different marker expression are indeed of podocyte origin. Confocal images were also consistent with a significant decrease in fluorescent glomerular cell number (Fig 6A-F). Doxorubicin treated animals developed high-grade albuminuria by day 4, which further increased at day 7. ELISA-based quantification of the urinary albumin changed from 30 µg albumin/mg creatinine on the day prior to injection up to 14816 µg albumin/mg creatinine on day 7 (~500-fold increase) (Fig 6G). We used animals on a mixed background so that we can correlate podocyte specific changes with the variable phenotype development. Mice with the most severe podocyte damage had the highest degree albuminuria (Fig 6F), whereas mice with the lowest level of albuminuria had a fairly conserved podocyte structure (Fig 6C). In addition to the foot process changes, we could clearly observe cell size changes in the doxorubicin induced FSGS model (Fig 6H). The stochastic nature of the label permitted us to calculate individual podocyte volume. Overall the measurements showed that the mean total podocyte volume in control animals was 743.27±20.00µm3 Fig 6H). The total podocyte volume was similar, albeit slightly more, when compared to cell body measurements taken by electron microscopes on fixed cells 16–18. The slightly larger size by confocal measurement is expected as we measured the entire cell cytoplasm (not only the cell body) and the measurements were performed without fixation. On day seven the mean podocyte volume increased to 1068.44±52.23 µm3 in mice injected with doxorubicin (Fig 6H). Podocyte volume showed a statistically significant positive correlation with albuminuria (Fig 6I). It appears, however that not every cell enlarged and this difference is driven a by portion of cells that became very large. Heterogeneous size changes were highly remarkable on the fourth day following doxorubicin injection (Fig 6J).
Figure 6. Heterogeneous podocyte changes in doxorubicin injected NPHS2Cre/R26R-ConfettiTG/WT mice.
Confocal images of YFP and RFP from control (A and B) and (C-F) and 7 days after doxorubicin injection of NPHS2Cre/R26R-ConfettiTG/WT mice. (G) Urinary albumin creatinine ratio (ACR) of doxorubicin injected mice. Measurements are presented as a ratio of day 4 or 7 divided by day 0 from the same mouse. The color of the panel label (A-F) corresponds to the color of dots in the albuminuria graph. Images are not shown for animals represented by black dots. (H) Quantitative determination of podocyte cell volume showed a statistically significant increase in doxorubicin injected mice compared with age matched normal saline injected mice (n=7). Each dot represents one measurement, while the red lines represent the mean values. (I) The relationship between podocyte volume (y-axis) and urine albumin/creatinine ratio (x-axis). Both podocyte volume and albuminuria was log2 transformed. (J) Histogram plot of podocyte volume of control (red bar) and 4 (blue bar) and 7 days (green bar) following doxorubicin injection. Note the increased heterogeneity (spread) after doxorubicin injection.
Our individual cell labeling allowed us to examine the correlation between cell size and foot process organization. The images did not show any clear difference in foot process architecture when smaller and larger cells were compared (Fig 6C vs 6E). This observation might potentially indicate that different pathways determine cell size and foot process organization 19,20
Discussion
In summary, we developed a novel and exciting method to directly image individual podocytes in vivo without fixation using a confocal microscope. We believe that this method will fill a key methodological gap in our research community and may direct us toward the analyses of new and important research questions 21. This novel approach can be used to examine cell-cell interactions and podocyte heterogeneity in the glomerulus. At present our understanding of how genetic mutations and environmental changes, affecting all podocytes in the glomerulus result in focal lesion development is largely unexplored 22.
Using this new mouse model our studies demonstrate that foot process effacement is focal even on an individual podocyte level. Local guidance regulators such as semaphorins 23 or local cell-cell communication mediators, for example Notch signaling 24,25, could be excellent candidates to regulate focal actin cytoskeletal changes and FPE. Given that the imaging of this reporter strain can be automated, we propose that the model could potentially serve as a high-through-put method to screen agents that cause and or reverse podocyte FPE, hypertrophy and podocyte loss.
Another key observation is that podocyte enlargement exhibited a very significant heterogeneity during the early stages of proteinuria development. As the heterogeneity develops only within a short period during the proteinuria, we can propose that the heterogeneous cell enlargement might be a functionally relevant event in the early stage of glomerulosclerosis development. Previous transgenic and knock-out manipulation of hypertrophy signaling pathways 26 are consistent with this notion. We may even hypothesize that cell hypertrophy develops as an adaptive mechanism following podocyte loss, as fewer number of cells have to cover the glomerular basement membrane. Podocyte enlargement likely develops as an adaptation to lower cell number, however it seems that ultimately it contributes to glomerulosclerosis. Our results also indicate that pathways that regulate podocyte hypertrophy, foot process effacement and death, are likely to be different as these different markers of podocyte injury did not fully correlate with each other.
Previously, the presence of urinary podocytes have been debated, while there was a strong suggestion that they are of glomerular epithelial cell origin, these cells do not express all podocyte specific proteins 27. As the fluorescent lineage tag marks the cellular origin, here we show that in the doxorubicin induced FSGS model these cells are most likely of podocyte origin. Majority of the urinary cells were no longer alive, consistent with the notion that podocyte apoptosis is a key mechanism for the doxorubicin induced FSGS, a small fraction of podocytes were indeed lost “alive”, indicating that mechanisms other than apoptosis might contribute to podocyte loss as well. The observation also indicates that there is no significant loss of fluorescence in injured podocytes and this method can be used to analyze healthy and injured podocytes.
While podocyte specific fluorescent reporters have been generated before, these models used single fluorescent reporter strains. There is a significant theoretical advantage to use the confetti mice to study cell-cell interaction and heterogeneity. Here adjacent cells can be labeled with different colors. Single color based analysis depends on the mosaic pattern of labeled and unlabeled cells. Indeed, Grgic et al 28 and Hohne et al 29 found that labeling only 20% of podocytes is optimal. Therefore with this method no information can be obtained from cells that are next to each other.
Furthermore, our work indicates that the Volocity Software based 3-D volume reconstruction provides superior image quality compared to stacked confocal images and allows for the discrimination of adjacent cells (Fig 1B-D). As demonstrated by Figure 1, this approach provides a superior 360° view of the glomerulus (when compared to 2-D and projection images), with the software allowing for the rotation of the glomerulus in 360° to distinguish adjacent cells. Nuclei could also be stained (for example with far-red nuclear specific dyes (SYTO 60–64)) to further distinguish individual cells, however, we found this unnecessary as we could always differentiate cell bodies by rotating the images. It also appears that single section (2D) analysis of the podocin confetti mouse (Fig 1B) does not provide sufficient image quality to follow individual podocytes.
The confetti model can also be an excellent tool for fate mapping experiments, especially when combined with an inducible podocyte specific cre line 30. As some of the recent data indicates that podocytes can be renewed from a parietal cell pool, such stochastic multicolor reporter could be used to observe progenitor cell expansion and proliferation31. As cells from the same lineage retain their fluorescent reporter we should be able to follow the ratio of cells carrying different fluorescent proteins. It is also worth mentioning that using the NPHSP2cre we did not observe a significant shift in the ratio of labeled cells 32.
One potential limitation of our study is that the images were not taken in living animals and as we removed the kidneys from the animals causing the unavoidable collapse of the capillary loops. In vivo imaging techniques including multiphoton imaging, should help to circumvent this issue 33. Furthermore due to the overlapping spectrum we did focus on improving our method to discriminate YFP from GFP labeled cells, as the location of GFP was nuclear and we could not use GFP to trace cell shapes.
In summary, here we provide a direct demonstration of the heterogeneous podocyte injury pattern in the context of albuminuria and glomerulosclerosis by using a novel stochastic fluorescent reporter strain. We also show that cells lost in the urine are of podocyte origin. This model could be used as a new tool for future studies to define the mechanism of this heterogeneous podocyte injury.
Methods
The 2.5kb NPHSPCre 9 mice were mated with heterozygous R26R-Confetti mice (Jackson Laboratories, Bar Harbor, ME). Genotyping was performed by standard tail genomic PCR analysis using published allele-specific primers. Animals were maintained under pathogen-free conditions. Studies were approved by, and animals handled according to the Animal Care Committee of the Albert Einstein College of Medicine and the University of Pennsylvania. Podocyte injury was induced by intravenous injection of 25 mg doxorubicin (EBML) per gram of body weight in saline. Control animals were injected with saline solution via tail vein and sacrificed on day 4 or 734. Urinary albumin and creatinine were determined in spot urine samples using mouse albumin–specific ELISA and creatinine companion kits (Exocell Laboratories) following manufacturer’s protocols.
Kidneys were harvested and processed for histological analyses and scanning electron microscopy. Formalin-fixed, paraffin-embedded kidney sections stained with periodic acid Schiff (PAS) were used to compare glomerular morphology. Immunofluorescent staining for Wt-1 (Santa Cruz sc-192, USA) was performed as previously described 35. Images were obtained using a Nikon Eclipse TE300 microscope and SPOT Diagnostic CCD camera.
Transmission electron microscopy was performed on glutaraldehyde-fixed, epoxy-embedded kidney samples stained with uranyl acetate and lead citrate. Samples were evaluated using JEOL 1200EX, electron microscope (AECOM, Analytical Imaging Facility).
Using a scalpel, we manually cut 5×5×5 mm3 kidney pieces and placed them (face down) on MatTek dishes (Thermo) without fixation. Images were taken immediately at room temperature. Usually we imaged 3–4 glomeruli per kidney sample. Four-channel or two channel detecting YFP and RFP only z-stacks of whole glomeruli were acquired using a Leica SP5 AOBS laser scanning confocal microscope, with a 63x/1.4 NA objective. For z-stack imaging, the step size was set at 0.5 microns. The acquisition was set in the cyan, green, yellow and red wavelengths using 405nm, 488nm, 514nm and 543nm wavelength excitation, respectively. Cell body measurements were obtained using a user-defined measurement protocol in Volocity, by Perkin Elmer, Version 5.5.
Statistical analysis
The podocyte volume and urine albuminuria values were not normally distributed therefore the original data was log2 transformed. We used ANOVA with Tamhane’s as post hoc test to compare multiple groups. We used Pearson’s correlation analysis to understand the relationship between two parameters. Values were regarded as significant at p<0.05. Statistical analysis was carried out using SPSS 11.5 software (SPSS Inc., Chicago, USA).
Acknowledgements
The NIH R01 DK076077 supported work in the Susztak lab. Dr. Jianling Tao is also supported by Natural National Science of Foundation of China (81170665). We thank the Einstein Analytical Imaging Facility, especially Frank Macaluso for support and suggestions. A portion of this work was presented at the American Society of Nephrology annual meeting in San Diego, California, USA, on November 3rd 2012.
Footnotes
Disclosure
None.
References
- 1.Ly J, Alexander M, Quaggin SE. A podocentric view of nephrology. Curr Opin Nephrol Hypertens. 2004;13:299–305. doi: 10.1097/00041552-200405000-00006. [DOI] [PubMed] [Google Scholar]
- 2.Pavenstadt H, Kriz W, Kretzler M. Cell biology of the glomerular podocyte. Physiol Rev. 2003;83:253–307. doi: 10.1152/physrev.00020.2002. [DOI] [PubMed] [Google Scholar]
- 3.Welsh GI, Saleem MA. The podocyte cytoskeleton--key to a functioning glomerulus in health and disease. Nat Rev Nephrol. 2012;8:14–21. doi: 10.1038/nrneph.2011.151. [DOI] [PubMed] [Google Scholar]
- 4.Brown EJ, Schlondorff JS, Becker DJ, Tsukaguchi H, Tonna SJ, Uscinski AL, Higgs HN, Henderson JM, Pollak MR. Mutations in the formin gene INF2 cause focal segmental glomerulosclerosis. Nat Genet. 2010;42:72–76. doi: 10.1038/ng.505. [DOI] [PMC free article] [PubMed] [Google Scholar]
- 5.Gbadegesin R, Lavin P, Foreman J, Winn M. Pathogenesis and therapy of focal segmental glomerulosclerosis: an update. Pediatr Nephrol. 2011;26:1001–1015. doi: 10.1007/s00467-010-1692-x. [DOI] [PMC free article] [PubMed] [Google Scholar]
- 6.D'Agati VD. Pathobiology of focal segmental glomerulosclerosis: new developments. Curr Opin Nephrol Hypertens. 2012;21:243–250. doi: 10.1097/MNH.0b013e32835200df. [DOI] [PubMed] [Google Scholar]
- 7.Woroniecki R, Gaikwad AB, Susztak K. Fetal environment, epigenetics, and pediatric renal disease. Pediatr Nephrol. 2011;26:705–711. doi: 10.1007/s00467-010-1714-8. [DOI] [PMC free article] [PubMed] [Google Scholar]
- 8.Ni L, Saleem M, Mathieson PW. Podocyte culture: Tricks of the trade. Nephrology (Carlton) 2012;17:525–531. doi: 10.1111/j.1440-1797.2012.01619.x. [DOI] [PubMed] [Google Scholar]
- 9.Moeller MJ, Sanden SK, Soofi A, Wiggins RC, Holzman LB. Two gene fragments that direct podocyte-specific expression in transgenic mice. J Am Soc Nephrol. 2002;13:1561–1567. doi: 10.1097/01.asn.0000015614.68893.0b. [DOI] [PubMed] [Google Scholar]
- 10.Snippert HJ, van der Flier LG, Sato T, van Es JH, van den Born M, Kroon-Veenboer C, Barker N, Klein AM, van Rheenen J, Simons BD, Clevers H. Intestinal crypt homeostasis results from neutral competition between symmetrically dividing Lgr5 stem cells. Cell. 2010;143:134–144. doi: 10.1016/j.cell.2010.09.016. [DOI] [PubMed] [Google Scholar]
- 11.Kretzschmar K, Watt FM. Lineage tracing. Cell. 2012;148:33–45. doi: 10.1016/j.cell.2012.01.002. [DOI] [PubMed] [Google Scholar]
- 12.Huber TB, Benzing T. The slit diaphragm: a signaling platform to regulate podocyte function. Curr Opin Nephrol Hypertens. 2005;14:211–216. doi: 10.1097/01.mnh.0000165885.85803.a8. [DOI] [PubMed] [Google Scholar]
- 13.Dai C, Stolz DB, Kiss LP, Monga SP, Holzman LB, Liu Y. Wnt/beta-catenin signaling promotes podocyte dysfunction and albuminuria. J Am Soc Nephrol. 2009;20:1997–2008. doi: 10.1681/ASN.2009010019. [DOI] [PMC free article] [PubMed] [Google Scholar]
- 14.Zheng Z, Schmidt-Ott KM, Chua S, Foster KA, Frankel RZ, Pavlidis P, Barasch J, D'Agati VD, Gharavi AG. A Mendelian locus on chromosome 16 determines susceptibility to doxorubicin nephropathy in the mouse. Proc Natl Acad Sci U S A. 2005;102:2502–2507. doi: 10.1073/pnas.0409786102. [DOI] [PMC free article] [PubMed] [Google Scholar]
- 15.Pippin JW, Brinkkoetter PT, Cormack-Aboud FC, Durvasula RV, Hauser PV, Kowalewska J, Krofft RD, Logar CM, Marshall CB, Ohse T, Shankland SJ. Inducible rodent models of acquired podocyte diseases. Am J Physiol Renal Physiol. 2009;296:F213–F229. doi: 10.1152/ajprenal.90421.2008. [DOI] [PubMed] [Google Scholar]
- 16.Arakawa M, Tokunaga J. A scanning electron microscope study of the glomerulus. Further consideration of the mechanism of the fusion of podocyte terminal processes in nephrotic rats. Lab Invest. 1972;27:366–371. [PubMed] [Google Scholar]
- 17.Ng WL, Chan KW, Ma L. A scanning electron microscope study of isolated glomeruli in glomerulonephritis. Pathology. 1983;15:139–146. doi: 10.3109/00313028309084701. [DOI] [PubMed] [Google Scholar]
- 18.Laurens W, Battaglia C, Foglieni C, De Vos R, Malanchini B, Van Damme B, Vanrenterghem Y, Remuzzi G, Remuzzi A. Direct podocyte damage in the single nephron leads to albuminuria in vivo. Kidney Int. 1995;47:1078–1086. doi: 10.1038/ki.1995.154. [DOI] [PubMed] [Google Scholar]
- 19.Godel M, Hartleben B, Herbach N, Liu S, Zschiedrich S, Lu S, Debreczeni-Mor A, Lindenmeyer MT, Rastaldi MP, Hartleben G, Wiech T, Fornoni A, Nelson RG, Kretzler M, Wanke R, Pavenstadt H, Kerjaschki D, Cohen CD, Hall MN, Ruegg MA, Inoki K, Walz G, Huber TB. Role of mTOR in podocyte function and diabetic nephropathy in humans and mice. J Clin Invest. 2011;121:2197–2209. doi: 10.1172/JCI44774. [DOI] [PMC free article] [PubMed] [Google Scholar]
- 20.Huber TB, Hartleben B, Winkelmann K, Schneider L, Becker JU, Leitges M, Walz G, Haller H, Schiffer M. Loss of podocyte aPKClambda/iota causes polarity defects and nephrotic syndrome. J Am Soc Nephrol. 2009;20:798–806. doi: 10.1681/ASN.2008080871. [DOI] [PMC free article] [PubMed] [Google Scholar]
- 21.Prokai A, Peti-Peterdi J. Recent advances in tissue (pro)renin imaging. Front Biosci (Elite Ed) 2010;2:1227–1233. doi: 10.2741/e182. [DOI] [PMC free article] [PubMed] [Google Scholar]
- 22.Gubler MC. Nephrotic syndrome: Genetic testing in steroid-resistant nephrotic syndrome. Nat Rev Nephrol. 2011;7:430–431. doi: 10.1038/nrneph.2011.75. [DOI] [PubMed] [Google Scholar]
- 23.Guan F, Villegas G, Teichman J, Mundel P, Tufro A. Autocrine class 3 semaphorin system regulates slit diaphragm proteins and podocyte survival. Kidney Int. 2006;69:1564–1569. doi: 10.1038/sj.ki.5000313. [DOI] [PubMed] [Google Scholar]
- 24.Niranjan T, Bielesz B, Gruenwald A, Ponda MP, Kopp JB, Thomas DB, Susztak K. The Notch pathway in podocytes plays a role in the development of glomerular disease. Nat Med. 2008;14:290–298. doi: 10.1038/nm1731. [DOI] [PubMed] [Google Scholar]
- 25.Niranjan T, Murea M, Susztak K. The pathogenic role of Notch activation in podocytes. Nephron Exp Nephrol. 2009;111:e73–e79. doi: 10.1159/000209207. [DOI] [PMC free article] [PubMed] [Google Scholar]
- 26.Inoki K, Mori H, Wang J, Suzuki T, Hong S, Yoshida S, Blattner SM, Ikenoue T, Ruegg MA, Hall MN, Kwiatkowski DJ, Rastaldi MP, Huber TB, Kretzler M, Holzman LB, Wiggins RC, Guan KL. mTORC1 activation in podocytes is a critical step in the development of diabetic nephropathy in mice. J Clin Invest. 2011;121:2181–2196. doi: 10.1172/JCI44771. [DOI] [PMC free article] [PubMed] [Google Scholar]
- 27.Petermann AT, Krofft R, Blonski M, Hiromura K, Vaughn M, Pichler R, Griffin S, Wada T, Pippin J, Durvasula R, Shankland SJ. Podocytes that detach in experimental membranous nephropathy are viable. Kidney Int. 2003;64:1222–1231. doi: 10.1046/j.1523-1755.2003.00217.x. [DOI] [PubMed] [Google Scholar]
- 28.Grgic I, Brooks CR, Hofmeister AF, Bijol V, Bonventre JV, Humphreys BD. Imaging of podocyte foot processes by fluorescence microscopy. J Am Soc Nephrol. 2012;23:785–791. doi: 10.1681/ASN.2011100988. [DOI] [PMC free article] [PubMed] [Google Scholar]
- 29.Hohne M, Ising C, Hagmann H, Volker LA, Brahler S, Schermer B, Brinkkoetter PT, Benzing T. Light microscopic visualization of podocyte ultrastructure demonstrates oscillating glomerular contractions. Am J Pathol. 2013;182:332–338. doi: 10.1016/j.ajpath.2012.11.002. [DOI] [PubMed] [Google Scholar]
- 30.Wang J, Wang Y, Long J, Chang BH, Wilson MH, Overbeek P, Danesh FR. Tamoxifen-inducible podocyte-specific iCre recombinase transgenic mouse provides a simple approach for modulation of podocytes in vivo. Genesis. 2010;48:446–451. doi: 10.1002/dvg.20635. [DOI] [PMC free article] [PubMed] [Google Scholar]
- 31.Shkreli M, Sarin KY, Pech MF, Papeta N, Chang W, Brockman SA, Cheung P, Lee E, Kuhnert F, Olson JL, Kuo CJ, Gharavi AG, D'Agati VD, Artandi SE. Reversible cell-cycle entry in adult kidney podocytes through regulated control of telomerase and Wnt signaling. Nat Med. 2012;18:111–119. doi: 10.1038/nm.2550. [DOI] [PMC free article] [PubMed] [Google Scholar]
- 32.Hendry C, Rumballe B, Moritz K, Little MH. Defining and redefining the nephron progenitor population. Pediatr Nephrol. 2011;26:1395–1406. doi: 10.1007/s00467-010-1750-4. [DOI] [PMC free article] [PubMed] [Google Scholar]
- 33.Peti-Peterdi J, Sipos A. A high-powered view of the filtration barrier. J Am Soc Nephrol. 2010;21:1835–1841. doi: 10.1681/ASN.2010040378. [DOI] [PMC free article] [PubMed] [Google Scholar]
- 34.Si H, Banga RS, Kapitsinou P, Ramaiah M, Lawrence J, Kambhampati G, Gruenwald A, Bottinger E, Glicklich D, Tellis V, Greenstein S, Thomas DB, Pullman J, Fazzari M, Susztak K. Human and murine kidneys show gender- and species-specific gene expression differences in response to injury. PLoS One. 2009;4:e4802. doi: 10.1371/journal.pone.0004802. [DOI] [PMC free article] [PubMed] [Google Scholar]
- 35.Kato H, Gruenwald A, Suh JH, Miner JH, Barisoni-Thomas L, Taketo MM, Faul C, Millar SE, Holzman LB, Susztak K. Wnt/beta-catenin pathway in podocytes integrates cell adhesion, differentiation, and survival. J Biol Chem. 2011;286:26003–26015. doi: 10.1074/jbc.M111.223164. [DOI] [PMC free article] [PubMed] [Google Scholar]


