

Abstract
Primary nociceptors are the first neurons involved in the complex processing system that regulates normal and pathological pain1. Our ability to excite and inhibit these neurons has been limited by pharmacological and electrical stimulation constraints; non-invasive excitation and inhibition of these neurons in freely moving non-transgenic animals has not been possible. Here we use an optogenetic2 strategy to bidirectionally control nociceptors of non-transgenic mice. Intra-sciatic nerve injection of adeno-associated viruses encoding an excitatory opsin enabled light-inducible stimulation of acute pain, place aversion, and optogenetically mediated reductions in withdrawal thresholds to mechanical and thermal stimuli. In contrast, viral delivery of an inhibitory opsin enabled light-inducible inhibition of acute pain perception, and reversed mechanical allodynia and thermal hyperalgesia in a model of neuropathic pain. Light was delivered transdermally enabling these behaviors to be induced in freely moving animals. This approach may have utility in basic and translational pain research, and enable rapid drug screening and testing of newly engineered opsins.
There has been much recent interest and progress in applying optogenetics, a technique that enables light-mediated stimulation and inhibition of neuronal function, to control the activity of neurons outside the brain3–11. Optogenetic control of such neurons has largely been achieved through the use of transgenesis in mice3,4,6,11 or rats5, or through the use of non-genetic light-sensitive chemicals in optically transparent organs such as the cornea7. The study of acute and chronic pain represents a particularly fruitful area for optogenetic control, as in addition to its potential translational utility, optogenetic control over primary afferent nociceptors may enable greater understanding of the contribution of activity in these neurons to the development and maintenance of acute and chronic pains states. There have been two previous efforts to optogenetically control nociceptors using genetically encoded light-sensitive opsins. Wang, et al. developed a transgenic mouse line that expressed a stimulatory opsin in a defined nociceptor sub-type expressing Mas-related G-protein-coupled receptor member D and used it to examine functional connectivity in the substantia gelatinosa layer of the spinal cord6. This system was an early demonstration of the power of optogenetics in causal dissection of pain circuitry; however, it was restricted to in vitro preparations and was not applied to freely moving animals. More recently, Daou, et al. developed a transgenic mouse line expressing a stimulatory opsin in NaV1.8+ expressing neurons11, and characterized its utility in transdermal optogenetic activation and sensitization of pain. Both of these systems have the great benefit of genetic specificity and achieve optogenetic activation restricted to a defined class of neurons. However, both of these methods require transgenesis, and may therefore be less amenable to use across different species or to rapid extension to new opsin variants. Finally, the capability to optogenetically inhibit pain sensation has remained elusive.
Here we designed a method to optogenetically stimulate and inhibit acute pain in both normal and pathological states in freely moving non-transgenic mice. We sought a method that was flexible and adaptable, so that we could rapidly exploit the variety of newly developed opsins that exhibit different activation spectra, kinetics and downstream effects12. In addition, to ensure that our approach could lay the foundation for future translational application of optogenetics in the peripheral nervous system13,14, we chose a strategy that was clinically relevant. We used adeno-associated virus serotype 6 (AAV6), which has been used for gene delivery through retrograde transport in non-human primates, both in the periphery15 and in the brain16, and is a leading candidate for use in human clinical trials17 to express opsins in nociceptors. AAV6 has previously been reported to specifically transduce nociceptors when delivered through an intra-sciatic injection18.
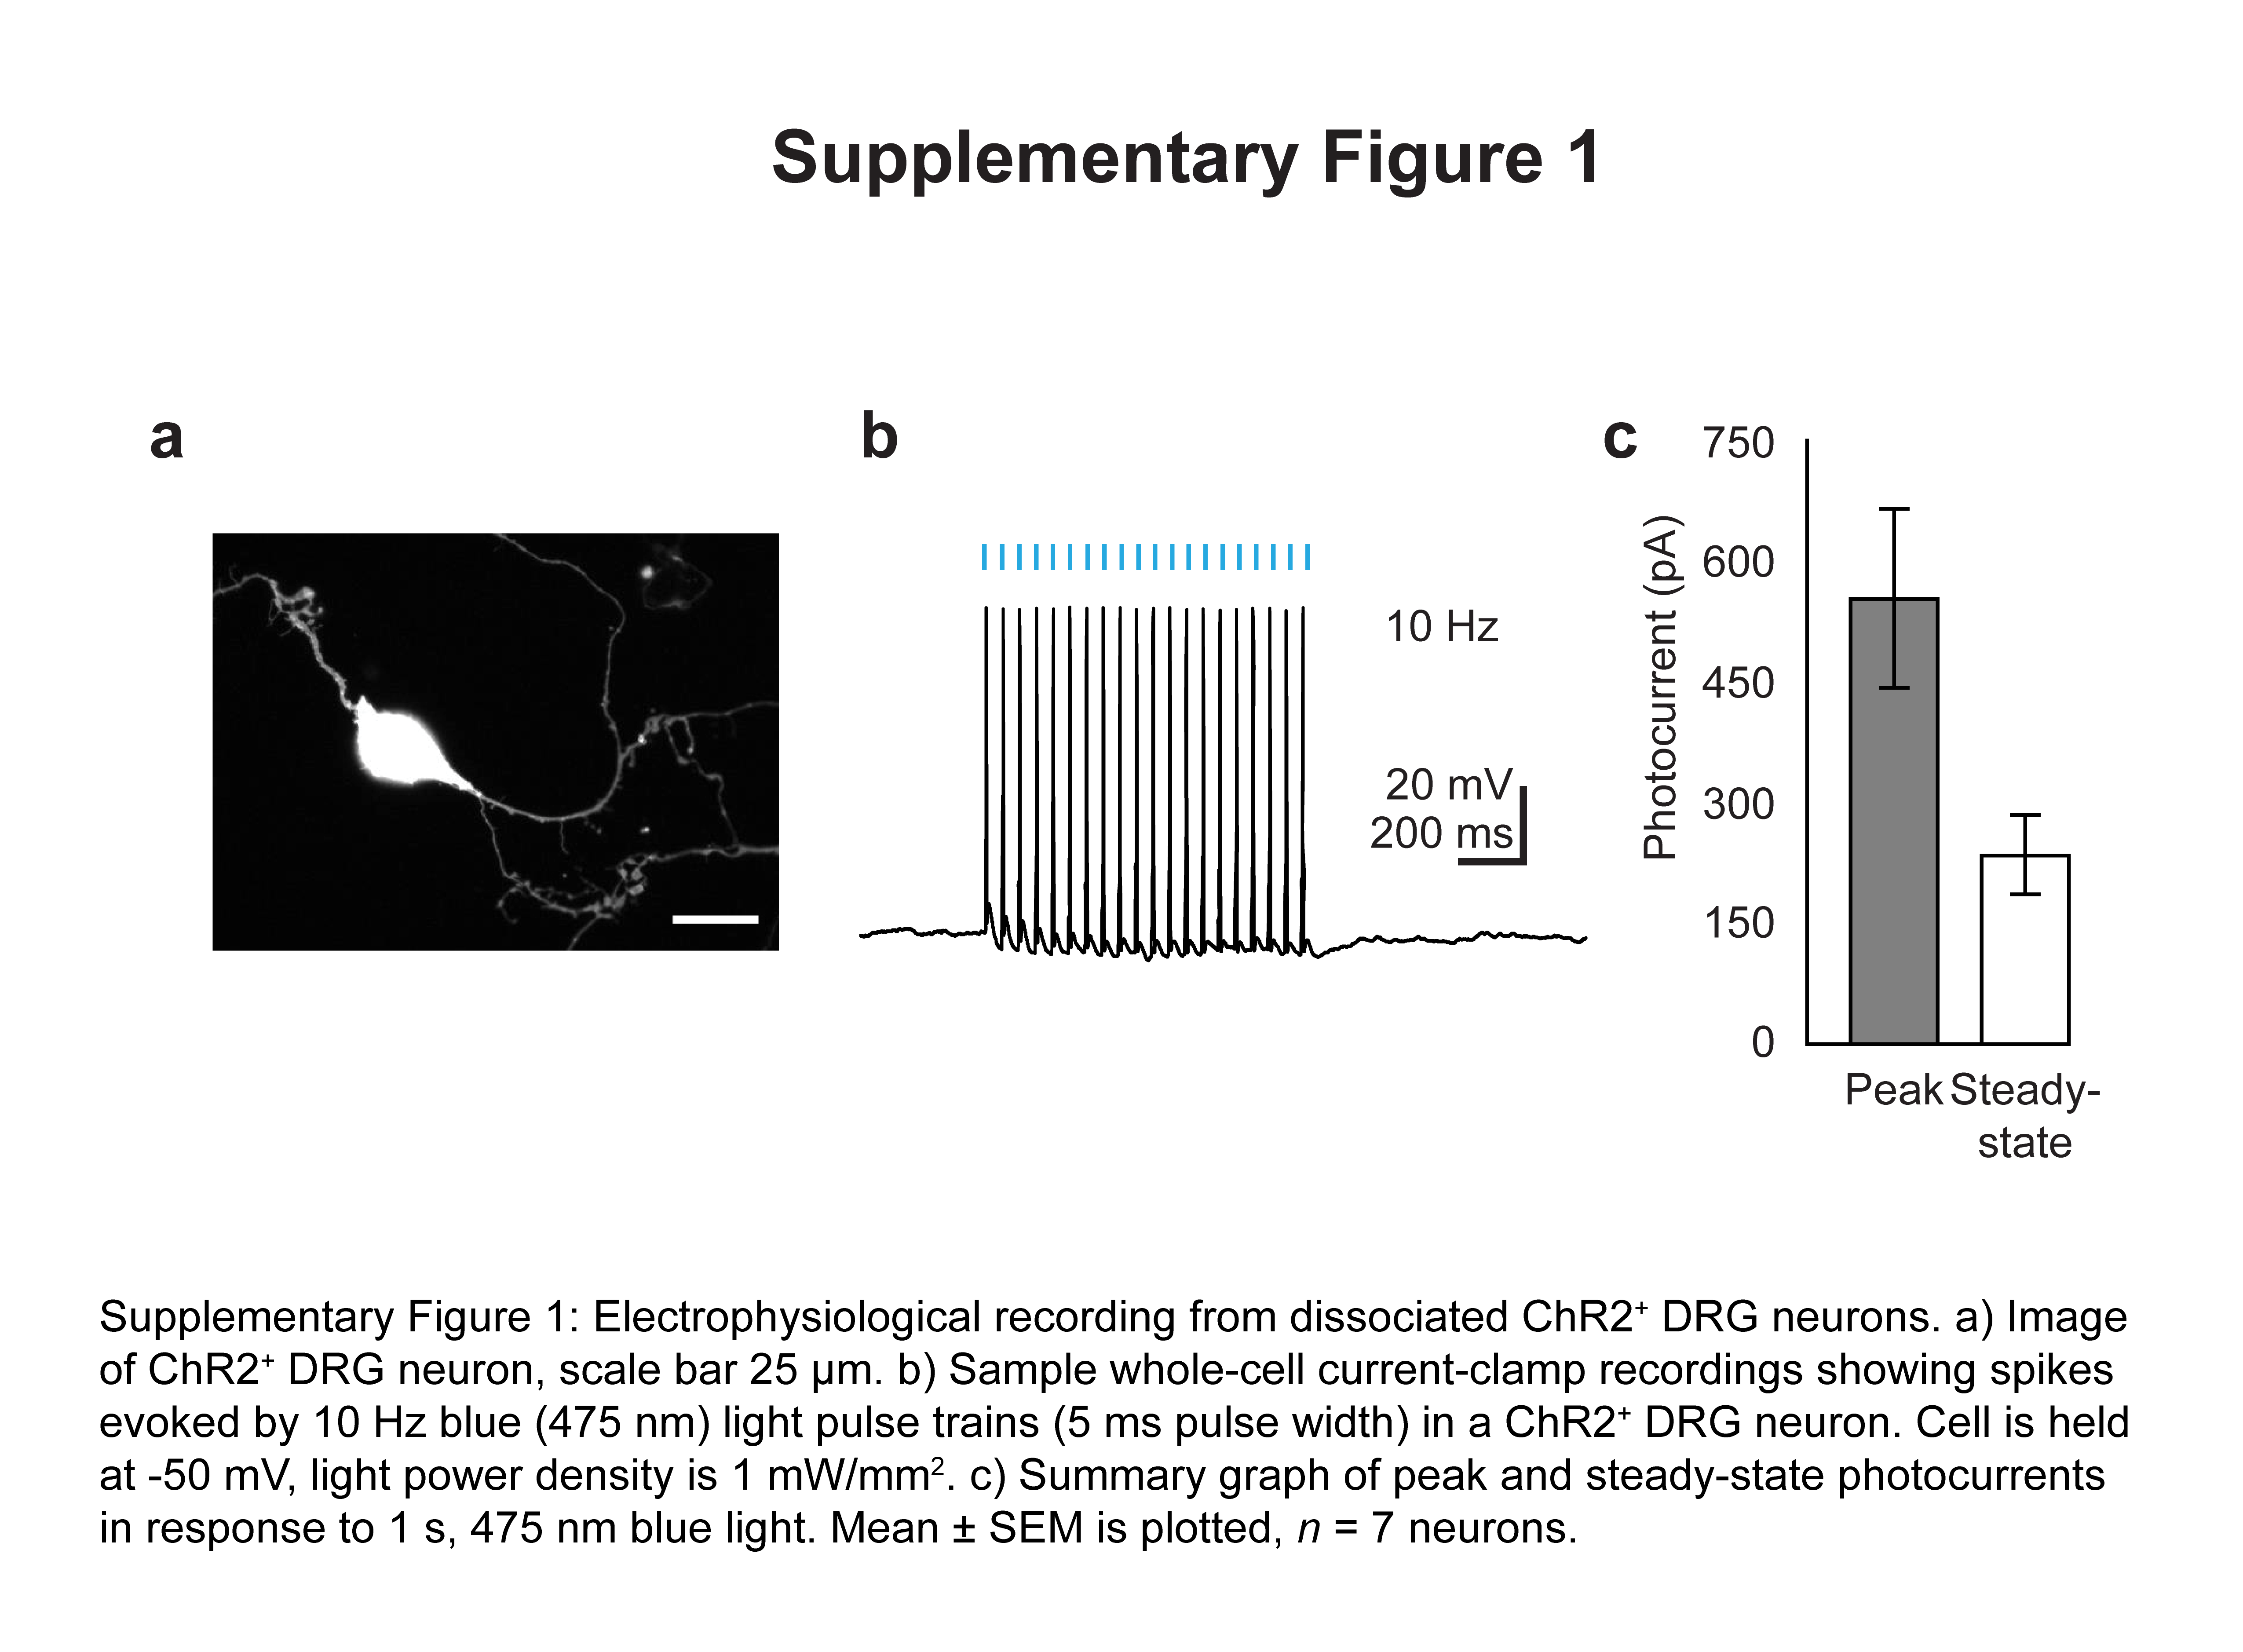
We engineered AAV6 to express the blue light-sensitive cation channel channelrhodopsin-2 (ChR2) fused to enhanced yellow fluorescent protein (eYFP), under the control of the pan-neuronal human synapsin-1 promoter (hSyn). We then injected AAV6-hSyn-ChR2-eYFP into the sciatic nerve of mice. We chose this route of delivery as it involves a simple surgery and poses no risk for damage to the spinal cord, unlike injections into the dorsal root ganglia (DRG) or spinal cord. Two to four weeks after injection, electrophysiological recordings from ChR2-expressing neurons in the dorsal root ganglia revealed that ChR2 was functional, as ChR2+ cells could fire action potentials when stimulated at 5–10 Hz with 1 mW/mm2 475 nm light (Fig. 1a, Supplementary Fig. 1). 16.6±2.9% of all DRG neurons expressed ChR2 (Fig. 1b). ChR2 was preferentially expressed in small-diameter neurons (80% of neurons < 200 μm2 were ChR2+, Fig. 1c). Immunohistochemistry showed considerable overlap between ChR2 and various nociceptive markers, including Substance P, calcitonin gene-related peptide (CGRP) and isolectin-B4 (IB4) (Fig. 1b, d), but minimal overlap with NF200, a marker of large-diameter myelinated neurons that mediate touch and proprioception. Consistent with this, 96.8±1% of ChR2+ axons in the sciatic nerve were unmyelinated (Fig. 1e). ChR2 trafficked throughout the neuron, terminating in central projections to superficial laminae in the dorsal horn of the spinal cord, with little expression seen in deeper laminae or in ascending dorsal columns; these observations suggest that the transduced neurons were nociceptors projecting to Rexed’s lamina I/IIo (Fig. 1f, Supplementary Fig. 2). Interestingly, we observed strong ChR2 expression in dermal free nerve endings in regions of the paw innervated by the sciatic nerve, suggesting that transdermal illumination of the paw could potentially be used to optogenetically activate these nociceptors (Fig. 1g).
Figure 1.

Intra-sciatic injection of AAV6-hSyn-ChR2-eYFP transduced unmyelinated nociceptors projecting to spinal cord lamina I/IIo. a) Electrophysiology of dissociated ChR2+ DRG neurons (n = 7 neurons). Left, representative whole-cell current-clamp recording showing action potentials induced by 475 nm light (5 Hz, 1 mW/mm2). Right, representative whole-cell voltage-clamp recording showing response to a light pulse (1 s, 475 nm, 1mW/mm2). Cell is held at −50 mV. Blue bars denote exposure to light. b) Quantification of histological data (representative images shown in (d)) plotted as fraction of all DRG neurons (left) or all ChR2+ neurons (right) (n = 5 mice). c) AAV6-hSyn-ChR2-eYFP was injected intra-sciatically and 4 weeks later the diameter of transduced DRG neurons was calculated from histological images using Fiji (n = 205 ChR2+ neurons). d) AAV6-hSyn-ChR2-eYFP was injected into the sciatic nerve. 2–4 weeks later, lumbar DRG sections were stained with antibodies specific for nociceptive markers (Substance P, CGRP, IB4) or NF200 (all shown in magenta). ChR2, green; overlay, white. Scale bar: 100 μm. e) AAV6-hSyn-ChR2-eYFP was injected into the sciatic nerve. 2–4 weeks later, sciatic nerve sections were stained with FluoroMyelin, a dye specific for myelin (staining shown in magenta). ChR2, green. Right panel shows inset drawn in left panel. Scale bars: left, 50 μm; right 25 μm. f, g) AAV6-hSyn-ChR2-eYFP was injected into the sciatic nerve. 2–4 weeks later, qualitative observation of YFP fluorescence in histological sections suggested ChR2-YFP expression in the (f) lumbar spinal cord (scale bars: left, 250 μm; right, 100 μm) and (g) dermis of the paw (scale bars: left, 100 μm; right, 50 μm). Right panels show inset drawn in left panel. All grouped data are shown as mean ± s.e.m.
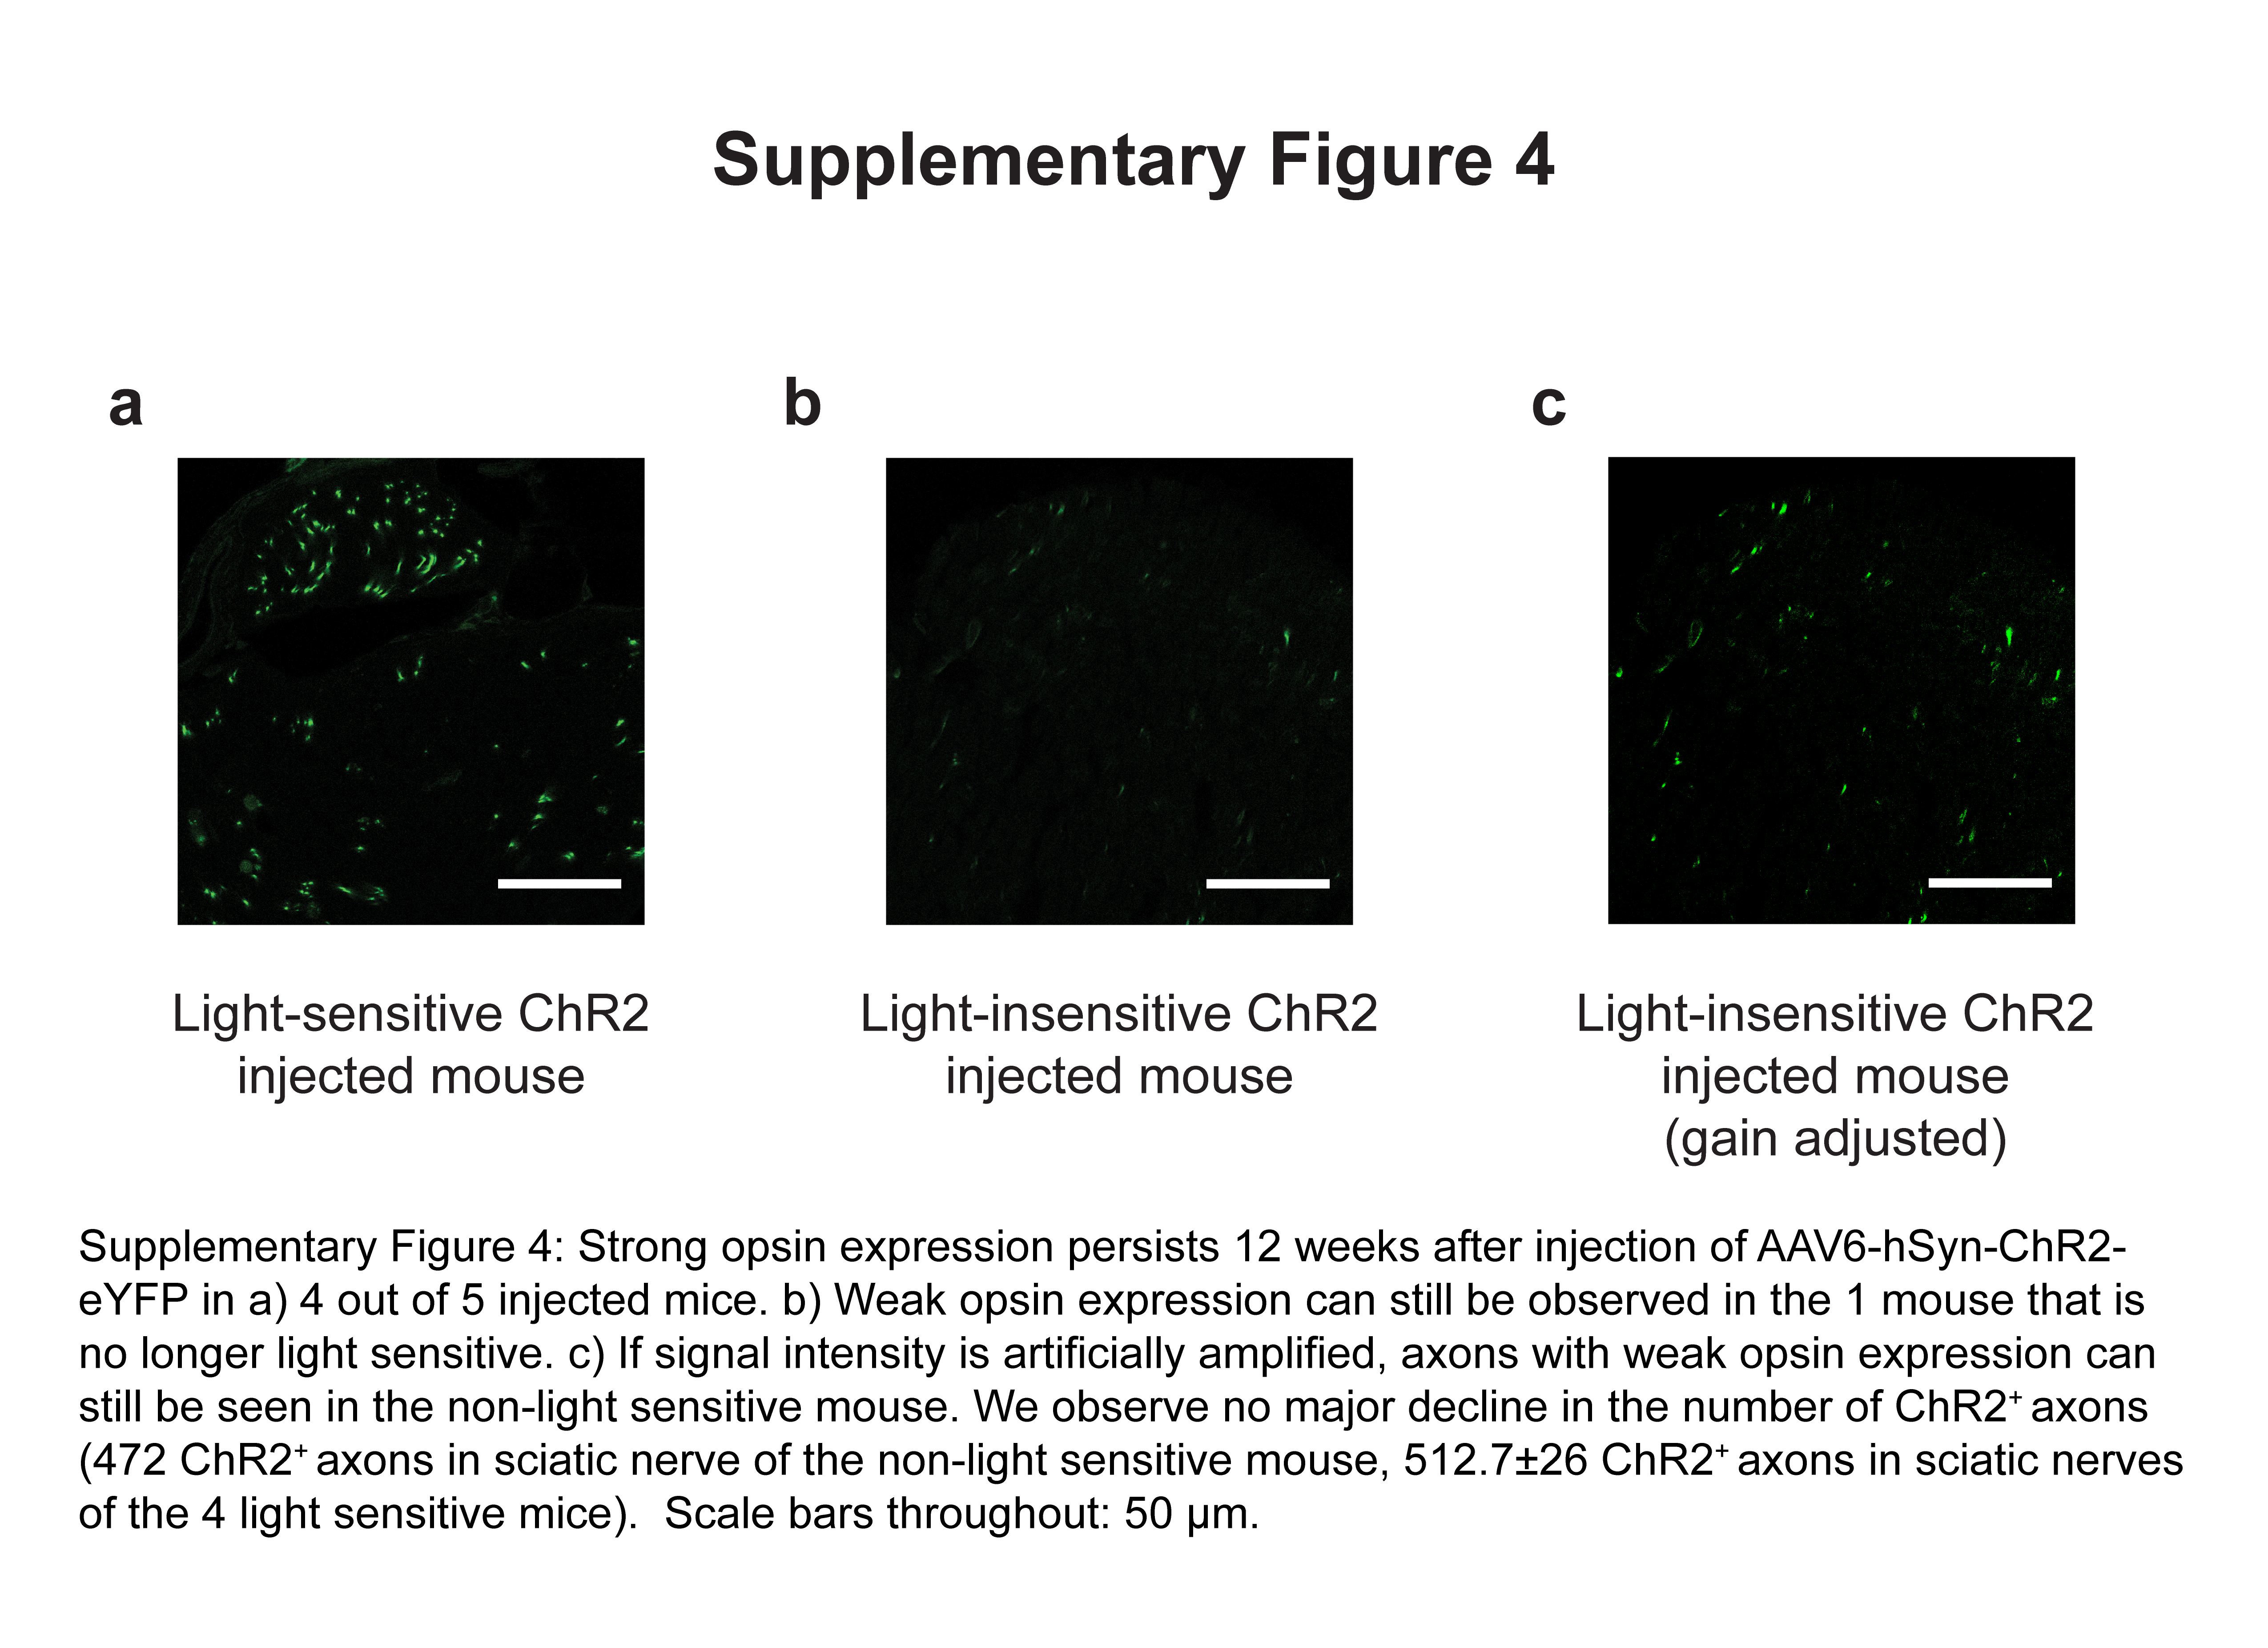
We next examined the behavioral effect of transdermal optogenetic activation of these nociceptors. We allowed mice to freely explore a chamber with a transparent floor. After habituation, we shone blue light (1mW/mm2) on the plantar hindpaws of AAV6-hSyn-ChR2-eYFP-injected mice (Fig. 2a). In response to blue light, mice flinched, vocalized, or engaged in prolonged paw-licking; these are operant behaviors associated with pain19 (Supplementary Video 1). To quantify this effect, we measured the time between light onset and any paw withdrawal, regardless of whether such withdrawal was due to pain or normal exploratory behavior. AAV6-hSyn-ChR2-eYFP-injected mice were light sensitive, withdrawing with latencies as low as a few hundred milliseconds in response to low intensities of blue light (1 mW/mm2) (Fig. 2b). Reduced latency (compared with responses to yellow light) was first observed 2 weeks after virus injection (P = 0.034, effect size: 2.10), and remained low for 3 weeks thereafter (week 3: P = 0.027, effect size = 2.17; week 4: P = 0.026, effect size = 2.19). These same latencies remained significantly reduced when compared with mice injected with a control AAV6-hSyn-eYFP virus (Fig. 2b). At two to four weeks after injection, illumination levels below 1 mW/mm2 showed less of a nociceptive effect, while an increase in illumination intensity past 1 mW/mm2 did not result in any additional decrease in latency (Fig. 2c). Although latencies to 1 mW/mm2 blue light in AAV6-hSyn-ChR2-eYFP-injected mice began to increase 5 weeks following injection, most mice remained sensitive to higher intensities of light (> 3.3 mW/mm2, 4 out of 5 mice) when examined at 12 weeks following injection (Fig. 2b). Expression of Astrocytic markers was slightly higher in injected versus uninjected mice at 12 weeks post-injection (Supplementary Fig. 3a). We observed microglial activation 12 weeks post-injection, and the extent of activation was qualitatively higher in the mouse that was no longer light-sensitive (Supplementary Fig. 3b). This mouse also exhibited weaker YFP fluorescence, but did not show a reduction in the total number of YFP expressing axons when counted in sciatic nerve cross-sections (Supplementary Fig. 4). Although based on analysis of only one light-insensitive mouse, these observations may indicate that the change in light sensitivity is due to partial shutdown of transgene expression, as has been previously reported with AAV6 in mice20.
Figure 2.

Transdermal illumination of AAV6-hSyn-ChR2-eYFP-injected mice results in tunable pain-like behavior and sensitizes mice to mechanical and thermal stimuli. a) Experimental schematic b) AAV6-hSyn-ChR2-eYFP or AAV6-hSyn-eYFP (YFP) was injected into the sciatic nerve unilaterally. Latency in withdrawal response to blue light (at indicated times after injection) or yellow light (2–4 weeks after injection) (1 mw/mm2, n = 4 mice) was measured. (*, One-way ANOVA: F(6,21) = 3.98; P = 0.0082; Dunnett’s test: P (week 2) = 0.034, P (week 3) = 0.027, P (week 4) = 0.026; effect size (week 2) = 2.10, effect size (week 3) = 2.17, effect size (week 4) = 2.19). c) Mice were injected as in (b), except bilaterally, and exposed to blue light of varying intensity. 2–4 weeks after injection, latency in withdrawal response was measured (n = 4 hind paws from 2 mice). d) Place aversion schematic e) Change in preference of AAV6-hSyn-ChR2-eYFP (ChR2; 55.6% decrease in time spent in blue-lit areas, effect size = 3.11, P = 0.0013, n = 5) or AAV6-hSyn-eYFP (YFP; 19.9% increase in time spent in blue-lit areas, P = 0.06, n = 5)-injected mice for the blue-lit areas was measured 2–4 weeks after injection during exposure to light. These two percent changes were statistically different from each other. (P = 0.00061) f) Place aversion changes compared to baseline (no light). g) Traces of individual mice for place aversion data. h) Schematic of experiment assessing ChR2-mediated sensitization (0.25 mW/mm2 blue light intensity) to von Frey filaments. i) von Frey thresholds in AAV6-hSyn-ChR2-eYFP-injected mice (effect size = 0.904, P = 0.027, n = 10 paws) and wild-type uninjected mice (P = 0.50, n = 10 paws) in the presence and absence of blue light. j) Schematic of experiment assessing optogenetic modulation of thermal thresholds. Blue light power density (0.15 mW/mm2). k) Withdrawal (Hargreaves) latency to infrared stimulus in AAV6-hSyn-ChR2-eYFP-injected mice (effect size = 2.77, P = 0.00038, n = 7 paws) and wild-type uninjected mice (P = 0.91, n = 9 paws, controls for ChR2 injected mice) in the presence of blue light or off-spectrum control illumination. All grouped data are shown as mean ± s.e.m.
To test if optogenetic induction of pain was tunable, we asked if lower intensities of illumination (0.25 mW/mm2) that were not immediately aversive would cause more subtle effects. We constructed a place aversion apparatus in which the floor of each chamber was illuminated with an LED array that emitted either off-spectrum (red, 625 nm) or on-spectrum (blue, 475 nm) light (Fig. 2d). AAV6-hSyn-ChR2-eYFP-injected mice, when exploring the blue lit chamber, did not show any outward signs of pain, and did not engage in paw-licking or flinch from the light. However, they showed an 80–20% preference for the red chamber over the blue chamber (P = 0.0013, effect size = 3.11) (Fig. 2e–g). Such aversion is potentially caused by low levels of pain that do not rise to levels that induce reflexive withdrawal, but still cause changes in operant behavior. AAV6-hSyn-eYFP-injected mice showed no significant preference for either chamber (Fig. 2e–g).
We reasoned that low levels of optogenetic stimulation may also act to sensitize AAV6-hSyn-ChR2-eYFP-injected mice to otherwise inoffensive stimuli. To examine this, we conducted von Frey testing of the mechanical withdrawal threshold and Hargreaves testing of the thermal withdrawal latency, and did so with concurrent illumination of the relevant paw with low intensities of blue light (0.15 mW/mm2, Fig. 2h–k). While such illumination was insufficient to induce immediate aversion (Fig. 2c), it did significantly lower von Frey thresholds (Fig. 2i) by 50% (P = 0.027, effect size = 0.904), and Hargreaves latency (Fig. 2k) by 55% (P = 0.00038, effect size = 2.77). Such sensitization may occur through sub-threshold depolarization induced in nociceptor free nerve endings, which may render them more sensitive to otherwise innocuous stimuli. Wild-type mice showed no significant difference in von Frey thresholds or Hargreaves latency in the presence or absence of blue light.
To complement our ability to optogenetically induce pain, we sought to develop methods to optogenetically inhibit action potential generation in nociceptors. Such inhibition could have therapeutic value, and provide a type of spatially and temporally restricted control over action potential generation not possible with pharmacology or electrical stimulation. To this end, we engineered AAV6 to express the yellow-light sensitive third-generation chloride pump halorhodopsin (eNpHR3.0) fused to eYFP, again under the control of hSyn promoter.
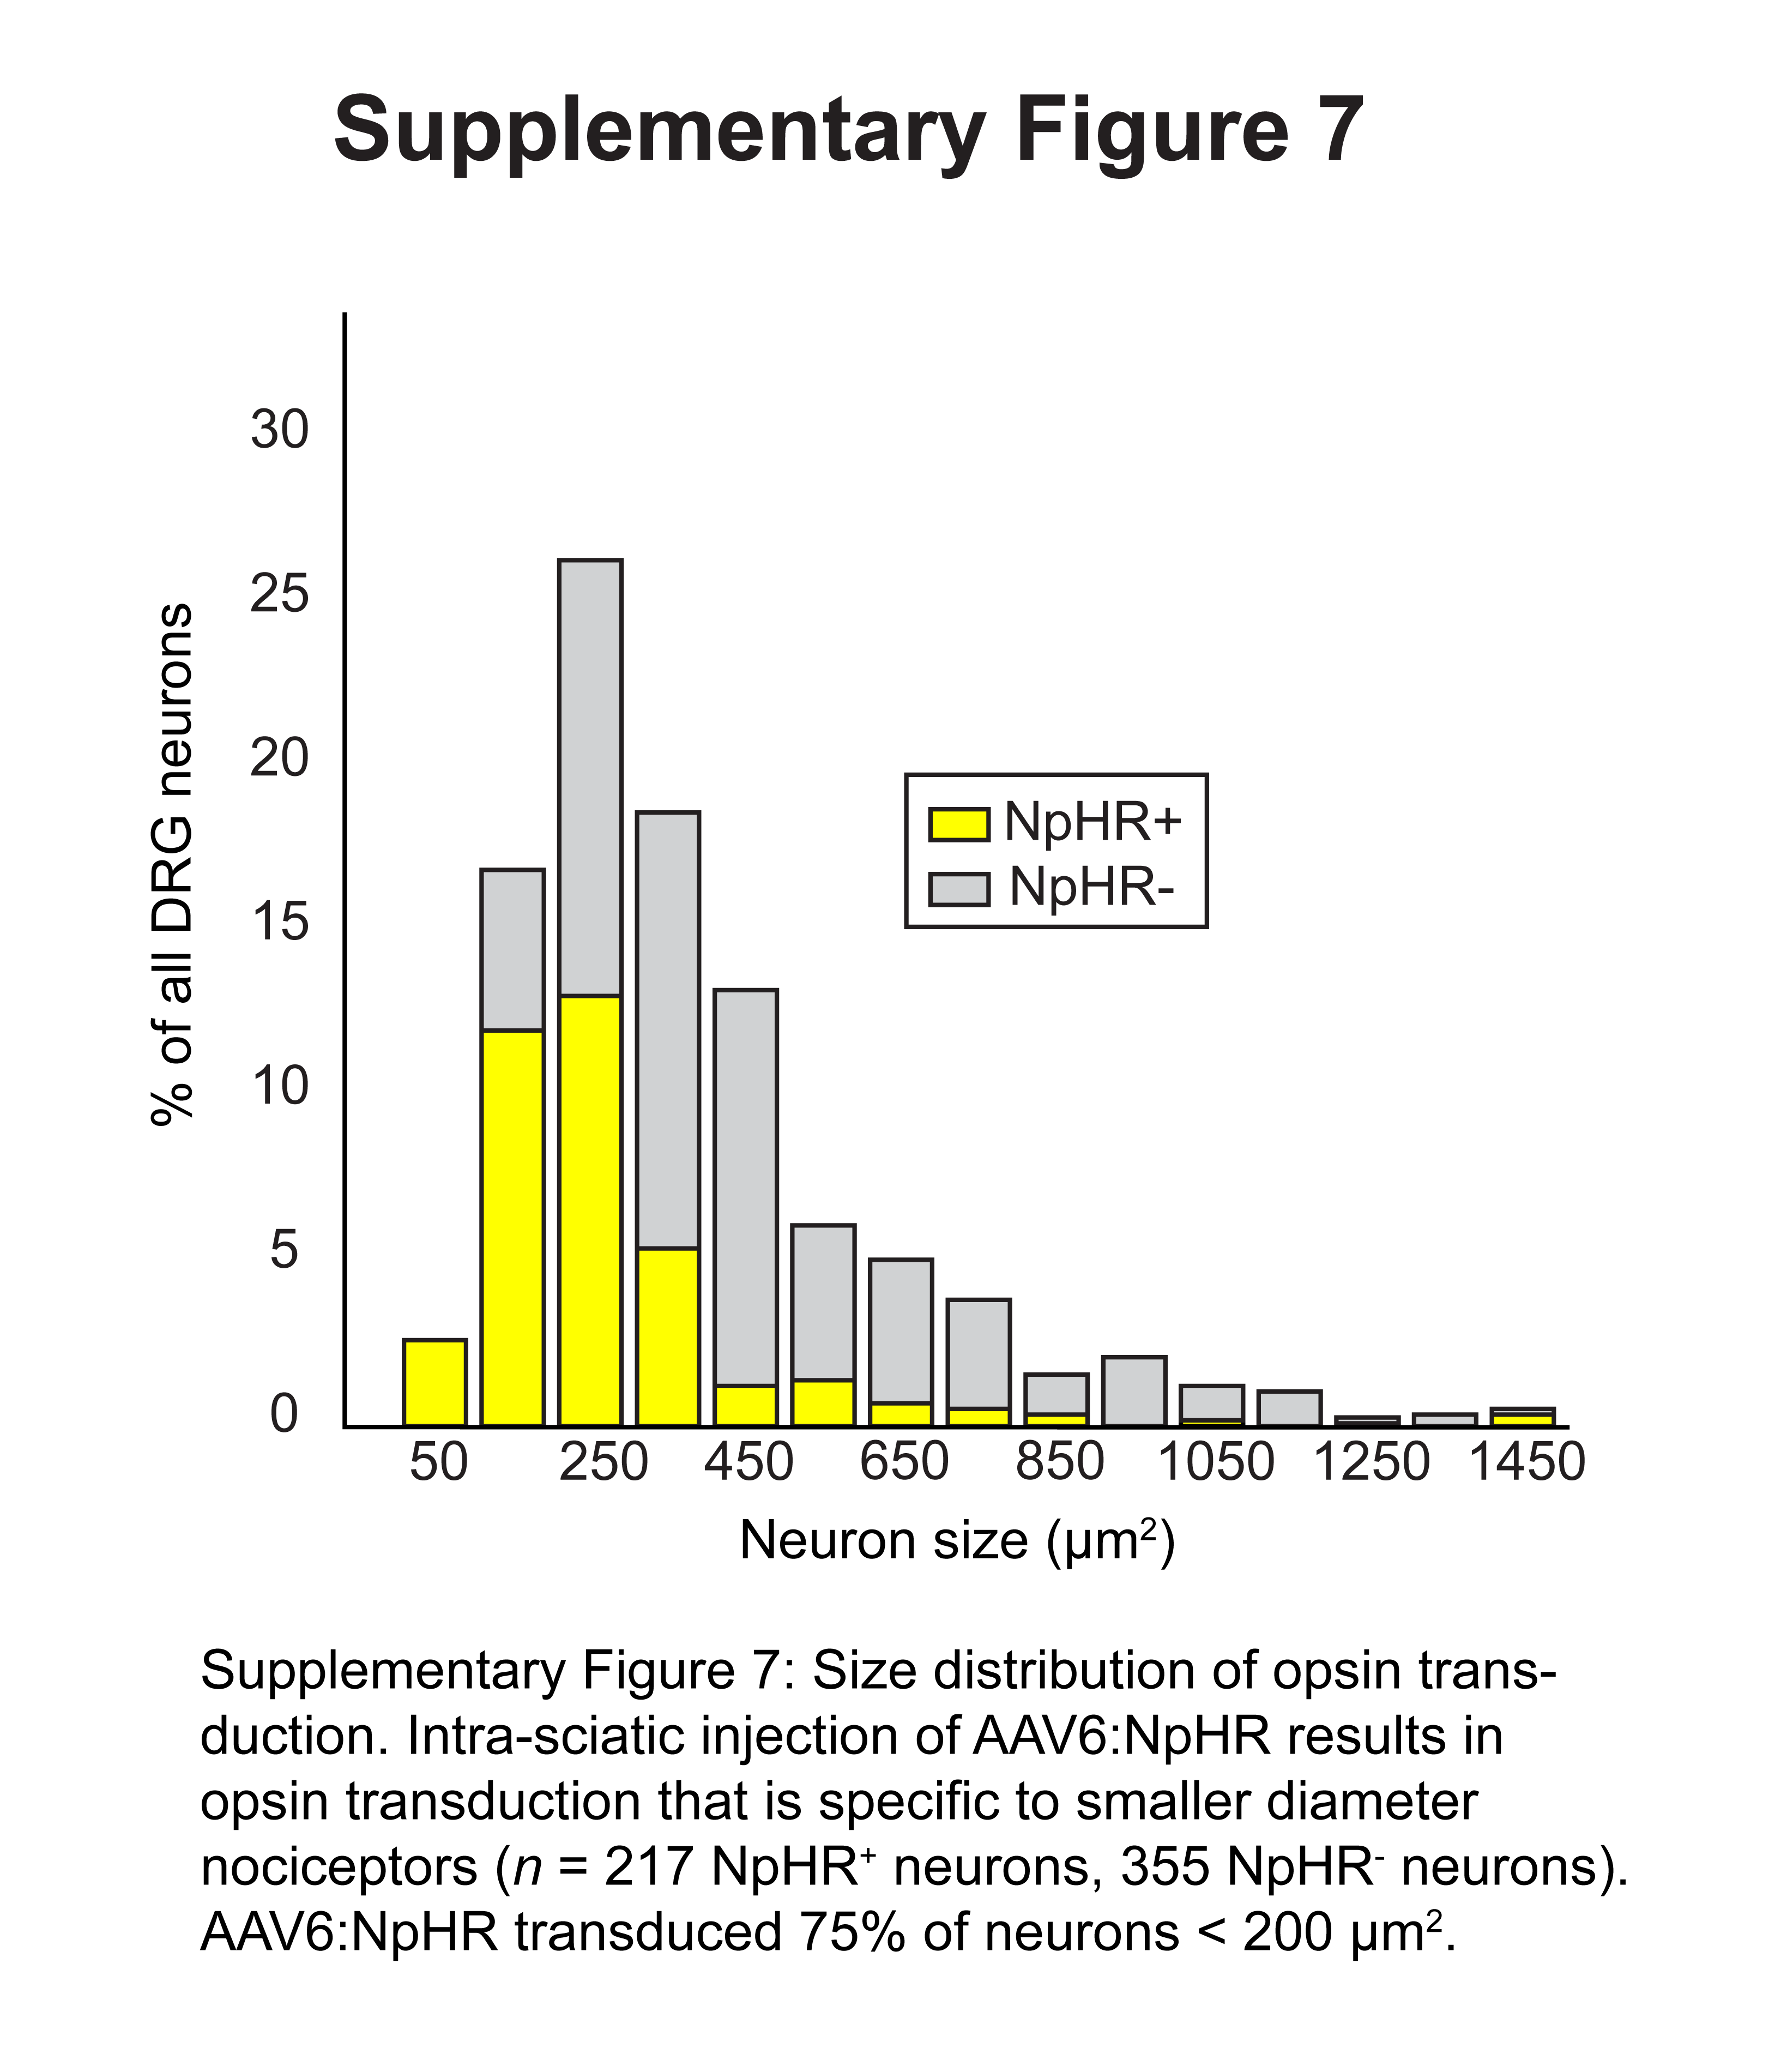
We injected AAV6-hSyn-eNpHR3.0-eYFP into the sciatic nerve of mice, again achieving transduction primarily of lamina I/IIo projecting nociceptors (Supplementary Fig. 5, 6). Similar to ChR2 expression patterns, we transduced 16.5±3.1% of all DRG neurons, including 75% of neurons less than 200 μm2 in diameter (Supplementary Fig. 7). We observed some opsin-dependent variation: 83.8% of NpHR+ axons were unmyelinated, as compared with 96.8% of ChR2+ axons. In some spinal cord sections, we also observed NpHR transduction of ventral horn motor neurons projecting to muscles enclosing the sciatic nerve cavity, potentially as a result of spillover from the intra-sciatic injection into this cavity10. As these neurons would not project to the dermis, we do not expect transdermally applied illumination to affect these neurons. Examination of the paw of NpHR-injected mice showed a similar pattern of expression as that observed in ChR2-injected mice (Fig. 1g, Supplementary Fig. 5e). Electrophysiological recordings of isolated cultured NpHR positive DRG neurons revealed strong hyperpolarization in response to constant yellow light illumination, and this was sufficient to block action potential initiation (Fig. 3a, Supplementary Fig. 8).
Figure 3.

Transdermal illumination of AAV6-hSyn-NpHR-eYFP-injected mice desensitizes mice to mechanical and thermal stimuli and reverses mechanical allodynia and thermal hyperalgesia caused by a chronic constriction injury (CCI). a) Electrophysiological recording from dissociated NpHR+ DRG neurons (n = 10 neurons). Left, image of NpHR+ DRG neuron, scale bar 25 μm. Middle, representative whole-cell current-clamp recordings showing yellow (586 nm) light-mediated inhibition of electrically evoked spikes (400 pA current injection, 5 ms pulse width) in an NpHR-expressing DRG neuron. Yellow bar denotes exposure to constant light. Right, representative whole-cell voltage-clamp recording showing outward photocurrent in an NpHR-expressing DRG neuron exposed to a 1 s, 586 nm light pulse (indicated by yellow bar). b) Experimental schematic of assessment of NpHR-mediated inhibition of mechanical stimuli (1.1–1.7 mW/mm2 light intensity) c) von Frey thresholds of AAV6-hSyn-NpHR-eYFP-injected mice (effect size = 0.802, P = 0.0043, n = 24 paws) and wild-type uninjected mice (P = 0.71, n = 20 paws) in the presence or absence of yellow light. d) Withdrawal (Hargreaves) latency to infrared stimulus in AAV6-hSyn-NpHR-eYFP-injected mice (effect size = 2.05, P = 0.00019, n = 10 paws) and wild-type uninjected mice (P = 0.26, n = 10 paws) exposed to yellow light (0.15 mW/mm2) or control off-spectrum illumination. e) von Frey thresholds of AAV6-hSyn-NpHR-eYFP-injected (NpHR) (78% increase, effect size = 1.43, P = 0.0020, n = 10 paws) or AAV6-hSyn-eYFP-injected (YFP) (P = 0.41, n = 12 paws) mice in the presence of yellow light were measured before CCI. The same measurements were performed 2–3 days after CCI in the absence of yellow light (NpHR injected mice, 64% reduction, effect size = 1.61, P = 0.0020, n = 10 paws; YFP mice, 59% reduction, effect size = 1.03, P = 0.00049, n = 12 paws) and in the presence of yellow light (258% increase in NpHR mice, effect size = 0.92, P = 0.0020, n = 10 paws; YFP mice P = 0.57, n = 12 paws). f) Mice were subjected to CCI as in (e) and withdrawal (Hargreaves) latency (before or after CCI) to infrared stimulus in the presence of yellow light or off-spectrum control illumination was measured. Effect of yellow light before CCI: NpHR mice (112% increase, effect size = 3.95, P = 0.00025, n = 7 paws, compared to off-spectrum illumination); YFP mice (P = 0.97, n = 9 paws). After CCI: during off-spectrum illumination (NpHR mice, 45% reduction, effect size = 3.75, P = 0.00077, n = 7 paws; YFP mice, 40% reduction, effect size = 2.06, P = 0.0038, n = 9 paws) and during yellow light (NpHR mice, 132% increase beyond initial pre-CCI latency, effect size = 1.91, P = 0.012, n = 7 paws; YFP mice, P = 0.53, n = 9 paws). All grouped data are shown as mean ± s.e.m.
We tested NpHR-injected mice using similarly modified von Frey and Hargreaves apparatuses that emitted yellow (593nm) light (Fig. 3b). We noted significant behavioral responses to optogenetic inhibition of nociceptors. The NpHR-injected mice, when illuminated with 1.1–1.7 mW/mm2 light, had a 69% increase (P = 0.0043, effect size = 0.802) in their von Frey withdrawal thresholds (Fig. 3c). In addition, low intensities of yellow light (0.15 mW/mm2) were sufficient to increase Hargreaves withdrawal latency by 97% (P = 0.00019, effect size = 2.05, Fig. 3d). Wild-type mice showed no significant change in behavior upon illumination with yellow light.
Finally, we determined if our ability to optogenetically inhibit nociception could inhibit neuropathic pain. We performed baseline von Frey and Hargreaves testing on NpHR-injected mice, replicating our initial findings that yellow light desensitized mice to mechanical and thermal stimuli (Fig 3e, f). We then performed a chronic constriction injury21 to induce symptoms of neuropathic pain in these mice. As expected, mice showed thermal and mechanical allodynia following the injury. We then illuminated mice with yellow light while performing von Frey and Hargreaves testing. We observed that optogenetic inhibition could reverse mechanical allodynia, increasing von Frey thresholds from 36% to 94% of pre-injury, non-illuminated levels (P = 0.0020, effect size = 0.920, Fig. 3e). Optogenetic inhibition also reversed thermal hyperalgesia in NpHR injected mice, increasing Hargreaves withdrawal latency from 55% to 128% of normal, non-illuminated levels (P = 0.012, effect size = 1.91, Fig. 3f). In both cases, YFP injected controls showed no significant changes with illumination, either before or after chronic constriction injury.
In aggregate these findings show that opsins can be expressed with high specificity in nociceptors through a relatively simple injection procedure that does not require transgenesis. The resulting opsin transduction efficiency is sufficient to enable non-invasive transdermal light-mediated control of nociceptor activity. This contrasts with previous efforts in our laboratory to control peripheral neurons in unanesthetized animals, which have required the use of implantable light delivery cuffs10.
The system described here may be used in several research applications. For example, it might facilitate rapid in vivo testing of the behavioral effects of novel opsin variants. As the optogenetic toolbox expands to include more opsins that are red-shifted22, and may therefore be activated by red light, which has greater penetration depth than blue light23, non-invasive approaches such as the one described here are also likely to be more widely adopted for study of the peripheral nervous system. In addition, this system may be used to screen for compounds that inhibit or exacerbate pain by providing for a non-invasive method to specifically stimulate nociceptors, and measure the effect of pharmacological intervention on the resulting pain response. Lastly, it might be used by scientists who seek new methods to perturb nociceptor activity. Here, we restricted our optogenetic intervention to short-duration stimuli, thereby only controlling acute pain perception. In the future, an optogenetic approach could be used to selectively increase or decrease nociceptor activity in a more chronic manner, using opsins that have been engineered to act on longer time-scales24. Alternatively, recently developed systems to optogenetically control gene expression may be used in concert with AAV6 to control endogenous transcription in nociceptors25. Combining Cre-inducible AAVs carrying doublefloxed inverted opsin (DIO)26 genes with transgenic nociceptor sub-type specific Cre-expressing mouse lines would allow researchers to rapidly use novel opsins while also providing intersectional specificity greater than the broad nociceptor-wide control reported here.
Although this system may also be adapted for future therapeutic use, a number of challenges currently block clinical translation of optogenetic techniques13. In the context of optogenetic control of pain, two major challenges are light delivery and persistent opsin expression. Transdermal optogenetic control of nociceptors may be affected by variation in skin pigmentation, or by the effect of greater skin thickness in larger organisms. Estimates of nociceptor depth in non-human primates vary, with one study finding a mean depth of 201μm27. Such depths may lie within the range of effective light penetration through human skin (blue light has been estimated to attenuate by 63% at a depth of 500 μm23). Another important challenge is achieving more persistent opsin expression; this will likely involve testing whether other AAV variants have similar expression profiles, but can achieve more persistent expression. AAV1, which has high sequence similarity to AAV628, but which has been reported to exhibit less shutdown20, may be a plausible candidate for such work. Regardless, these findings represent an initial proof-of-concept for future efforts to use non-invasive transdermal light as a treatment for chronic pain.
Online Methods
Animal test subjects and experiments
All surgical and behavioral procedures were approved by the Stanford University Administrative Panel on Lab Animal Care. Female C57BL/6 mice (1 – 4 months old) were housed in groups of 5 under a 12:12 light:dark cycle. Food and water were available ad libitum.
Within a cage, mice were not randomly assigned to experimental groups, however, cages themselves were assigned to experimental groups prior to any observation of the mice to remove the potential for randomization error. In all cases, controls and experimental groups were age-matched.
General statistical methods
In cases where data were known to be drawn from a non-normal distribution (von Frey measures of mechanical withdrawal), non-parametric tests were used. Paired tests were used for all data analysis except for comparing group percentage changes in the place aversion test. In that case, a homoscedastic test was used as the two populations had similar variance (measured using Levene’s test). All behavioral data presented except for the chronic constriction injury experiments were replications of small-sample pilot experiments. Due to humane concerns, chronic constriction injury experiments were performed only once, but with sufficient sample size to allow for adequate statistical power. These results were consistent across two groups of two cages of YFP+ and NpHR+ mice, which were tested separately on different days. Sample sizes were estimated using α = 0.05 and power (1−β) = 0.8. Based on pilot experiments, an effect size of 0.5 was assumed for all behavioral experiments resulting in a sample size of approximately 10 mice per group, with the exception of initial NpHR-mediated increase in mechanical withdrawal thresholds, where a lower effect size of 0.4 was used, resulting in a sample size of approximately 20 mice per group.
Inclusion/exclusion criteria
Mice were only excluded during tests of the chronic constriction injury condition. The efficacy of the chronic constriction injury procedure was assessed using the von Frey test for measurement of the mechanical withdrawal threshold. Mice that did not show a reduction in un-illuminated von Frey threshold following CCI were excluded from later analysis.
Intra-sciatic injection of rAAV2/6-hSyn-ChR2(H134R)-eYFP and rAAV2/6-hSyn-eNpHR3.0-eYFP
Virus preparation
AAV6 was chosen as a viral vector due to its previously described specificity for nociceptive neurons following intra-sciatic injection18. To create the vector, the CaMKIIa promoter from the construct pAAV-CaMKIIa-hChR2(H134R)-EYFP used in Lee et al.29 was replaced by the 450 bp human synapsin promoter at the MluI/BamHI sites to generate pAAV-hSyn-hChR2(H134R)-EYFP using standard molecular biology techniques. The ChR2(H134R) mutant was used as it has higher photocurrents than wild-type ChR212. Human synapsin was chosen as a promoter as it has previously been shown to result in neuron-specific transduction30. The plasmid map and DNA is available at http://www.stanford.edu/group/dlab/optogenetics/sequence_info.html. This plasmid was packaged as an AAV6 virus by the UNC Vector Core; the virus can be ordered at http://genetherapy.unc.edu/services.htm. The titer was determined by a dot-blot technique to measure viral capsids.
Surgical procedures
Mice were anesthetized with 2–2.5% isoflurane and given 0.1 mg carprofen via subcutaneous injection, placed on a heating pad maintained at 37°C, and allowed to reach a stable plane of anesthesia, which was periodically checked through examination of breathing rate and a toe-pinch test. The incision site (described below) was cleared of fur and sterilized with alternating applications of ethanol and Betadine solution. After the mouse legs were taped to the surgical table, sterilized forceps and spring scissors were then used to make a 2 cm incision at the level of the sciatic nerve. The sciatic nerve cavity was exposed by cutting the connective tissue between the gluteus superficialis and biceps femoris muscles and kept open with retractors. The nerve was carefully freed from the underlying fascia using blunted micromanipulators and spring scissors. 100 μl of 0.25% Bupivacaine was injected into the incision site to simultaneously prevent the nerve from drying and induce local anesthesia. A 35G beveled needle (Nanofil# NF35BV-2, World Precision Instruments) was inserted under the epineurium of the nerve, and 2.5–4 μl of virus solution (see below for quantities of virus injected) injected at 1 μl/min, using a 25 μl syringe (Hamilton Company), connected to a Harvard PHD Syringe pump (Harvard Apparatus). Care was taken to minimize damage to the nerve as much as possible. Two separate injections were made into the common peroneal and tibial branches of the sciatic nerve, to ensure that the nerve was filled uniformly. rAAV6-hSyn-ChR2-eYFP-injected mice received 3×10¹⁰ vector genomes (vg) (from UNC Vector Core), and rAAV6-hSyn-eNpHR3.0-eYFP-injected mice received either 1×10¹¹ vg or 3×10¹¹ vg (from UNC Vector Core and Virovek, respectively). Depending on the mouse, this procedure was performed either unilaterally or bilaterally. The incision was then sutured closed using 5-0 suture.
Isolation, culture and electrophysiology of opsin-expressing DRG neurons
Isolation of DRG
DRG excision, culture and electrophysiology procedures were largely based on previously reported protocols31. Three to four weeks after intra-sciatic injection, mice were deeply anesthetized with isoflurane 5% and fur was shaved from the back. Mice were then perfused with 4°C sterile phosphate buffered saline. The following isolation steps were rapidly performed, and completed within 5 minutes after perfusion. After removing the skin from the back, using sterile procedure, the muscles along the vertebral column were cut and bone rongeurs used to peel away any muscle or tendon superficial to the vertebrae. The rongeurs were used to break away the vertebral bone directly dorsal to the spinal cord, starting at the base of the spine, and moving rostrally. Muscle lateral to the spinal cord was peeled away until the sciatic nerve branches could be visualized, and bones were broken lateral to the spinal cord to free the path of the nerve. Each nerve branch was cut using small spring scissors, pulled proximally with forceps until the dorsal root ganglion could be visualized, and cut proximal to the DRG. The DRG was then placed in 4°C, sterile MEM-complete solution (minimal essential media, MEM vitamins, antibiotics, and 10% fetal bovine serum). Three DRGs were excised from each opsin-expressing side of the mouse.
DRG culture
Excised DRGs were desheathed and transferred to MEM-Collagenase solution (minimal essential media, 100X MEM vitamins, antibiotics, no fetal bovine serum, 0.125% collagenase). The tissue was incubated at 37°C for 45 minutes in a water bath and then mechanically disrupted (triturated) in 2.5 ml TrypLE Express (Invitrogen). The trypsin was quenched with 2.5 ml MEM-complete with 80 ug/ml DNase I, 100 ug/ml trypsin inhibitor from chicken egg white and 2.5mg/ml MgSO4. Cells were centrifuged, and resuspended in MEM-complete at a cell density of 500,000 cells/ml. 100 ul of the cell suspension was carefully placed as a droplet on matrigel-coated coverslips, and then incubated at 37°C, 3% CO2, 90% humidity. Two hours after initial incubation, the cultured neurons were flooded with 1 ml of MEM-complete. Cells were maintained 2–7 days in culture with fresh media changes as needed until electrophysiology was performed.
Electrophysiology
A Spectra X Light engine (Lumencor) or DG4 xenon lamp (Sutter Instruments) was used to identify fluorescent protein expression, and to deliver light pulses for opsin activation. A 475/28 filter was used to apply blue light to stimulate ChR2, and a 586/20 filter was used to apply yellow light to stimulate NpHR. Light power density through the microscope objective was measured with a power meter (ThorLabs). Whole-cell recordings were obtained with patch pipettes (4–6 MΩ) pulled from borosilicate glass capillaries (Sutter Instruments) with a horizontal puller (P-2000, Sutter Instruments). The external recording solution contained (in mM): 125 NaCl, 2 KCl, 2 CaCl2, 2MgCl2, 30 glucose, 25 HEPES, and 1 μM tetrodotoxin when necessary to eliminate escape spikes for peak photocurrent measurements. The internal recording solution contained (in mM): 130 K-gluconate, 10 mM KCl, 10 HEPES, 10 EGTA, 2 MgCl2. Recordings were made using a MultiClamp700B amplifier (Molecular Devices), and pClamp10.3 software (Molecular Devices) was used to record and analyze data. Signals were filtered at 4 kHz using a Bessel filter and digitized at 10 kHz with a Digidata 1440A analog–digital interface (MolecularDevices). Peak and steady-state photocurrents were measured from a 1 s light pulse in voltage-clamp mode, where cells were held at −50 mV. Series resistances were carefully monitored and recordings were not used if the series resistance changed significantly (by >20%) or reached 20 MΩ.
Latency to light measurement
Experimental protocol
Approximately 1 to 5 weeks after intra-sciatic injection, mice were placed in a plastic enclosure with a thin, transparent, plastic floor and allowed to habituate to the test setup for 30 minutes prior to testing. A multimode optical fiber (Thor Labs, #AFS105/125Y) attached to a laser (OEM Laser Systems, 473 nm, 1 mW/mm2) was directed at the footpad through the floor. To begin the trial, the animal was required to: (1) be awake, (2) have all four paws on the floor, and (3) be at rest, not preparing to walk. Latency was calculated from when the footpad was illuminated to when the paw was withdrawn. To avoid experimenter bias, no subjective criteria were applied to the end-point for latency calculation, i.e. normal ambulation was also considered to end the trial. A maximum latency of 1 minute was set to ensure practicality of data collection. Individual trials were at least 2 minutes apart, and each mouse had five trials, which were averaged together. All trials were video recorded at 30 frames per second and latencies calculated through video analysis post-collection.
Statistics
A one-way ANOVA was used to analyze changes in latency observed in rAAV6-hSyn-ChR2-eYFP-injected mice to blue light in weeks 1–5 compared with response to yellow light. Dunnett’s post-hoc multiple-comparisons test was used to determine which latencies were significantly different from yellow-light controls. Effect sizes were calculated using gψ an extension of Hedges’ g for multiple groups32.
Place aversion
Construction of two chamber place aversion setup
A two chamber place setup was built with an entryway connecting the two 10 cm × 12 cm chambers. The floor of each chamber, one red, the other blue, was illuminated with a 10 × 12 array of light-emitting diodes (Blue LEDs: 475 nm, Red LEDs: 625 nm, Cree) and directed with mirrors such that the light power density was equivalent in each room (0.25 mW/mm2). This was done to ensure that our results would be unaffected by any preference the mice had for dark environments.
Experimental protocol
A single mouse was allowed to explore the two chambers for 10 minutes prior to testing with the LED array floors turned off. Then, the mouse’s location was recorded using a video camera and analyzed using BIOBSERVE Viewer 2. The mouse position was recorded with the lights off for 10 minutes, and then the lights were switched on, and the position recorded for a further 30 minutes.
Statistics
A two-sided paired Student’s t-test was used to examine whether changes in mouse position preference between the ‘lights-off’ and ‘lights-on’ condition were statistically significant. The percentage change between the two conditions was then calculated for each rAAV6-hSyn-ChR2-eYFP-injected and rAAV6-hSyn-eYFP-injected mouse. Levene’s test for heteroscedasticity was used to determine that homoscedastic tests could be used to compare these two changes (P = 0.38). These percentages were then compared using a two-sided, unpaired, Student’s t-test for homoscedastic populations. Effect sizes were calculated using Hedges’ g.
Measurement of mechanical withdrawal thresholds
Mechanical allodynia was investigated through von Frey testing. Mice were allowed to habituate to the test setup for 1 hour prior to testing. Hairs of various forces were applied to the bottom of the paw using the up-and-down method33,34 for approximately 2 seconds.
We considered the appearance of any of the following behaviors as a withdrawal response: (1) rapid flinch or withdrawal of the paw, (2) spreading of the toes, or (3) immediate licking of the paw. If the animal moved the paw for some other reason before the end of the 2 seconds, the test was considered ambiguous and repeated. Depending on the opsin used, we then performed simultaneous illumination of the mouse’s paw with blue light (473 nm, 0.15 mW/mm2) or yellow light (593 nm, 1.1–1.7 mW/mm2). The von Frey test was conducted by a single examiner for all data collected, who was always blinded to whether the mice being tested had opsin expression or not.
Statistics
Changes in von Frey threshold were tested for statistical significance using the non-parametric two-sided Wilcoxon signed-rank test. Effect sizes were calculated using Hedges’ g.
Measurement of thermal withdrawal latency
We used a modified Hargreaves plantar test apparatus to measure changes in thermal sensitivity with different types of illumination. We slightly raised the standard Hargreaves test glass plate to allow placement of an LED ring above the infrared emitter. The LED ring was calibrated to emit 0.15 mW/mm2 of blue (475 nm, Cree) or yellow (590 nm, OSRAM Opto Semiconductors) light. To control for light-induced confounds, we compared withdrawal latency to infrared heat when mice received on-spectrum illumination (blue light for rAAV6-hSyn-ChR2-eYFP-injected mice, and yellow light for rAAV6-hSyn-NpHR-eYFP-injected mice) with off-spectrum illumination (vice versa). Withdrawal latency was measured between onset of infrared light and the first paw withdrawal. Infrared intensity was kept constant across all trials, and the tester was always blinded as to whether the mice being tested had opsin expression or not.
Statistics
Changes in thermal withdrawal latency were compared between off-spectrum and on-spectrum illumination conditions using a two-sided, paired, Student’s t-test. Effect sizes were calculated using Hedges’ g.
Chronic constriction injury
The chronic constriction injury model used here was adapted from an existing protocol35. Animals were anesthetized with isoflurane and the sciatic nerve was exposed unilaterally in a similar fashion to the sciatic nerve exposure used for the intra-sciatic injections. One 7-0 prolene double-knot ligature was tied around the nerve such that the ligature was just able to slide along the nerve, and the free ends of the suture were cut short. Non-absorbable 5-0 suture was used to close the wound. In order to promote development of neuropathic pain, no post-operative analgesics were administered.
Immunohistochemistry, imaging, and quantification of transduction
Immunohistochemistry
Mice were euthanized with 100 μl Beuthanasia-D, and transcardially perfused with 10 ml of 4°C phosphate-buffered saline (1X PBS) and 10 ml of 4% paraformaldehyde (PFA). Bone rongeurs, spring scissors and forceps were used to carefully remove the sciatic nerve, associated dorsal root ganglia and the spinal cord together from the mouse. The paws were removed separately. All tissue was placed in 4% PFA overnight, stored at 4°C. Following this, samples were transferred to 30% sucrose (in 1X PBS) and stored for varying lengths of time (at minimum 1 day). Samples were later dissected under microscopic guidance, and frozen separately in Tissue-Tek O.C.T. Samples were cut at 20 μm thickness using a cryostat (Leica CM3050S), and mounted on slides. All samples were thoroughly rinsed in PBS to remove any residual OCT. For all targets except myelin, samples were then blocked in 0.3% Triton-X100, 2% Normal Donkey Serum (NDS), dissolved in PBS for 1 hour. Samples were then incubated overnight with primary antibody solutions with 0.3% Triton-X100, 5% NDS, dissolved in PBS. The next day, samples were rinsed in PBS and incubated for 1 hour with secondary antibody solutions in PBS. Samples were then rinsed in PBS and coverslipped with PVA DABCO. Primary antibodies used were Rat anti-Substance P (1:500, #556312, BD Pharmingen), Rabbit anti-CGRP (1:5000, #C8198, Sigma-Aldrich), Biotin-IB4 (1:50, #B-1205, Vector Laboratories), Rabbit anti-NF200 (1:100, #N4142, Sigma-Aldrich), Rabbit anti-GFAP (1:1000, #7260, Abcam), and Rabbit anti-Iba1 (1:400, #019-19741, Wako). Secondary antibodies used were Cy5 Donkey anti-Rabbit (1:500, # 711-175-152, Jackson Laboratories), Cy3 Donkey anti-Rabbit (1:500, 711-165-152), Cy3 Donkey anti-Rat (1:500, #711-165-152, Jackson Laboratories) and Streptavidin-Texas Red (3:100, #SA-5006, Vector Laboratories). For myelin staining, samples were incubated with FluoroMyelin Red (1:300, #F34652, Molecular Probes) for 20 min, rinsed in PBS, and then coverslipped with PVA DABCO.
Confocal imaging
Samples were imaged using a Leica TCS SP5 confocal scanning laser microscope, using 20X, 40X and 63X oil immersion objectives, and analyzed using Leica LAS AF software. Images were later processed using Fiji, and image brightness and contrast were adjusted as required.
Quantification
We examined DRGs from 5 mice injected with rAAV6-hSyn-ChR2-eYFP and 5 mice injected with rAAV6-hSyn-NpHR-eYFP for co-expression of eYFP with Substance P, CGRP, IB4 and NF200. We examined nerve samples from three mice injected with rAAV6-hSyn-ChR2-eYFP and three mice injected with rAAV6-hSyn-NpHR-eYFP for co-expression of eYFP with myelin. For 12 week post-injection mice, we examined sciatic nerve sections from all 5 mice injected with rAAV6-hSyn-ChR2-eYFP.
Supplementary Material
Acknowledgments
We thank Holly Liske, Xiang Qian, Sean Mackey, Andrew Weitz, David J. Clark, David C. Yeomans, Peyman Sabhaie, Christopher Gorini, Stephanie Young and Helena Scutt for useful discussions and assistance with experiments. This study was supported by the U.S. National Institutes of Health (NINDS R01-NS080954), the Stanford Bio-X NeuroVentures program and the Stanford Bio-X Inter-disciplinary Initiatives program. S.M.I. was supported by an Office of Technology Licensing Stanford Graduate Fellowship and by a Howard Hughes Medical Institute International Student Research Fellowship. K.L.M. was supported by a Bio-X Bioengineering Graduate Fellowship and by a Stanford Interdisciplinary Graduate Fellowship. C.T. was supported by a Swiss National Science Foundation Fellowship.
Footnotes
Contributions: S.M.I., K.L.M., C.T. and S.L.D. designed the experiments. S.M.I. and K.L.M. performed the experiments. C.R. performed cell culture and created vectors. S.Y.L. performed electrophysiology. K.D. contributed reagents/tools. S.M.I., K.L.M. and S.L.D. wrote and edited the paper, with comments from all other authors.
Conflict of interest: C.T., K.D., and S.L.D. have a financial interest in Circuit Therapeutics, Inc., which, however, did not support this work. S.M.I., K.L.M., C.T., K.D. and S.L.D. have disclosed these findings to the Stanford Office of Technology Licensing for potential use in the identification of new treatments for pain.
References
- 1.Dubin AE, Patapoutian A. Review series Nociceptors: the sensors of the pain pathway. J Clin Invest. 2010;120:3760–3772. doi: 10.1172/JCI42843. [DOI] [PMC free article] [PubMed] [Google Scholar]
- 2.Fenno L, Yizhar O, Deisseroth K. The Development and Application of Optogenetics. Annu Rev Neurosci. 2011;34:389–412. doi: 10.1146/annurev-neuro-061010-113817. [DOI] [PMC free article] [PubMed] [Google Scholar]
- 3.Liske H, et al. Optical inhibition of motor nerve and muscle activity in vivo. Muscle Nerve. 2013;47:916–921. doi: 10.1002/mus.23696. [DOI] [PMC free article] [PubMed] [Google Scholar]
- 4.Llewellyn ME, Thompson KR, Deisseroth K, Delp SL. Orderly recruitment of motor units under optical control in vivo. Nat Med. 2010;16:1161–5. doi: 10.1038/nm.2228. [DOI] [PMC free article] [PubMed] [Google Scholar]
- 5.Ji ZG, et al. Light-evoked somatosensory perception of transgenic rats that express channelrhodopsin-2 in dorsal root ganglion cells. PLoS One. 2012;7:e32699. doi: 10.1371/journal.pone.0032699. [DOI] [PMC free article] [PubMed] [Google Scholar]
- 6.Wang H, Zylka MJ. Mrgprd-expressing polymodal nociceptive neurons innervate most known classes of substantia gelatinosa neurons. J Neurosci Off J Soc Neurosci. 2009;29:13202–9. doi: 10.1523/JNEUROSCI.3248-09.2009. [DOI] [PMC free article] [PubMed] [Google Scholar]
- 7.Mourot A, et al. Rapid optical control of nociception with an ion-channel photoswitch. Nat Methods. 2012;9:396–402. doi: 10.1038/nmeth.1897. [DOI] [PMC free article] [PubMed] [Google Scholar]
- 8.Kokel D, et al. Photochemical activation of TRPA1 channels in neurons and animals. Nat Chem Biol. 2013;9:257–263. doi: 10.1038/nchembio.1183. [DOI] [PMC free article] [PubMed] [Google Scholar]
- 9.Enlightened engineering. Nat Biotechnol. 2011;29:849–849. doi: 10.1038/nbt.2016. [DOI] [PubMed] [Google Scholar]
- 10.Towne C, Montgomery KL, Iyer SM, Deisseroth K, Delp SL. Optogenetic Control of Targeted Peripheral Axons in Freely Moving Animals. PLoS One. 2013;8:e72691. doi: 10.1371/journal.pone.0072691. [DOI] [PMC free article] [PubMed] [Google Scholar]
- 11.Daou I, et al. Remote Optogenetic Activation and Sensitization of Pain Pathways in Freely Moving Mice. J Neurosci. 2013;33:18631–18640. doi: 10.1523/JNEUROSCI.2424-13.2013. [DOI] [PMC free article] [PubMed] [Google Scholar]
- 12.Mattis J, et al. Principles for applying optogenetic tools derived from direct comparative analysis of microbial opsins. Nat Methods. 2012;9 doi: 10.1038/nmeth.1808. [DOI] [PMC free article] [PubMed] [Google Scholar]
- 13.Williams JC, Denison T. From optogenetic technologies to neuromodulation therapies. Sci Transl Med. 2013;5:177ps6. doi: 10.1126/scitranslmed.3003100. [DOI] [PubMed] [Google Scholar]
- 14.Chow BY, Boyden ES. Optogenetics and translational medicine. Sci Transl Med. 2013;5:177ps5. doi: 10.1126/scitranslmed.3003101. [DOI] [PubMed] [Google Scholar]
- 15.Towne C, Schneider BL, Kieran D, Redmond DE, Aebischer P. Efficient transduction of non-human primate motor neurons after intramuscular delivery of recombinant AAV serotype 6. Gene Ther. 2009 doi: 10.1038/gt.2009.119. [DOI] [PubMed] [Google Scholar]
- 16.San Sebastian W, et al. Adeno-associated virus type 6 is retrogradely transported in the non-human primate brain. Gene Ther. 2013 doi: 10.1038/gt.2013.48. [DOI] [PMC free article] [PubMed] [Google Scholar]
- 17.Asokan A, Schaffer DV, Samulski RJ. The AAV vector toolkit: poised at the clinical crossroads. Mol Ther. 2012;20:699–708. doi: 10.1038/mt.2011.287. [DOI] [PMC free article] [PubMed] [Google Scholar]
- 18.Towne C, Pertin M, Beggah AT, Aebischer P, Decosterd I. Recombinant adeno-associated virus serotype 6 (rAAV2/6)-mediated gene transfer to nociceptive neurons through different routes of delivery. Mol Pain. 2009;5:52. doi: 10.1186/1744-8069-5-52. [DOI] [PMC free article] [PubMed] [Google Scholar]
- 19.Mogil JS. Animal models of pain: progress and challenges. Nat Rev Neurosci. 2009;10:283–294. doi: 10.1038/nrn2606. [DOI] [PubMed] [Google Scholar]
- 20.Mason MRJ, et al. Comparison of AAV serotypes for gene delivery to dorsal root ganglion neurons. Mol Ther J Am Soc Gene Ther. 2010;18:715–24. doi: 10.1038/mt.2010.19. [DOI] [PMC free article] [PubMed] [Google Scholar]
- 21.Bennett GJ, Xie YK. A peripheral mononeuropathy in rat that produces disorders of pain sensation like those seen in man. Pain. 1988;33:87–107. doi: 10.1016/0304-3959(88)90209-6. [DOI] [PubMed] [Google Scholar]
- 22.Lin JY, Knutsen PM, Muller A, Kleinfeld D, Tsien RY. ReaChR: a red- shifted variant of channelrhodopsin enables deep transcranial optogenetic excitation. Nat Neurosci. 2013 advance on. [Google Scholar]
- 23.Bashkatov AN, Genina EA, Kochubey VI, Tuchin VV. Optical properties of human skin, subcutaneous and mucous tissues in the wavelength range from 400 to 2000 nm. J Phys D Appl Phys. 2005;38:2543–2555. [Google Scholar]
- 24.Yizhar O, et al. Neocortical excitation/inhibition balance in information processing and social dysfunction. Nature. 2011;477:171–8. doi: 10.1038/nature10360. [DOI] [PMC free article] [PubMed] [Google Scholar]
- 25.Konermann S, et al. Optical control of mammalian endogenous transcription and epigenetic states. Nature. 2013;500:472–6. doi: 10.1038/nature12466. [DOI] [PMC free article] [PubMed] [Google Scholar]
- 26.Sohal VS, Zhang F, Yizhar O, Deisseroth K. Parvalbumin neurons and gamma rhythms enhance cortical circuit performance. Nature. 2009;459:698–702. doi: 10.1038/nature07991. [DOI] [PMC free article] [PubMed] [Google Scholar]
- 27.Tillman DB, Treede RD, Meyer RA, Campbell JN. Response of C fibre nociceptors in the anaesthetized monkey to heat stimuli: estimates of receptor depth and threshold. J Physiol. 1995;485:753–65. doi: 10.1113/jphysiol.1995.sp020766. [DOI] [PMC free article] [PubMed] [Google Scholar]
- 28.Gao GP, et al. Novel adeno-associated viruses from rhesus monkeys as vectors for human gene therapy. Proc Natl Acad Sci U S A. 2002;99:11854–9. doi: 10.1073/pnas.182412299. [DOI] [PMC free article] [PubMed] [Google Scholar]
- 29.Lee JH, et al. Global and local fMRI signals driven by neurons defined optogenetically by type and wiring. Nature. 2010;465:788–92. doi: 10.1038/nature09108. [DOI] [PMC free article] [PubMed] [Google Scholar]
- 30.Kügler S, Kilic E, Bähr M. Human synapsin 1 gene promoter confers highly neuron-specific long-term transgene expression from an adenoviral vector in the adult rat brain depending on the transduced area. Gene Ther. 2003;10:337–47. doi: 10.1038/sj.gt.3301905. [DOI] [PubMed] [Google Scholar]
- 31.Gold MS. In: Pain Res Methods Mol Biol. Luo ZD, editor. Vol. 851. Humana Press; 2012. pp. 73–97. [DOI] [PubMed] [Google Scholar]
- 32.Hentschke H, Stüttgen MC. Computation of measures of effect size for neuroscience data sets. Eur J Neurosci. 2011;34:1887–94. doi: 10.1111/j.1460-9568.2011.07902.x. [DOI] [PubMed] [Google Scholar]
- 33.Chaplan SR, Bach FW, Pogrel JW, Chung JM, Yaksh TL. Quantitative assessment of tactile allodynia in the rat paw. J Neurosci Methods. 1994;53:55–63. doi: 10.1016/0165-0270(94)90144-9. [DOI] [PubMed] [Google Scholar]
- 34.Dixon WJ. Efficient Analysis of Experimental Observations. Annu Rev Pharmacol Toxicol. 1980;20:441–462. doi: 10.1146/annurev.pa.20.040180.002301. [DOI] [PubMed] [Google Scholar]
- 35.Sommer C, Schäfers M. Painful mononeuropathy in C57BL/Wld mice with delayed Wallerian degeneration: differential effects of cytokine production and nerve regeneration on thermal and mechanical hypersensitivity. Brain Res. 784:154–162. doi: 10.1016/s0006-8993(97)01327-9. [DOI] [PubMed] [Google Scholar]
Associated Data
This section collects any data citations, data availability statements, or supplementary materials included in this article.