

Abstract
Rationale
Previous work has indicated that implicit attentional biases to alcohol-related cues are indicative of susceptibility to alcohol dependence and escape drinking, or drinking to avoid dysphoric mood or emotions.
Objective
The goal of the current study was to examine whether alcohol dependence and escape drinking were associated with early neural attentional biases to alcohol cues.
Methods
EEG data were recorded from 54 college students who reported that they regularly drank alcohol, while they viewed alcohol and control pictures that contained human content (active) or no human content (inactive).
Results
Those who were alcohol dependent showed more neural attentional bias to the active alcohol-related stimuli than to the matched control stimuli early in processing, as indicated by N1 amplitude. Escape drinkers showed greater neural attention to the active alcohol cues than non-escape drinkers, as measured by larger N2 amplitudes.
Conclusions
While alcohol dependence is associated with enhanced automatic attentional biases early in processing, escape drinking is associated with more controlled attentional biases to active alcohol cues during a relatively later stage in processing. These findings reveal important information about the time-course of attentional processing in problem drinkers and have important implications for addiction models and treatment.
Keywords: attentional bias, alcohol, ERPs, escape drinking, problem drinking
Alcohol abuse is one of the most prevalent health problems among college students, with 30–45% of students reporting excessive drinking (Hingson, Zha, & Weitzman, 2009; Miller, Naimi, Brewer & Everett Jones, 2007; Wechsler, Davenport, Dowdall, Moeykens, & Castillo, 1994). In addition to leading to accidental injuries as well as physical and sexual assaults (Hingson et al., 2009), excessive drinking during college can lead to chronic alcoholism later in life (Kessler et al., 2005; Grant & Dawson, 1998; Li et al., 2004; Hingson et al., 2006). Thus, understanding how problem drinking develops and is perpetuated in young adults is an important research question.
Prominent models of addiction suggest that repeated drug exposure, such as excessive drinking, leads to enhanced attention to drug-related stimuli, which in turn contributes to dependence. Three leading theories have sought to explain how repeated drug use can lead to increased attention to drug-related cues. First, the schema-based theory posits that drug-taking becomes an automatic process that results in difficulty inhibiting drug administration in the presence of triggering stimuli (Tiffany, 1990). According to the motivational theory of current concerns, (Cox, Fadardi & Pathos, 2006; Klinger & Cox, 2004) drug-related thoughts become prioritized in the cognitive system as a function of their rewarding properties. This, in turn, causes the drug and its related stimuli to be difficult to ignore (Fadardi & Cox, 2006). Finally, according to the incentive salience theory, drugs, such as alcohol and their related cues, become more salient, attractive, and attention-grabbing because their consumption leads to increased drug-induced dopaminergic responses in brain areas such as the nucleus accumbens over time (Robinson & Berridge, 2000, 2008; Wise, 1998).
While they differ in their ability to explain neural mechanisms, these theories are consistent in that they recognize that addiction is associated with attention-grabbing properties of drug-related stimuli (or triggers) in the environment. In support of this, studies have consistently shown that individuals who drink heavily demonstrate enhanced attentional biases to alcohol-related cues (Bauer & Cox, 1998; Fernie, Christiansen, Cole, Rose, & Field, 2012; Johnsen, Laberg, Cox, Vaksdal & Hugdahl., 1994; Sharma, Albery, & Cook, 2001; Stetter, Ackermann, Bizer, Straube & Mann, 1995; Stormark, Laberg, Nordby & Hugdahl, 2000; Townshend & Duka, 2001). A number of behavioral studies have also demonstrated that those who are alcohol-dependent show greater implicit attentional bias to alcohol-related cues than non-dependent heavy drinkers (Cox, Fadardi, & Pothos, 2006; Field, Mogg, Zetteler, & Bradley, 2004; Field, Mogg, Mann, Bennett, & Bradley, 2013; Jones, Jones, Smith, & Copley, 2003; Noël et al., 2006; Townshend & Duka, 2001), suggesting that attentional bias may be associated with dependence (for reviews see Field & Cox, 2008; Franken, 2003; Robbins & Ehrman, 2004). Furthermore, there is evidence that attentional bias is associated with drug craving and drug-seeking behaviors (Field & Eastwood, 2005), leading to difficulty in abstaining from alcohol in those trying to quit (Waters et al., 2003; Williams, Mathews, & MacLeod, 1996).
Problem alcohol consumption is often associated with specific reasons for drinking (Beck, Summons, & Thombs, 1991). For example, escape drinking, or drinking to avoid negative mood (Cahalan, Cisin, & Crossley, 1969), has been shown to be associated with heavy drinking (Williams & Clark, 1998) and other alcohol-related problems (Abbey, Smith, & Scott, 1993; Farber, Khavari, & Douglass, 1980), independent of consumption levels (Polich & Orvis, 1979). Previous research in our laboratory has shown that implicit behavioral attentional biases can be associated with escape drinking habits over and above that predicted by risk for dependence (Forestell, Dickter & Young, 2012) in a college sample. This research demonstrated that although escape drinkers were more likely to report a family history of alcoholism and be dependent on alcohol than non-escape drinkers (e.g., Cahalan et al., 1969; Farber et al., 1980; Jung, 1977; Mennella & Forestell, 2008), when these factors were controlled, escape drinkers displayed a significantly stronger attentional bias for alcohol-related cues than non-escape drinkers for certain alcohol-related cues (Forestell et al., 2012).
Specifically, Forestell et al. (2012) reported that attentional biases differed according to the type of stimulus presented and the duration of presentation. In this study, two types of alcohol-related cues, those depicted alone (i.e., inactive cues, such as a bottle of beer) and those that involved a human interacting with the cue (i.e., active cues, such as a person holding a bottle of beer), were presented with matched controls in a dot probe task. When participants were asked to respond to these cues after they were presented for 2000 ms, escape drinking was correlated with attentional bias only for the inactive cues, whereas when cues were presented for 500 ms, escape drinking was correlated with attentional biases for active stimuli. These findings suggest that depending on the type of cue, escape drinkers may demonstrate either initial orientation or maintained attention to alcohol-related cues. According to psychophysiological work, the brain processes active and inactive scenes differently, with scenes that contain people yielding greater processing than those that contain objects alone (e.g., Allison et al., 1994; Bentin, Allison, Puce & McCarthy, 1996; Bobes, Valdés-Sosa, & Olivares, 1994; Vanrullen & Thorpe, 2001). Therefore, while the presence of humans in the active pictures may have captured all participants’ early attention, those with higher escape scores may have focused more of their initial attention on the scene containing the alcohol-related cue due to its reinforcing qualities. While escape drinkers may orient their initial attention to active alcohol-related cues, it appears that they may maintain their attention to the inactive cues.
In the present study we sought to extend the behavioral results reported above to measure electrophysiological responses to alcohol-related stimuli. To date, drug-related work that has focused on attentional processing has measured event-related potentials (ERPs), which allow for the examination of how dependence affects the time-course of the cognitive processes associated with attention. These studies have demonstrated that the P3 response, which is thought to reflect attentional allocation to motivationally salient stimuli (Polich, 2012; Polich & Kok, 1995), is enhanced to drug-related stimuli in addicts compared to controls (Littel, Euser, Munafò, & Franken, 2012).
Because early neural attention may interfere with the ability to inhibit alcohol administration (Tiffany, 1990) and may stimulate appetitive processes (Field & Powell, 2007) associated with further drinking, understanding how attentional bias unfolds over time contributes to our understanding of the mechanisms involved in problem drinking behavior. However, little research has investigated how drinking is associated with earlier ERP components, with the exception of a recent study by Petit and colleagues (2012). This study found that relative to control cues, alcohol cues elicited larger P1, but not N2, amplitudes in binge drinkers, who were defined as those who consumed six or more standard drinks three to four times per week at a rate of at least three drinks per hour. Amplitude differences at P1 were not observed in those who did not engage in binge drinking. As the P1 is an exogenous ERP component associated with automatic attention to motivationally relevant stimuli and the N2 is associated with more controlled attention, these results indicate that binge drinkers directed greater early unconscious but not conscious attention to alcohol cues compared to neutral cues.
Thus, the primary goal of the present experiment was to extend the results of Forestell et al. (2012) and Petit et al. (2012) by investigating how alcohol dependence and escape drinking affect the time-course of early attentional processes directed towards alcohol-related cues. To examine early attention to alcohol cues, college students viewed a series of alcohol and control pictures while EEG data were recorded. Because the P1, N1, and P2 components are thought to be exogenous and reflect automatic obligatory sensory responses occurring very quickly following an eliciting stimulus, it was hypothesized that those who were alcohol dependent would show larger P1, N1, and P2 amplitudes to the alcohol-related stimuli relative to the control stimuli, reflecting attention to alcohol cues that is beyond the control of participants. This hypothesis was based on Petit et al.’s (2012) findings that binge drinkers, who are at heightened risk for alcohol dependence (Bonomo et al., 2004), showed larger P1 amplitudes to alcohol stimuli.
In contrast, the N2 is an endogenous component that is associated with more controlled attention and is thought to reflect stimulus evaluation and decision-making (Dickter & Kieffaber, in press; Dickter & Bartholow, 2010; Luck & Kappenman, 2011; van Veen & Carter, 2002), as well as the processing of emotional stimuli (Carretié, Hinojosa, Martín-Loeches, Mercado, & Tapia, 2004). Because escape drinking involves emotional and motivational processing (Cahalan et al., 1969), it was hypothesized that escape drinkers would show larger N2 amplitudes to alcohol-related cues compared to those who were non-escape drinkers. Furthermore, because previous behavioral work has demonstrated that escape drinkers orient their initial attention to active alcohol-related cues (Forestell et al., 2012), we predicted that attentional biases as measured by early ERP components would be observed for active rather than inactive alcohol cues.
Method
Participants
Eighty-two (28 female) college students between the ages of 17 and 28 years (M = 19.29 years, SD = 1.79) who were enrolled in an Introduction to Psychology class at The College of William and Mary participated in this study for partial fulfillment of a course requirement between 2011 and 2013. All procedures were approved by the College’s Protection of Human Subjects Committee, and written informed consent was obtained from each participant.
Materials
Stimuli
The stimuli consisted of 120 color photographs (3264 × 2448 pixels), 60 of which were alcohol-related items or matched non-alcohol-related items. Thirty photographs depicted a stimulus in an active setting, in which a human was interacting with the stimulus (e.g., drinking from a beer bottle or a bottle of soda), whereas the remaining 30 photographs depicted a stimulus in an inactive scene, in which the stimulus was presented alone (e.g., a can of beer or juice). Active and inactive alcohol-related cues depicted the same proportion of pictures of beer, wine, and liquor. In all pictures, stimuli were presented against a black background. Non-alcohol pictures were created to resemble alcohol cues in terms of brightness, color, and object position. All pictures were pilot-tested with 10 undergraduate students to verify that the contents could be correctly identified and judged as alcohol- or non-alcohol-related. The average accuracy rate for alcohol and non-alcohol-related photographs was 97% ± 0.19 (Range: 80%–100%). Accuracy of identification did not differ between the alcohol-related and control stimuli, nor between the active and inactive stimuli (all p values > 0.05).
Questionnaires
In addition to completing a demographic questionnaire which asked participants to indicate their gender, age, and race, participants were also interviewed about their drinking habits and frequency of alcohol consumption. Each participant was asked whether they currently drank alcohol. If they were a drinker, they provided an account of the frequency of their recent drinking behavior by indicating the number, amount, and type of alcohol (i.e., beer, wine, and liquor) consumed on each drinking occasion over the previous three weeks using a time-line follow-back procedure (Sobell & Sobell, 1995). From these data, we estimated the number of standard drinks consumed over the previous three weeks. Additionally, participants completed an electronically-based questionnaire that included a variety of items to assess their drinking habits (e.g., when they drank, what they drank) as well as several validated questionnaires which are described below.
The Michigan Alcohol Screening Test (MAST; Selzer, 1971) was completed to assess dependence on alcohol by measuring alcohol-related problems and risk drinking over the course of the participants’ life. The MAST contains 25 questions regarding the severity of participants’ problem or risky drinking behaviors. They require participants to indicate whether or not they have ever experienced symptoms such as delirium tremens, and if they have been arrested for drunken behavior or driving under the influence of alcohol, or been in trouble at work or lost their job due to their alcohol use. This measure possesses good internal-consistency reliability, as indicated by Cronbach’s alpha coefficients of .83 to .93 (Gibbs, 1983). Answers to each question are assigned weighted values of zero, one, two, or five points. In the current study, a total score of eight or above (range 0–53) is classified as alcohol dependent.
The Escape Questionnaire is a 20-item questionnaire developed by Cahalan et al. (1969) as part of a national survey to determine the extent to which individuals consume alcohol to reduce stress and dysphoric feelings. Participants received one point for agreeing with any of the five following reasons for drinking: to forget their worries or problems, to help them to relax, to forget everything, to cheer themselves up when they are in a bad mood, or when they are tense and nervous. Thus, total escape scores could vary from 1–5. Additional questions that were not related to escape drinking included items such as “to alleviate pain” or “to celebrate special occasions.” According to Cahalan et al., a total score of two or greater on this scale is indicative of an escape drinking pattern and is associated with problem drinking. The questionnaire demonstrated high levels of internal consistency with our sample (KR-20 = 0.90).
Desires for Alcohol (DAQ; Clark, 1994)
The DAQ is a 14-item measure of craving for alcohol that consists of a three factor structure for recreational drinkers (Love, James & Willner, 1996). The factors were characterized as “strong desires and intentions” which included questions such as “I want a drink so bad right now I can almost taste it”, “negative reinforcement” which consisted of questions such as “Even a major problem in my life would not bother me right now if I had a drink”, “controllability of alcohol consumption” which consisted of questions such as “If I started drinking right now, I would be able to stop”, and “mild intentions and positive reinforcement” which consisted of questions such as “Drinking would be pleasant now”. Participants indicate the degree to which they agree with each question using a 7-point Likert scale ranging from 1- strongly disagree to 7-strongly agree. In the current study, scores from all subscales were summed to create a total craving score.
Procedure
Upon arriving to the laboratory, participants completed a consent form, and were seated in an electrically shielded Faraday chamber approximately 70 cm from a computer monitor. Participants were asked to be as still as possible during the experiment in order to reduce the amount of extraneous noise in the EEG recordings. Participants were told that the computer task involved the presentation of a series of trials, each composed of a picture. They were instructed to pay attention to the pictures because they were told they would be asked about them later. This task was completely passive in that no response was given by participants during the trials. Participants completed the experimental trials, in which the pictures were each presented in a random order for each of three blocks of trials, with short breaks in between each block.
Therefore, participants viewed 120 trials in total. Each picture was displayed in the middle of the screen for 8 seconds, followed by an intertrial interval of 8 seconds. After completion of the EEG task, participants completed the questionnaires. When finished, they were debriefed and given credit for their participation. All participants completed the study within an hour and a half.
Electrophysiological Recording and Analysis
EEG data were recorded using a DBPA-1 Sensorium Bioamplifier (Sensorium Inc., Charlotte, VT) with an analog high-pass filter of 0.01 Hz and a low-pass filter of 500 Hz (four-pole Bessel). The EEG was recorded from 74 Ag-AgCl sintered electrodes in an electrode cap, placed using the expanded International 10–20 electrode placement system. All electrodes were referenced to the tip of the nose and the ground electrode was placed in the middle of the forehead, slightly above the eyebrows. Eye movement and blinking were recorded from bipolar electrodes placed on the lateral canthi and peri-occular electrodes on the superior and inferior orbits, aligned with the pupils. Before data collection was initiated all impedances were adjusted to within 0–20 kilohms. EEG was recorded continuously throughout the computer task, and was analyzed offline using EMSE software (Source Signal Imaging, San Diego, CA). Data were undersampled at 500 Hz. The data were corrected for eye movement artifacts, using independent component analysis (Jung et al., 2000). Channels containing extreme values (+/− 300mV) in more than 40% of the sweeps were spatially interpolated. All EEG data were filtered (FIR) at low pass 20 Hz (Luck, 2005). The data were segmented between 200 ms prior to stimulus onset and 1000 ms post stimulus onset. After baseline correction over the pre-stimulus interval segmented data was averaged for each subject in each of the conditions.
Results
Participant Characteristics
Data were discarded from participants with excessive EEG artifacts (n = 11); no participants were included whose data included more than two rejected trials per condition. Participants who reported that they never drank alcohol (n = 17) were not included in the analysis. Analyses were thus conducted with 54 participants (31 females). Participants were 19 years old on average (M = 19.31 years, SD = 1.8). Most participants were White (n = 37), with 8 Asian, 4 Hispanic, 3 Multiracial, and 2 Black participants. Eighty-seven percent of the participants reported drinking alcohol in the past three weeks, with an average of 19.20 (SD = 24.41) standard drinks consumed over that time period.
Eleven participants were categorized as alcohol dependent according to the MAST and 43 were categorized as not alcohol dependent. A series of comparisons were made between these two groups. As shown in Table 1, although the two groups did not differ in the number of standard drinks they consumed, nor in how frequently they drank during the past three weeks, alcohol dependent drinkers reported consuming more drinks in one night and craving alcohol more than those who were not alcohol dependent. To determine whether craving or dependence was responsible for any ERP differences, craving was used as a covariate in all subsequent analyses of dependence.
Table 1.
Participant characteristics as a function of their alcohol dependency.
| Alcohol Dependent (n = 11) | Not Alcohol Dependent (n = 43) | Test Statistic | |
|---|---|---|---|
| Age [in years] | 19.00 ± 0.36 | 19.33 ± 0.29 | t(52) = 0.52 |
| Gender [% female] | 63.60 | 55.80 | χ2(1) = 4.96* |
| Drinking behavior over previous three weeks: | |||
| % consumed alcohol | 100 | 83.7 | χ2(1) = 0.32 |
| Number of drinking occasions | 4.54 ± 1.06 | 3.58 ± 0.51 | t(52) = 0.85 |
| Highest # of drinks per occasion | 9.36 ± 1.43 | 5.10 ± 0.62 | t(52) = 2.99** |
| Total drinks | 28.40 ± 7.37 | 16.80 ± 3.68 | t(52) = 1.42 |
| Desire for Alcohol | 34.72 ± 7.33 | 28.67 ±1.12 | t(52) = 2.43* |
| Score on MAST | |||
| Perceptions about drinking behavior | |||
| Feels guilty about drinking [%] | 54.50 | 30.20 | χ2(1) = 2.27 |
| Feels they should cut down [%] | 72.70 | 37.20 | χ2(1) = 4.47* |
| Others worry about drinking [%] | 36.40 | 9.30 | χ2(1) = 5.08* |
| Got into fights while drinking [%] | 36.40 | 9.30 | χ2(1) = 5.08* |
| Family history of alcoholism [%] | 54.50 | 34.90 | χ2(1) = 1.42 |
Notes.
Denotes marginal effects at p<0.1;
Denotes statistical significance at p<0.05;
Denotes statistical significance at p<0.01
Thirty-three of the participants were categorized as escape drinkers and 21 were non-escape drinkers. A series of comparisons were made between these two groups. As shown in Table 2, relative to non-escape drinkers, escape drinkers consumed more standard alcoholic drinks, drank more frequently, and consumed marginally more drinks per night over the previous three weeks. As a result, in all analyses of escape drinkers, the amount of drinks consumed in the last three weeks was controlled.
Table 2.
Participant Characteristics as a Function of their Escape Drinking Behavior
| Escape Drinker (n = 33) | Non-Escape Drinker (n = 21) | Test Statistic | |
|---|---|---|---|
| Age [in years] | 19.30 ± 0.37 | 19.19 ± 0.27 | t(52) = 0.52 |
| Gender [% female] | 60.60 | 52.40 | χ2(1) = 0.36 |
| Drinking behavior over previous three weeks: | |||
| % consumed alcohol | 93.90 | 76.20 | χ2(1) = 3.58+ |
| Number of drinking occasions | 4.63 ± 0.62 | 2.43 ± 0.53 | t(52) = 2.48* |
| Highest # of drinks per occasion | 6.85 ± 0.75 | 4.60 ± 1.00 | t(52) = 1.82+ |
| Total drinks | 24.51 ± 4.66 | 10.76 ± 3.83 | t(52) = 2.08* |
| Desire for Alcohol | 33.30 ± 1.27 | 24.57 ± 1.01 | t(52) = 4.85* |
| Score on MAST | 5.59 ± 0.88 | 3.48 ± 0.66 | t(52) = 1.56 |
| Perceptions about drinking behavior | |||
| Feels guilty about drinking [%] | 39.40 | 29.80 | χ2(1) = 0.66 |
| Feels they should cut down [%] | 45.50 | 42.90 | χ2(1) = 0.04 |
| Others worry about drinking [%] | 12.10 | 19.00 | χ2(1) = 0.48 |
| Got into fights while drinking [%] | 21.20 | 4.80 | χ2(1) = 2.75 |
| Family history of alcoholism [%] | 12.10 | 19.00 | χ2(1) = 0.48 |
Notes.
Denotes marginal effects at p<0.1;
Denotes statistical significance at p<0.05;
Visual inspection of grand averaged waveforms was used to identify the component amplitudes of interest, as well as to determine scalp locations where neural activation was maximal for the corresponding components. P1 was largest at the P1, P2, P3, P7, P9, O2, OZ, P10, P4, P5, P6, P8, PO3, PO4, PO7, PO8, and POZ electrodes and was quantified as the average voltage at these electrodes between 72 and 164 ms. The N1 component was largest at the frontal midline electrodes, and was quantified as the average voltage between 80 and 188 ms at electrodes FPZ and FZ. P2 was quantified as the average voltage between 172 and 272 ms at electrodes P1, P2, P3, P7, P9, O1, O2, OZ, P10, P4, P5, P6, P8, PO3, PO4, PO7, PO8, POZ, and PZ. The N2 component was quantified as the average voltage between 208 and 300 ms at electrodes FPZ, FT10, FT7, FT8, FT9, and FZ.
Analyses were conducted at each ERP component to examine how alcohol dependence affected the amplitude of early attentional ERP components of interest. Specifically, 2 (Stimulus Category: alcohol, non-alcohol) × 2 (Stimulus Type: active, inactive) × 2 (Dependence: alcohol dependent, not alcohol dependent) mixed-model analyses of covariance (ANCOVA) with desire for alcohol as the covariate were conducted with repeated measures on the first two factors for each ERP component. Similar analyses were conducted to examine the effect of the stimuli and escape drinking on ERP amplitude; 2 (Stimulus Category: alcohol, non-alcohol) × 2 (Stimulus Type: active, inactive) × 2 (Escape Drinker: yes, no) mixed-model analyses of covariance (ANCOVA) were conducted with repeated measures on the first two factors and frequency of alcohol consumption as the covariate for each component. No significant effects were found at the P1 and P2 components (ps > .15), so only analyses for N1 and N2 are reported below. Greenhouse-Geisser-adjusted p values are reported for the analyses with multiple numerator degrees of freedom.
N1 Component
Alcohol Dependence
As shown in Figure 1, for the active stimuli, dependent participants showed a larger N1 amplitude to alcohol stimuli than non-alcohol stimuli, This was supported by a significant Stimulus Category × Stimulus Type × Dependence interaction, F(1, 50) = 4.67, p = .036, η2 = .085. Further analyses demonstrated that for the inactive stimuli, there were no significant effects, ps > .25. For the active stimuli, however, there was a marginal Stimulus Category × Dependence interaction, F(1, 51) = 3.61, p = .063, η2 = .066. Simple main effects analyses revealed that, for the active alcohol stimuli, dependent participants (M = −8.58, SE = 2.33) demonstrated significantly larger N1 amplitudes than the non-dependent participants (M = −0.20, SE = 1.14), F(1, 51) = 10.11, p = .003, η2 = .165. For the non-alcohol stimuli, dependent participants (M = −0.33, SE = 3.18) demonstrated similar N1 amplitudes as non-dependent participants (M = −0.35, SE = 1.56), F(1, 51) = 0.04, p = .849, η2 = .001.
Figure 1.
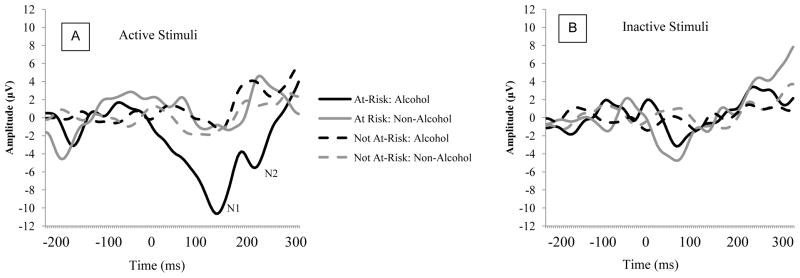
ERP activity as a function of Stimulus Category, Stimulus Type, and Risk at electrode Fz. Panel A depicts responses to active stimuli; Panel B depicts responses to inactive stimuli.
Escape Drinking
Results revealed no significant differences, p values > .27.
N2 Component
Alcohol Dependence
No significant effects were found, p values > .44.
Escape Drinking
As depicted in Figure 2, for the active stimuli, escape drinkers showed a larger N2 amplitude to alcohol stimuli than the non-escape drinkers. This observation was supported by a significant Stimulus Category × Stimulus Type × Escape Drinking interaction, F(1, 50) = 2.66, p = .109, η2 = .05. Simple main effects analyses demonstrated that for the inactive stimuli, there were no significant effects, ps > .15. For the active stimuli, however, there was a significant Stimulus Category × Escape Drinking interaction, F(1, 50) = 8.44, p = .005, η2 = .144. The escape drinkers (M = −1.34, SE = 1.75) showed a larger N2 to the active alcohol stimuli than the non-escape drinkers (M = 6.83, SE = 3.22), t(51) = −2.43, p = .019. For the active non-alcohol stimuli, there were no differences between escape (M = 2.62, SE = 2.67) and non-escape drinkers (M = −0.11, SE = 1.79), F(1, 51) = 0.74, p = .466.
Figure 2.
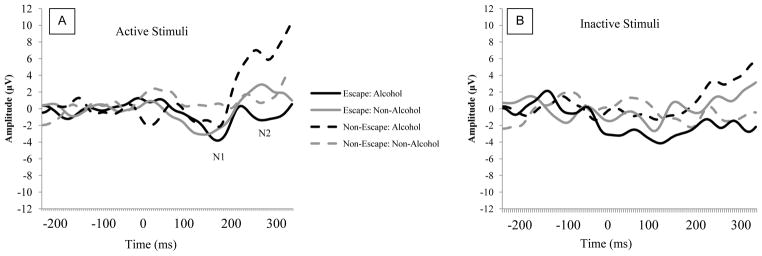
ERP activity as a function of Stimulus Category, Stimulus Type, and Motivation at Fz. Panel A depicts responses to active stimuli; Panel B depicts responses to inactive stimuli.
Discussion
The present study investigated how dependence for alcohol and escape drinking affect the processing of alcohol-related stimuli in ERP components that are associated with early attention. Our findings suggest that college students who were alcohol dependent and motivated to drink to avoid dysphoric emotions or negative mood showed evidence of a neural attentional bias to the alcohol-related stimuli. However, this bias emerged at different time-points during the processing of these stimuli depending on the type of drinker they were. Specifically, participants who were alcohol dependent showed larger N1 amplitudes to alcohol-related cues compared to control cues while escape drinkers showed larger N2 amplitudes to alcohol cues than non-escape drinkers. These effects were only significant when examining neural responses to active cues, or those that contained human content. In contrast, differential neural responses did not occur to the inactive cues, which were devoid of human content.
Consistent with models that purport that excessive drinking is associated with enhanced attention to alcohol-related stimuli (Robinson & Berridge, 2000, 2008; Tiffany, 1990; Wise, 1998), these results suggest that early neural attentional processing, as indexed by N1 amplitude, is moderated by alcohol dependence. As the N1 component reflects exogenous, automatic attention (Luck & Kappenman, 2011), these results suggest that attentional bias to active alcohol-related stimuli in those who are alcohol dependent may be an automatic sensory response. It is worth noting however, that this response does not appear to be a function of craving, which is a hallmark symptom of substance abuse and dependence. It is possible that these early responses may reflect neuronal changes that, over time, may become responsible for later higher-order cognitions that lead to alcohol and its rewards becoming prioritized in the cognitive system (Cox et al., 2006; Klinger & Cox, 2004). It is important to note however, that given the comorbidity between alcohol consumption and that of other drugs (Cooney, Cooney, Pilkey, Kranzler, & Oncken, 2003, Peloquin, Hecimovic, Sardinha, Stewart, & Barrett, 2013) the effects observed in dependent drinkers in this study may reflect neuronal changes that have occurred as a function of interactions between multiple drugs.
Additionally, the current findings extend our previous behavioral work demonstrating that escape drinkers showed a greater attentional bias to alcohol-related cues than non-escape drinkers (Forestell, et al, 2012). This previous work used a dot probe to illustrate that escape drinking was associated with greater attention to inactive cues when participants were asked to respond to cues after they had been presented for a relatively long time (i.e., 2000 ms), while escape drinking was associated with greater attentional bias to active cues when the cues were presented for a short time (i.e., 500 ms). Although the current study used a passive viewing task rather than the dot probe task, the current findings are nonetheless consistent with our previous behavioral findings, in that escape drinkers demonstrated enhanced responses to the active alcohol stimuli at 200 ms. Taken together, it seems that drinking to escape is associated with initial orientation to alcohol-related cues that contain human content, while maintained attention focuses on alcohol-related cues without human content. These neural attentional biases to drug-related cues may increase craving for alcohol and lead to difficulties abstaining from drinking (Field & Cox, 2008; Field, Munafò, & Franken, 2009; Franken, 2003; Robbins & Ehrman, 2004; Tiffany, 1990; Waters et al., 2003; Williams et al., 1996). Although the escape measure developed by Calahan (1969) has proven to be a quick and easy tool to administer and useful in identifying escape drinkers (e.g., Forestell, Dickter & Young, 2012; Mennella & Forestell, 2008), future research should use more recently developed questionnaires that additionally identify other factors such as social enhancement and conformity motives (e.g., Cooper, 1994).
This study, in combination with research by Petit et al. (2012), reveals novel information about the time-course of attentional biases to alcohol-related stimuli as a function of alcohol dependence. While Petit and colleagues showed that alcohol cues elicited larger P1 amplitudes than control cues in binge drinking college students, the current findings suggest that alcohol dependence is associated with an enhanced N1 response. That the current study did not find that P1 was enhanced to alcohol cues for dependent drinkers is surprising, given that binge drinkers are often at heightened risk for alcohol dependence (Bonomo et al., 2004). There are two likely explanations for our failure to find a significant P1 effect. First, while Petit and colleagues used an oddball paradigm, we used a passive viewing task in the current study which may have led to differences in the time-course of attentional processes. Future studies should examine whether task type leads to different early ERP effects. Second, while Petit et al. recruited participants based on their binge drinking behavior to create equal groups, we did not select participants based on their drinking frequency or duration. Indeed, Petit et al.’s binge drinkers consumed a much higher amount of drinks per week than our alcohol dependent participants (30.38 drinks vs. 9.36 drinks, respectively). Given that data from Petit et al. show that the number of drinks consumed per week was associated with a larger P1 to alcohol cues, it is likely that the early P1 attentional bias seen in their binge drinkers was the result of heavy drinking patterns established over time, as is consistent with prominent addiction theories. That our dependent drinkers did not show an enhanced P1 amplitude to alcohol stimuli suggests that they may not drink heavily enough to show this bias. This is supported by further examination of these variables in our own data which does indeed show a trend for P1 amplitude in response to active alcohol cues to increase with the number of drinks consumed per week (r = .52, p = .10). Whether the P1 and N1 responses are associated specifically with binge drinking and addiction, respectfully, is a topic for future research.
Our findings also demonstrated that, somewhat later in processing, automatic attentional biases to active alcohol-related cues are enhanced in those who are escape drinkers. Because differences emerged at the N2 component, which is associated with the processing of emotional stimuli (Carretié et al., 2004) and is thought to be more controlled than the N1 (Luck & Kappenman, 2011), it appears that escape drinkers are allocating more controlled attention to the active alcohol cues, which are processed as more salient and are emotionally-relevant stimuli. Notably, Petit et al. (2012) did not find differences in N2 amplitude to alcohol cues between binge drinkers and control drinkers. Together, these results may suggest that escape drinking is associated with more controlled attention to alcohol cues than binge drinking, although future research should test this. Examining how early attentional components unfold and how they are influenced by variables such as drinking behavior, dependence, and motivations for drinking can aid in the understanding of the nature of addiction. Future research should investigate other variables that may affect the attentional processing of alcohol-related cues and should examine whether these early neural attentional biases are predictive of difficulties with abstaining from drinking.
The investigation of drinkers’ attentional biases to alcohol-related cues can be instrumental in the development of evidence-based strategies for treatment. Indeed, altering attentional biases through training that reduces cue reactivity has been successfully implemented in alcoholics in both the short and long term (Fadardi & Cox, 2009; Shoenmakers, Wiers, Jones, Bruce, Jansen, 2007; Wiers, Cox, Field, Fadardi & Palfai, 2006). The current work, combined with previous research, helps to reveal the cognitive stages at which attentional biases to alcohol-related cues occur and how they are affected by both properties of the stimulus and characteristics of the individual. These findings can be used to help maximize the potential benefits of implicit training on those with alcohol problems.
References
- Abbey A, Smith MJ, Scott RO. The relationship between reasons for drinking alcohol and alcohol consumption: An interactional approach. Addict Behav. 1993;18(6):659–670. doi: 10.1016/0306-4603(93)90019-6. [DOI] [PMC free article] [PubMed] [Google Scholar]
- Allison T, Ginter H, McCarthy G, Nobre AC, Puce A, Luby M, et al. Face recognition in human extrastriate cortex. J Neurophysiol. 1994;71:821–825. doi: 10.1152/jn.1994.71.2.821. [DOI] [PubMed] [Google Scholar]
- Bauer D, Cox WM. Alcohol-related words are distracting to both alcohol abusers and non-abusers in the Stroop colour-naming task. Addiction. 1998;93(10):1539–1542. doi: 10.1046/j.1360-0443.1998.9310153910.x. [DOI] [PubMed] [Google Scholar]
- Beck KH, Summons TG, Thombs DL. A factor analytic study of social context of drinking in a high school population. Psychol Addict Behav. 1991;5(2):66–77. doi: 10.1037/h0080610. [DOI] [Google Scholar]
- Bentin S, Allison T, Puce A, Perez E, McCarthy G. Electrophysiological studies of face perception in humans. J Cognitive Neurosci. 1996;8:551–565. doi: 10.1162/jocn.1996.8.6.551. [DOI] [PMC free article] [PubMed] [Google Scholar]
- Bobes MA, Valdés-Sosa M, Olivares E. An ERP study of expectancy violation in face perception. Brain Cognition. 1994;26:1–22. doi: 10.1006/brcg.1994.1039. [DOI] [PubMed] [Google Scholar]
- Bonomo YA, Bowes G, Coffey C, Carlin JB, Patton GC. Teenage drinking and the onset of alcohol dependence: a cohort study over seven years. Addiction. 2004;99(12):1520–1528. doi: 10.1111/j.1360-0443.2004.00846.x. [DOI] [PubMed] [Google Scholar]
- Cahalan D, Cisin IH, Crossley HM. American drinking practices: A national study of drinking behavior and attitudes. Monographs of the Rutgers Center of Alcohol Studies; New Brunswick, NJ: 1969. (Monograph No. 6) [Google Scholar]
- Carretié L, Hinojosa JA, Martín-Loeches M, Mercado F, Tapia M. Automatic attention to emotional stimuli: neural correlates. Hum Brain Mapp. 2004;22(4):290–299. doi: 10.1002/hbm.20037. [DOI] [PMC free article] [PubMed] [Google Scholar]
- Cooney JL, Cooney NL, Pilkey DT, Kranzler HR, Oncken CA. Effects of nicotine deprivation on urges to drink and smoke in alcoholic smokers. Addiction. 2003;98(7):913–921. doi: 10.1046/j.1360-0443.2003.00337. [DOI] [PubMed] [Google Scholar]
- Cox WM, Fadardi JS, Pothos EM. The addiction-stroop test: Theoretical considerations and procedural recommendations. Psych Bull. 2006;132(3):443–476. doi: 10.1037/0033-2909.132.3.443. [DOI] [PubMed] [Google Scholar]
- Dickter CL, Kieffaber PK. EEG Methods for the Psychological Sciences. London: Sage Publications, Ltd; in press. [Google Scholar]
- Dickter CL, Bartholow BD. Ingroup categorization and response conflict: Interactive effects of target race, flanker compatibility, and infrequency on N2 amplitude. Psychophysiology. 2010;47(3):596–601. doi: 10.1111/j.1469-8986.2010.00963.x. [DOI] [PubMed] [Google Scholar]
- Fadardi JS, Cox WM. Alcohol attentional bias: drinking salience or cognitive impairment? Psychopharmacology. 2006;185(2):169–178. doi: 10.1007/s00213-005-0268-0. [DOI] [PubMed] [Google Scholar]
- Fadardi JS, Cox WM. Reversing the sequence: reducing alcohol consumption by overcoming alcohol attentional bias. Drug Alcohol Depen. 2009;101(3):137–145. doi: 10.1016/j.drugalcdep.2008.11.015. [DOI] [PubMed] [Google Scholar]
- Farber PD, Khavari KA, Douglass FM. A factor analytic study of reasons for drinking: Empirical validation of positive and negative reinforcement dimensions. J Consult Clin Psychol. 1980;48(6):780–781. doi: 10.1037/0022-006X.48.6.780. [DOI] [PubMed] [Google Scholar]
- Fernie G, Christiansen P, Cole JC, Rose AK, Field M. Effects of 0.4 g/kg alcohol on attentional bias and alcohol-seeking behaviour in heavy and moderate social drinkers. Journal of Psychopharmacology. 2012;26(7):1017–1025. doi: 10.1177/0269881111434621. [DOI] [PubMed] [Google Scholar]
- Field M, Cox WM. Attentional bias in addictive behaviors: a review of its development, causes, and consequences. Drug Alcohol Depen. 2008;97(1):1–20. doi: 10.1016/j.drugalcdep.2008.03.030. [DOI] [PubMed] [Google Scholar]
- Field M, Eastwood B. Experimental manipulation of attentional bias increases the motivation to drink alcohol. Psychopharmacology. 2005;183(3):350–357. doi: 10.1007/s00213-005-0202-5. [DOI] [PubMed] [Google Scholar]
- Field M, Mogg K, Mann B, Bennett GA, Bradley BP. Attentional biases in abstinent alcoholics and their association with craving. Psychol Addict Behav. 2013;27(1):71–80. doi: 10.1037/a0029626. [DOI] [PubMed] [Google Scholar]
- Field M, Mogg K, Zetteler J, Bradley BP. Attentional biases for alcohol cues in heavy and light social drinkers: the roles of initial orienting and maintained attention. Psychopharmacology. 2004;176(1):88–93. doi: 10.1007/s00213-004-1855-1. [DOI] [PubMed] [Google Scholar]
- Field M, Munafò MR, Franken IH. A meta-analytic investigation of the relationship between attentional bias and subjective craving in substance abuse. Psychol Bull. 2009;135(4):589–607. doi: 10.1037/a0015843. [DOI] [PMC free article] [PubMed] [Google Scholar]
- Forestell CA, Dickter CL, Young CM. Take me away: The relationship between escape drinking and attentional bias for alcohol-related cues. Alcohol. 2012;46(6):543–549. doi: 10.1016/j.alcohol.2012.05.001. [DOI] [PubMed] [Google Scholar]
- Franken IH. Drug craving and addiction: integrating psychological and neuropsychopharmacological approaches. Prog Neuro-Psychoph. 2003;27:563–579. doi: 10.1016/S0278-5846(03)00081-2. [DOI] [PubMed] [Google Scholar]
- Grant BF, Dawson DA. Age of onset of drug use and its association with DSM-IV drug abuse and dependence: results from the National Longitudinal Alcohol Epidemiologic Survey. J Subst Abuse. 1998;10(2):163–173. doi: 10.1016/S0899-3289(99)80131-X. [DOI] [PubMed] [Google Scholar]
- Gibbs LE. Validity and reliability of the Michigan alcoholism screening test: a review. Drug Alcohol Depen. 1983;12:279–285. doi: 10.1016/0376-8716(83)90071-6. [DOI] [PubMed] [Google Scholar]
- Hingson RW, Zha W, Weitzman ER. Magnitude of and trends in alcohol-related mortality and morbidity among U.S. college students ages 18–24, 1998–2005. J Stud Alcohol Drugs Suppl. 2009;16:12–20. doi: 10.15288/jsads.2009.s16.12. [DOI] [PMC free article] [PubMed] [Google Scholar]
- Jones BT, Jones BC, Smith H, Copley N. A flicker paradigm for inducing change blindness reveals alcohol and cannabis information processing biases in social users. Addiction. 2003;98(2):235–244. doi: 10.1046/j.1360-0443.2003.00270.x. [DOI] [PubMed] [Google Scholar]
- Jung J. Drinking motives and behavior in social drinkers. J Stud Alcohol. 1977;38(5):944–952. doi: 10.15288/jsa.1977.38.944. [DOI] [PubMed] [Google Scholar]
- Jung TP, Makeig S, Westerfield M, Townsend J, Courchesne E, Sejnowski TJ. Removal of eye activity artifacts from visual event-related potentials in normal and clinical subjects. Clin Neurophysiol. 2000;111(10):1745–1758. doi: 10.1016/S1388-2457(00)00386-2. [DOI] [PubMed] [Google Scholar]
- Klinger E, Cox WM. Motivation and the theory of current concerns. In: Cox WM, Klinger E, editors. Handbook of motivational counseling: Concepts, approaches, and assessment. Chichester, West Sussex, UK: John Wiley & Sons; 2004. pp. 3–27. [Google Scholar]
- Kessler RC, Berglund P, Demler O, Jin R, Merikangas KR, Walters EE. Lifetime prevalence and age-of-onset distributions of DSM-IV disorders in the National Comorbidity Survey Replication. Arch Gen Psychiat. 2005;62(6):593–602. doi: 10.1001/archpsyc.62.6.593. [DOI] [PubMed] [Google Scholar]
- Littel M, Euser AS, Munafò MR, Franken IHA. Electrophysiological indices of biased cognitive processing of substance-related cues: A meta-analysis. Neurosci Biobehav R. 2012;36:1803–1816. doi: 10.1016/j.neubiorev.2012.05.001. [DOI] [PubMed] [Google Scholar]
- Luck S. An introduction to the event-related potential technique. Cambridge, MA: MIT Press; 2005. [Google Scholar]
- Luck SJ, Kappenman ES. The Oxford Handbook of Event-Related Potential Components. New York, NY: Oxford University Press; 2011. [Google Scholar]
- Mennella JA, Forestell CA. Children’s hedonic responses to the odors of alcoholic beverages: A window to emotions. Alcohol. 2008;42(4):249–260. doi: 10.1016/j.alcohol.2008.03.129. [DOI] [PMC free article] [PubMed] [Google Scholar]
- Miller J, Naimi T, Brewer R, Everett Jones S. Binge drinking and associated health risk behaviors among high school students. Pediatrics. 2007;119(1):76–84. doi: 10.1542/peds.2006-1517. [DOI] [PubMed] [Google Scholar]
- Noël X, Colmant M, Van Der Linden M, Bechara A, Bullens Q, Hanak C, Verbanck P. Time course of attention for alcohol cues in abstinent alcoholic patients: the role of initial orienting. Alcohol Clin Exp Res. 2006;30(11):1871–1877. doi: 10.1111/j.1530-0277.2006.00224.x. [DOI] [PubMed] [Google Scholar]
- Peloquin MP, Hecimovic K, Sardinha J, Stewart SH, Barrett SP. The effect of snus on alcohol-related cigarette administration in dependent and non-dependent smokers. Pharmacol Biochem Behav. 2013 doi: 10.1016/j.pbb.2013.08.011. [DOI] [PubMed] [Google Scholar]
- Petit G, Kornreich C, Maurage P, Noël X, Letesson C, Verbanck P, Campanella S. Early attentional modulation by alcohol-related cues in young binge drinkers: An event-related potentials study. Clin Neurophysiol. 2012;123(5):925–936. doi: 10.1016/j.clinph.2011.10.042. [DOI] [PubMed] [Google Scholar]
- Polich J. Neuropsychology of P300. In: Luck SJ, Kappenman ES, editors. Handbook of event-related potential components. Oxford University Press; New York, NY, USA: 2012. pp. 159–188. [Google Scholar]
- Polich J, Kok A. Cognitive and biological determinants of P300: An integrative review. Biol Psychol. 1995;41:103–146. doi: 10.1016/0301-0511(95)05130-9. [DOI] [PubMed] [Google Scholar]
- Polich JM, Orvis BR. Alcohol problems: Patterns and prevalence in the US Air Force (Rep No R-2308-AF) Santa Monica, CA: Rand Corporation; 1979. [Google Scholar]
- Robbins SJ, Ehrman RN. The role of attentional bias in substance abuse. Behav Cogn Neurosci R. 2004;3(4):243–260. doi: 10.1177/1534582305275423. [DOI] [PubMed] [Google Scholar]
- Robinson TE, Berridge KC. The psychology and neurobiology of addiction: an incentive sensitization view. Addiction. 2000;95(8s2):91–117. doi: 10.1098/rstb.2008.0093. [DOI] [PubMed] [Google Scholar]
- Robinson TE, Berridge KC. The incentive sensitization theory of addiction: some current issues. Philos T R Soc B. 2008;363(1507):3137–3146. doi: 10.1046/j.1360-0443.95.8s2.19.x. [DOI] [PMC free article] [PubMed] [Google Scholar]
- Schoenmakers T, Wiers RW, Jones BT, Bruce G, Jansen A. Attentional re- training decreases attentional bias in heavy drinkers without generalization. Addiction. 2007;102(3):399–405. doi: 10.1111/j.1360-0443.2006.01718.x. [DOI] [PubMed] [Google Scholar]
- Selzer ML. The Michigan alcoholism screening test: the quest for a new diagnostic instrument. Am J Psychiat. 1971;127:1653–1658. doi: 10.1176/ajp.127.12.1653. [DOI] [PubMed] [Google Scholar]
- Sharma D, Albery IP, Cook C. Selective attentional bias to alcohol related stimuli in problem drinkers and non-problem drinkers. Addiction. 2001;96(2):285–295. doi: 10.1080/09652140020021026. [DOI] [PubMed] [Google Scholar]
- Skinner HA. Guidelines for using the Michigan Alcoholism Screening Test. Toronto: Addiction Research Foundation; 1982. [Google Scholar]
- Sobell LC, Sobell MB. Alcohol consumption measures. In: Allen JP, Columbus M, editors. Assessing alcohol problems: A guide for clinicians and researchers. Washington: Government Printing Office; 1995. p. 55e73. National Institute on Alcohol Abuse and Alcoholism Treatment Handbook Series No. 4, NIH Publication No. 95–3745. [Google Scholar]
- Stetter F, Ackermann K, Bizer A, Straube ER, Mann K. Effects of Disease-Related Cues in Alcoholic Inpatients: Results of a Controlled “Alcohol Stroop” Study. Alcohol Clin Exp Res. 1995;19(3):593–599. doi: 10.1111/j.1530-0277.1995.tb01553.x. [DOI] [PubMed] [Google Scholar]
- Stormark KM, Laberg JC, Nordby H, Hugdahl K. Alcoholics’ selective attention to alcohol stimuli: automated processing? J Stud Alcohol. 2000;61:18–23. doi: 10.15288/jsa.2000.61.18. [DOI] [PubMed] [Google Scholar]
- Tiffany ST. A cognitive model of drug urges and drug-use behavior: role of automatic and nonautomatic processes. Psych Rev. 1990;97(2):147–168. doi: 10.1037/0033-295X.97.2.147. [DOI] [PubMed] [Google Scholar]
- Townshend J, Duka T. Attentional bias associated with alcohol cues: differences between heavy and occasional social drinkers. Psychopharmacology. 2001;157(1):67–74. doi: 10.1007/s002130100764. [DOI] [PubMed] [Google Scholar]
- Van Veen V, Carter CS. The anterior cingulate as a conflict monitor: fMRI and ERP studies. Physiol Behav. 2002;77(4):477–482. doi: 10.1016/S0031-9384(02)00930-7. [DOI] [PubMed] [Google Scholar]
- Waters AJ, Shiffman S, Bradley BP, Mogg K. Attentional shifts to smoking cues in smokers. Addiction. 2003;98(10):1409–1417. doi: 10.1046/j.1360-0443.2003.00465.x. [DOI] [PubMed] [Google Scholar]
- Wechsler H, Davenport A, Dowdall G, Moeykens B, Castillo S. Health and behavioral consequences of binge drinking in college. J Amer Med Assoc. 1994;272(21):1672–1677. doi: 10.1001/jama.1994.03520210056032. [DOI] [PubMed] [Google Scholar]
- Wiers RW, Cox WM, Field M, Fadardi JS, Palfai TP, Schoenmakers T, Stacy AW. The Search for New Ways to Change Implicit Alcohol-Related Cognitions in Heavy Drinkers. Alcohol Clin Exp Res. 2006;30(2):320–331. doi: 10.1111/j.1530-0277.2006.00037.x. [DOI] [PubMed] [Google Scholar]
- Williams A, Clark D. Alcohol consumption in university students: The role of reasons for drinking, coping strategies, expectancies, and personality traits. Addict Behav. 1998;23(3):371–378. doi: 10.1016/S0306-4603(97)80066-4. [DOI] [PubMed] [Google Scholar]
- Williams JMG, Mathews A, MacLeod C. The emotional Stroop task and psychopathology. Psychol Bull. 1996;120(1):3–24. doi: 10.1037/0033-2909.120.1.3. [DOI] [PubMed] [Google Scholar]
- Wise RA. Drug-activation of brain reward pathways. Drug Alcohol Depen. 1998;51(1):13–22. doi: 10.1016/S0376-8716(98)00063-5. [DOI] [PubMed] [Google Scholar]