Summary
The BRAFV600E mutation, which approaches 50% in human melanomas, constitutively activates pERK and contributes to disease progression. The BRAFV600E inhibitor, Vemurafenib (PLX4032), shows promising clinical responses, but resistance to PLX4032 usually develops within a year. Transgenic mouse models allow the study of BRafV600E melanoma in vivo, however in vitro models are necessary to better understand the molecular mechanism underlying disease progression and resistance. We established melanoma cell lines (D4M cells) from the conditional mouse model of metastatic melanoma: Tyr::CreER;BrafCA;Ptenlox/lox, which recapitulates human disease. Cultured D4M cells express high constitutive pERK. PLX4032 abrogates ERK phosphorylation, inhibits D4M proliferation, and increases expression of the melanoma associated antigen, pmel, in vitro, consistent with human BRAFV600E melanoma cell lines. D4M cells are transplantable in either immune-compromised or syngeneic B6 mice. Thus, D4M cell lines allow correlation of in vitro studies on molecular mechanisms of melanoma with in vivo investigations on pathology and immunology.
Keywords: Murine BRafV600E, melanoma, pERK, Vemurafenib, PLX4032, B6 syngeneic mouse model, cell culture
Murine BRafV600E cell lines
Rates of melanoma are steadily on the rise, with a current lifetime incidence of 1 in 50 individuals (Balch et al. 2004; Smalley et al. 2005). In nearly 50% of human melanomas, the BRAF oncogene encodes BRAFV600E (Rubinstein et al. 2010; Long et al. 2011; Lee et al. 2011; Menzies et al. 2012), a protein whose expression increases melanoma progression via activation of signaling cascades and downstream genes (Koya et al. 2012; Joseph et al. 2010; Yang et al. 2010; Vultur et al. 2011; Chapman et al. 2011). Vemurafenib, also known as PLX4032, is a small molecule inhibitor that binds to the ATP-binding site of mutated BRAF kinase, inhibiting ERK signaling only in tumor cells expressing BRAFV600E (Joseph et al. 2010). Clinical use of PLX4032, to treat BRAFV600E tumors, induces rapid tumor regression and has revolutionized targeted therapy for melanoma (Boni et al. 2010; Khalili et al. 2012; Koya et al. 2012; Straussman et al. 2012). However, resistance to PLX4032 typically develops within one year (Vultur et al. 2011; Joseph et al. 2010; Straussman et al. 2012), underscoring the need for increased understanding of molecular mechanisms underlying BRAFV600E and for developing additional therapeutic strategies.
The use of human melanoma cell lines is well established for in vitro and in vivo investigations of BRAFV600E melanoma (Herlyn & Fukunaga-Kalabis 2010). However, human cell lines rely on xenografts in immune-compromised mice, which limit studies of host-tumor cell interactions in a genetically identical (syngeneic) background. Recently developed mouse models of BRafV600E melanoma provide researchers with the ability to investigate in vivo tumor responses to PLX4032 treatment (Dankort et al. 2009; Dhomen et al. 2009). Backcrossing these mice onto a pure background has allowed for in vivo testing of immunologic therapies in a syngeneic system (A. I. Hooijkaas et al. 2012; A. Hooijkaas et al. 2012). However, for in vitro analysis of the molecular mechanisms underlying BRafV600E melanoma, stable cell lines that recapitulate the human disease are needed. These lines could be used to identify critical mechanisms: signal transduction pathways, patterns of gene expression, and interactions with cells within the tumor microenvironment (Herlyn & Fukunaga-Kalabis 2010).
To date, two groups have reported the isolation of murine BRafV600E cell lines from mouse models of BRafV600E melanoma (Koya et al. 2012; A. I. Hooijkaas et al. 2012). However, given the heterogeneity of human BRAFV600E cell lines, the establishment of only two murine cell lines may not adequately represent the true biology of BRafV600E cells in vitro. For example, both of the reported murine BRafV600E cell lines are only partially sensitive to PLX4032 and PLX4720 (Koya et al. 2012; A. I. Hooijkaas et al. 2012; Knight et al. 2013), with respect to decreased pERK signaling and cellular proliferation. These in vitro results differ from in vivo results seen in a corresponding mouse model (A. I. Hooijkaas et al. 2012) and with human BRAFV600E cell lines (Joseph et al. 2010; Yang et al. 2010; Straussman et al. 2012).
Similar to the work of Hooijkaas et al. 2012, our group backcrossed the transgenic mouse model, Tyr::CreER;BrafCA;Ptenlox/lox (Dankort et al. 2009), a gift from Marcus Bosenberg (Yale), to a C57BL/6 (B6) background to achieve >98% B6 DNA; these mice are hereafter referred to as Braf/Pten mice. In our studies, the establishment of stable cell lines from this model was difficult, perhaps due to the heterogeneous population of cells in the primary tumor and the slow growth of the tumor cells in culture. However, we developed a technique which we used to establish several stable cell lines that represent the in vivo biology of tumors in Braf/Pten mice.
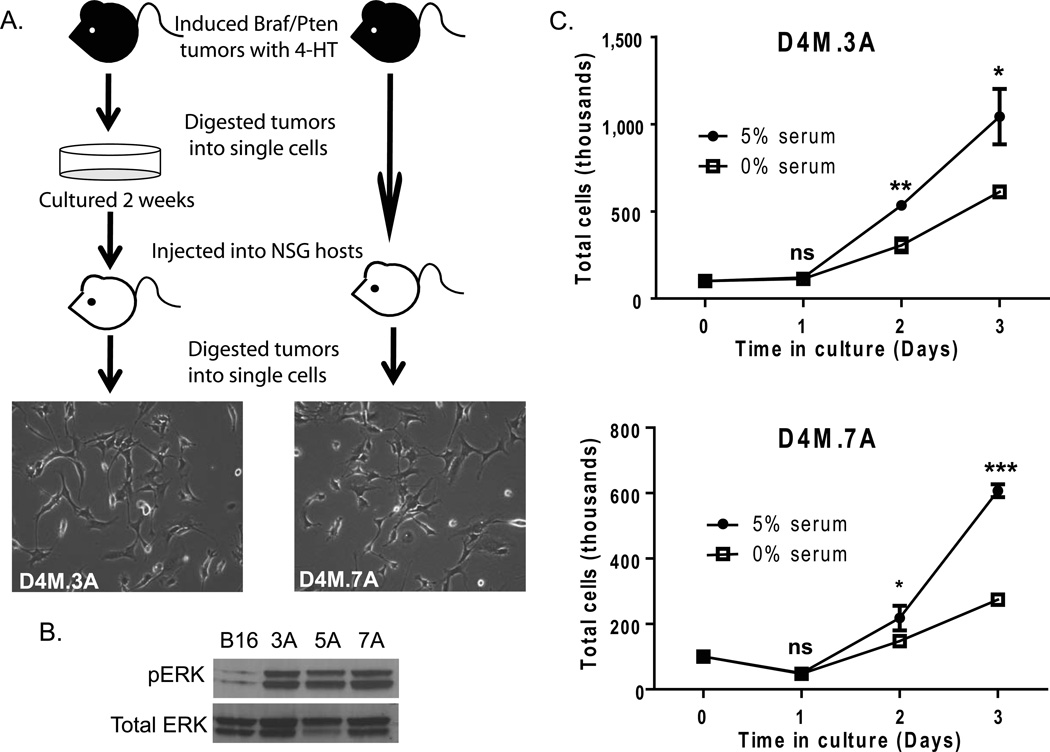
We found that the establishment of stable cell lines from Braf/Pten mice required a protocol of sequential in vitro and in vivo growth. Induced tumors (10 mm in diameter) were resected from Braf/Pten mice and dissociated into single cells by collagenase digestion (see Supplemental Materials and Methods). We discovered that DMEM/F-12 advanced/5% FBS media was optimal for survival of cells isolated from the primary tumor. However, these cells often grew slowing in culture, making them unsuitable for in vitro studies. To verify the tumorigenicity of dissociated and cultured primary tumor cells, we injected them into NOD/SCID/γ chainnull (NSG) mice, an immune-compromised, permissive host (Figure 1A). When secondary tumors from the host mice reached 10–12 mm in diameter, they were surgically excised and cultured using the same dissociation protocol and culture media. Of the seven tumors that were processed with this sequence, we successfully developed five stable D4M (Dartmouth Murine Mutant Malignant Melanoma) cell lines from both male and female Braf/Pten mice, demonstrating that we can routinely establish lines with this protocol.
Figure 1. D4M cell lines grow readily in culture and exhibit constitutive activation of pERK.
(A) Schematic of the protocol used to generate D4M cell lines. Braf/Pten mice were injected with 4-hydroxytamoxifen (4-HT) and the tumors that developed were excised and dissociated into single cells. These cells were cultured for 2 weeks (left) or uncultured and immediately injected intradermally into NSG host mice after dissociation (right). Tumors that arose from the host mice were excised and dissociated into single cells and plated in vitro to generate D4M cell lines. Representative brightfield images of D4M.3A and D4M.7A were taken at 10× magnification. (B) Immunoblot analysis for pERK of 4µg of protein lysate from B16, D4M.3A, D4M.5A, and D4M.7A cultured cells. Total ERK was used as a loading control. (C) In vitro growth curves of D4M.3A and D4M.7A cells in DMEM/F-12 advanced with either 0% or 5% FBS. Cells, 100,000, were plated in triplicate wells and total numbers of cells were counted over the next 3 days. Error bars represent standard deviations of the means. T-tests were performed on the averages of 4 separate wells for each time point (ns = not significant, * = P < 0.05, ** = P < 0.005).
Characterization of D4M cell lines
Since both human BRAFV600E and mouse BRafV600E tumors have constitutive activation of MAPK signaling cascades, we evaluated levels of downstream pERK in three D4M cell lines, 3A, 5A, and 7A (Figure 1B). In keeping with a mutational activation of BRaf (Dankort et al. 2009), D4M cell lines have high constitutive levels of pERK compared to B16F1 cells, which are Brafwt. Two D4M cell lines, D4M.3A (from a male donor) and D4M.7A (from a female donor), were used for subsequent studies. Although these cell lines were generated using different modifications of our protocol (3A - with culture before re-injection, 7A - without culture before re-injection), they were morphologically similar in culture (Figure 1A). All D4M cell lines generated were unpigmented, which is commonly seen in human melanoma cell lines (Eberle et al. 1998), such as VMM5 and VMM12 cells (Huntington et al. 2004; Yamshchikov et al. 2005; Blackburn et al. 2007; Blackburn et al. 2009; Croteau et al. 2012) (Supplementary Figure 1). Both D4M.3A and D4M.7A grow in advanced DMEM/F-12 media with or without serum (Figure 1C). Survival and growth in serum-free conditions, though significantly less than in serum-containing conditions (P < 0.05), will allow for analysis of secreted factors released from these cell lines in vitro.
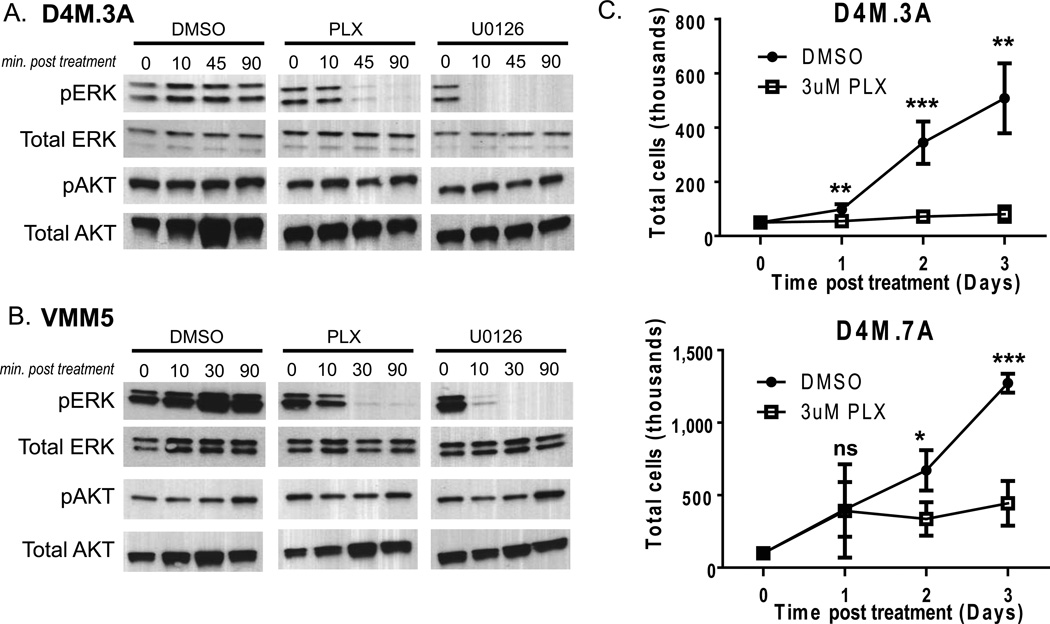
PLX4032 binds V600E mutant BRAF with high affinity and inhibits ERK signaling output. We tested the sensitivity of cultured D4M cells to this inhibitor by first evaluating cell signaling after treatment with PLX4032, using DMSO treated cells as negative controls and U0126 treated cells as positive controls (Figure 2A). U0126 is a selective inhibitor of MEK1 and MEK2, blocking downstream signals including phosphorylation of ERK. Treatment of D4M.3A, D4M.5A, and D4M.7A cells with 3µM PLX4032 for 45 or 90 minutes, led to decreased pERK, with no change in levels of pAKT (Figure 2A and not shown). Treatment with U0126 decreased pERK levels after 10 minutes. VMM5 and VMM12 cells, human BRAFV600E cell lines of melanoma (Huntington et al. 2004), showed similar responses to PLX4032 and U0126, with decreased pERK levels at 45 and 10 minutes respectively, and no change in pAKT (Figure 2B and not shown). D4M cell lines are, thus, comparable to human BRAFV600E cell lines in their cell signaling response to PLX4032 treatment (Joseph et al. 2010; Yang et al. 2010; Straussman et al. 2012). We conclude that D4M cell lines have characteristics similar to human BRAFV600E melanoma and BRafV600E mouse models.
Figure 2. PLX4032 decreases pERK levels and inhibits growth of D4M cells.
(A–B) Immunoblots of 2.5µg of protein lysate for pERK or pAKT from (A) D4M.3A and (B) VMM5 cells, treated with DMSO, 3µM PLX4032, or 10 µM U0126 over a time course (minutes post treatment). Total ERK and total AKT were used as loading controls. (C) In vitro growth curves of D4M.3A and D4M.7A cells treated with DMSO or 3µM PLX4032. Cells, 5 × 10⁴, were plated in quadruplicate wells and total cells were counted over 3 days. Error bars represent standard deviations of the means. T-tests were performed on the averages of 4 separate wells for each time point (ns = not significant, * = P < 0.05, ** = P < 0.005).
We next evaluated cellular proliferation of D4M cell lines in response to PLX4032. Treatment with 3 µM PLX4032 significantly (P < 0.005) arrested in vitro growth of D4M.3A and D4M.7A cells 2–3 days post treatment (Figure 2C). Human tumors with BRAFV600E are dependent on constitutive activation of ERK signaling for cellular proliferation; thus, addition of PLX4032 causes growth arrest of BRAFV600E tumor cells in vitro (Joseph et al. 2010). In keeping with reports of human BRAFV600E cell lines (Joseph et al. 2010; Yang et al. 2010), the response of the D4M cells to PLX4032 appeared to be primarily cytostatic. The previously published murine BRafV600E cell lines are relatively resistant to PLX4032 and PLX4720 treatment compared to human BRAFV600E cell lines, with respect to decreased pERK signaling and cellular proliferation (Koya et al. 2012; A. I. Hooijkaas et al. 2012; Knight et al. 2013).
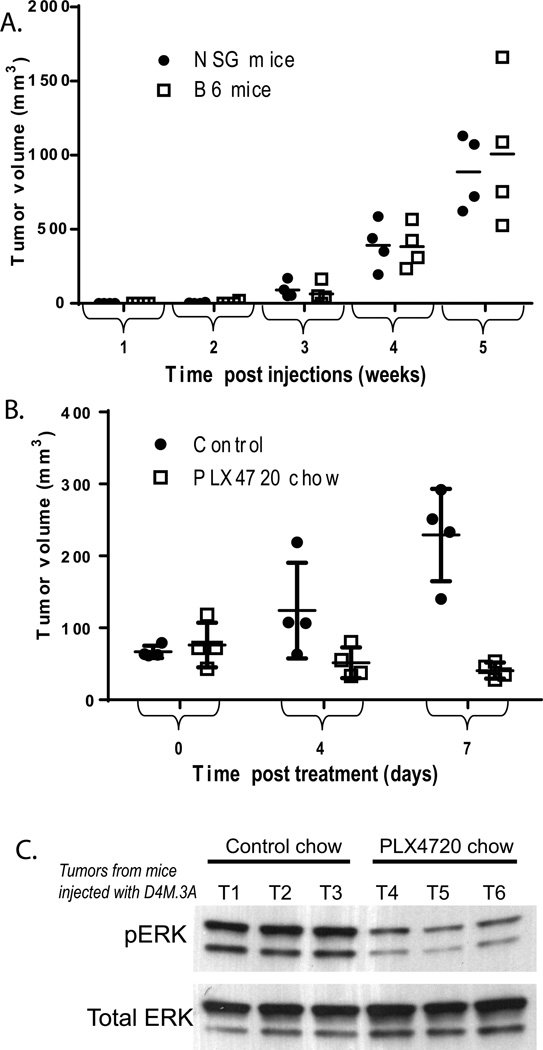
To assess the tumorigenicity of D4M melanoma cells, we intradermally injected a range (300–300,000) of cells into B6 and NSG host mice. Each concentration of cells was injected into four B6 and four NSG mice. Of the eight mice injected with 300 cells, no tumors developed in any of the mice after 27 weeks. In contrast, it took only two weeks for tumors to be observed in mice that received ≥3,000 cells, and only one week for tumors to be observed in mice that received 300,000 cells (Table 1). Tumors arose with similar kinetics in B6 and NSG host mice; there was no significant difference in the average tumor size between NSG and B6 mice injected with 3,000 D4M.3A cells, at any time point (Figure 3A). Histologic examination revealed no gross morphologic differences between tumors in B6 or NSG hosts (data not shown). We conclude that the D4M cells are equally tumorigenic in both immune-compromised and syngeneic hosts.
Table 1.
Time to 100% tumor incidence in mice injected intradermally with different concentrations of D4M.3A cells.
| Host | Number of cells injected |
Tumor incidence ratio (mice with tumors/total injected mice) |
||||
|---|---|---|---|---|---|---|
| 1 week | 2 weeks | 3 weeks | 4 weeks | 27 weeks | ||
| NSG | 300,000 | 3/4 | 4/4 | |||
| 30,000 | 2/4 | 4/4 | ||||
| 3,000 | 0/4 | 2/4 | 4/4 | |||
| 300 | 0/4 | 0/4 | 0/4 | 0/4 | 0/4 | |
| B6 | 300,000 | 4/4 | ||||
| 30,000 | 1/4 | 4/4 | ||||
| 3,000 | 0/4 | 1/4 | 3/4 | 4/4 | ||
| 300 | 0/4 | 0/4 | 0/4 | 0/4 | 0/4 | |
Figure 3. In vivo growth of D4M.3A cells.
(A) Four NSG and B6 mice were injected intradermally with 3,000 D4M.3A cells and tumor volumes (mm3) were measured weekly. Tumor volume means were not significantly different between NSG (dotted line) and B6 mice (filled line), via t-test analyses performed at each week. (B) Eight B6 mice were injected intradermally with 300,000 D4M.3A cells and grown for 8 days when tumors reached 5 mm in diameter. Four mice were then fed drug amixed chow containing PLX4720 and four mice were fed control chow (day 0), and tumor volumes (mm3) were measured 4 and 7 days post treatment. Tumor volume means at day 7 were significantly smaller (P < 0.005) in mice fed the PLX4720 chow compared to those fed the control chow. (C) Immunoblot of 5µg of protein lysates from tumor tissue of three mice treated with control chow (T1-T3) and three mice treated with PLX4720 chow (T4-T6).
We next tested the efficacy of PLX4720 (a sister compound of PLX4032) (Tsai et al. 2008) to inhibit tumor progression and phosphorylated ERK signaling in vivo. D4M.3A cells were injected intradermally into B6 mice (300,000 cells, per mouse). When tumors reached 5 mm in diameter (8 days post injections), mice were either given drug-amixed chow containing PLX4720 (Plexxikon, Berkeley, CA) or control chow. Tumors were measured 4 and 7 days after the start of treatment and tumor volumes were calculated. After 7 days of treatment, mice that were fed the PLX4720 chow had significantly smaller tumors than mice that were fed the control chow (Figure 3B, P < 0.05). Mice injected with D4M.7A cells showed comparable results, with smaller tumors after 7 days in mice fed the PLX4720 chow compared with those fed the control chow (data not shown). In addition, tumors in mice fed the PLX4720 chow for 7 days had decreased pERK levels compared to tumors in mice fed the control chow (Figure 3C).
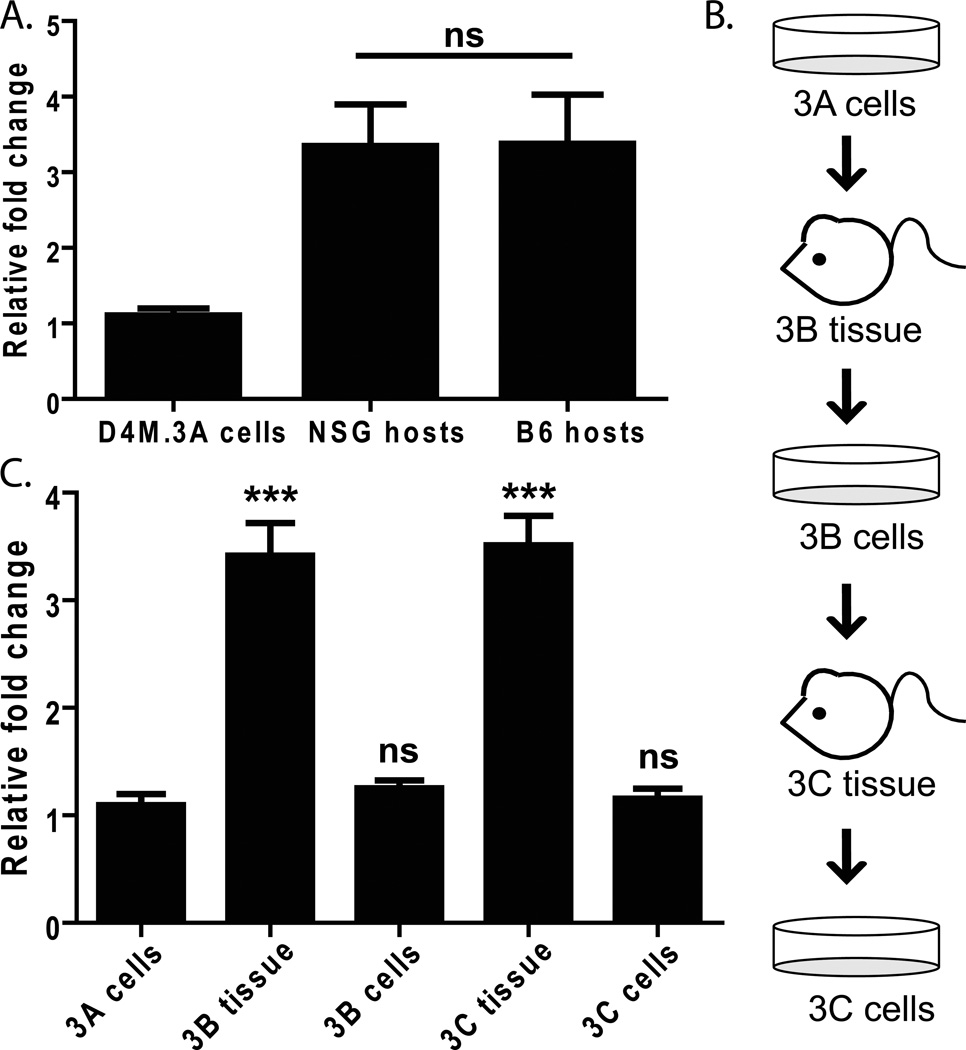
To further verify that D4M cell lines have melanoma characteristics, we examined expression of the murine melanoma marker, pmel. Several melanocyte differentiation antigens (MDAs), such as Pmel (also referred to as gp100) are widely expressed in human melanoma and recognized by tumor-infiltrating lymphocytes (Kawakami 1994), making it a potentially useful biomarker. We saw relatively low levels of pmel expression in D4M.3A cultured cells; however, expression increased in tumors that arose when D4M.3A cells were injected into either NSG or B6 mice (Figure 4A). Further, when these tumors were excised and re-cultured once or twice (Figure 4B), pmel levels fell in culture, but significantly increased again upon implantation into mice (Figure 4C, P<0.0005). This trend was also observed with Mart-1, Tryrosinase, and Tryp-1 expression (Supplementary Figure 2 and not shown). This indicates that D4M cells maintain the ability to express MDAs, in vivo and in vitro. Further, the in vivo upregulation of MDAs suggests that D4M cells are responding to host factors within the tumor microenvironment. The fact that pmel levels equally increase upon transplantation of the D4M cells into either NSG or B6 mice suggests that non-immune cells may be mediating most of this increase. Indeed, the stromal compartment of adjacent fibroblasts has been implicated as one prominent modulator of tumor cell behavior in vivo (Bhowmick et al. 2004; Smalley et al. 2005; Eck et al. 2009; Marsh et al. 2013). In addition, we have found discrepancies in the levels of gene expression between cultured human melanoma cells and those excised from nude mice (Croteau et al. 2012), underscoring the importance of utilizing both in vitro and in vivo model systems.
Figure 4. Expression of the melanoma specific antigen, pmel.
(A) RT-PCR comparing pmel expression in RNA made from D4M.3A cells and tumor tissue from NSG and B6 host mice injected with 3,000 D4M.3A cells. Samples were normalized to Gapdh and fold change was calculated relative to D4M.3A cells. T-test was performed comparing the averages of 4 NSG mice and 4 B6 mice. (B) Schematic of the protocol used to passage D4M.3A cells into mice (3B tissue), then back into culture (3B cells), and back into mice and culture (3C). (C) RNA was extracted from cells and tissue represented in 4B and pmel expression levels were measured with RT-PCR. All samples were normalized to Gapdh and fold change and significance were calculated relative to D4M.3A cells. T-test results are represented as: ns = not significant, * = P < 0.05, ** = P < 0.005, *** = P < 0.0005).
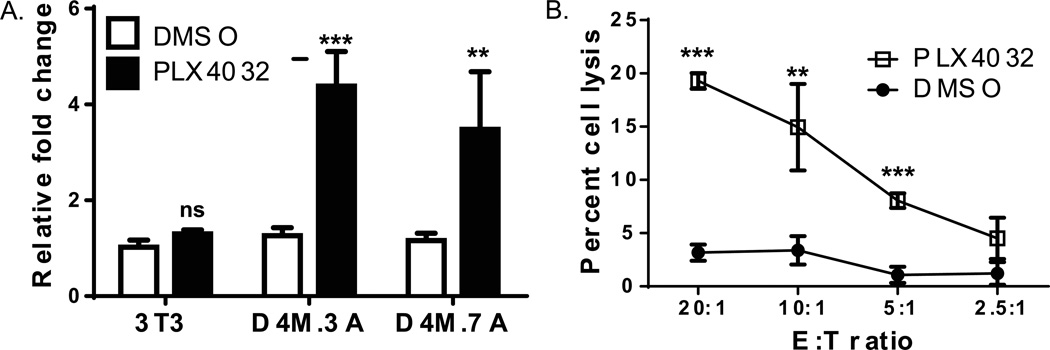
Investigations with human melanoma cell lines and clinical tissue samples demonstrate that PLX4720 (a precursor of PLX4032) (Tsai et al. 2008) treatment leads to increased expression of MDAs, such as Pmel (Boni et al. 2010; Frederick et al. 2013). Since D4M cells are sensitive to PLX4032, we treated cells with PLX4032 and analyzed mRNA levels of pmel. In D4M.3A and D4M.7A cell lines, basal levels of pmel were relatively low and comparable to levels in 3T3 cells. However, we observed an approximate 4-fold increase (P < 0.005) in pmel expression 48hrs after the addition of PLX4032 in these two D4M cell lines, but not in Brafwt 3T3 cells (D4M.3A - Figure 5A and D4M.7A - data not shown). Similarly, when the two human melanoma cell lines (VMM5 and VMM12) are treated with PLX4032 for 48 hrs, Pmel levels significantly increased, while no effect was observed in human dermal fibroblasts (HDFs) (Supplementary Figure 3).
Figure 5. PLX4032 increases functional pmel expression in D4M cells.
(A) RT-PCR comparing pmel expression in mouse 3T3, D4M.3A, and D4M.7A cell lines. Cells were plated in triplicate wells and treated with either DMSO or 3µM PLX4032 for 48 hrs. 3T3 cells were used as a negative control. Samples were normalized to Gapdh and fold change was calculated relative to 3T3 cells treated with DMSO. T-tests were performed on the averages of the triplicate wells, relative to DMSO treatment in each cell line. Error bars represent standard deviations of the means. (B) Chromium release assay of D4M.3A cells treated with either DMSO or 3µM PLX4032 for 72 hrs. Pmel transgenic T cells were incubated with D4M.3A cells for 4 hours and cell lysis was plotted with the different Effector to Target (E:T) ratios. Error bars represent standard deviations. T-test results are represented as: ns = not significant, * = P < 0.05, ** = P < 0.005, *** = P < 0.0005).
For functional analysis of Pmel antigen recognition, we used a cytotoxicity assay to assess melanoma cell sensitivity to lysis by Pmel TCR transgenic T cells (Overwijk et al. 2003). Activated Pmel T cells were added to DMSO or PLX4032-treated D4M.3A cells at different E:T ratios. PLX4032-treatment increased lysis of D4M.3A cells by Pmel T cells compared to DMSO-treatment (Figure 5B, P<0.005). EL-4 (antigen-negative) cells either pulsed or unpulsed with Pmel peptide were used as a control target, and Pmel T cells specifically recognized and lysed peptide-pulsed, but not unpulsed, EL-4 cells (data not shown). Taken together, these data are consistent with increased MDA expression in human melanoma cell lines in response to BRAFV600E inhibition (Boni et al. 2010), and further validate the D4M cell lines as bone fide melanoma cells and an appropriate murine model system. Although D4M cell lines do not have high endogenous levels of MDAs in vitro, our data illustrate that D4M.3A cells express Pmel in a functionally-relevant manner.
D4M cell lines recapitulate human BRAFV600E melanoma in vitro. However, unlike human cell line xenografts, D4M cell lines are readily transplantable into syngeneic host mice (Figure 3A), which will allow for immunological studies. The fact that there was no significant difference between tumorigenicity and tumor volume in NSG and B6 hosts could suggest that D4M cell lines are relatively non-immunogenic, like murine B16 cells (Leveson et al. 1979; Ashley & Kotlarski 1986). This is consistent with the expression of low levels of MDAs in culture and the relative paucity of immune cells in the tumor tissue (as seen by histology; data not shown).
Given the heterogeneity of human BRAFV600E melanoma cell lines, having multiple murine BRafV600E cell lines will be an important resource for the scientific community. The established BRafV600E SM1 cell line has been a useful model in supporting the therapeutic potential of combining BRAF inhibitors with immunotherapy (Knight et al. 2013). Future studies with D4M cells should be similarly useful in developing models of new therapeutic modalities. In addition, the fact that, at 3µM PLX4032, our D4M cells show substantial decreases in pERK and decrease in cell proliferation, indicates that our cell lines are distinct from those already published and will be a valuable contribution to the scientific community. In conclusion, our study describes a useful model of murine BRafV600E melanoma for in vitro and in vivo experiments. D4M cell lines grow readily in culture, are sensitive to PLX4032, and are transplantable in syngeneic hosts. These cell lines are stable and reproducible, allowing for biological replicates for in vitro and in vivo experiments, and may be of use to many investigators.
Supplementary Material
Acknowledgments
The authors thank Dr. Marcus Bosenberg for supplying Tyr::CreER;BrafCA;Ptenlox4-5/lox4-5 mice. We thank Dr. Shaofeng Yan, MD, for pathology analysis. We thank Diane Mellinger and Jennifer Fields for technical support. We thank Dr. Gideon Bollag and Plexxicon Inc. (Berkeley, CA) for use of control and PLX4720 mouse chow.
This research was funded, in part, by: NIH P30 - Center for Molecular, Cellular and Translational Research (P30RR032136); NIH T32 - Cancer Center Training Grant CA009658 (MHJ/CEB); NIH T32 – Immunology Training Grant AI007363 (MHJ/DWM); NIH T32 – Molecular and Cellular Biology Training Grant GM00874 (SMS/MJT); NIH R01 AR-26599 and CA-77267 (CEB); NIH R01 CA120777 (MJT); The American Cancer Society RSG LIB-121864 (MJT); the Melanoma Research Alliance Development Award (MJT); Hitchcock Foundation Pilot Studies Award (DWM and CEB); and NIH R01 CA134799 (DWM).
References
- Ashley MP, Kotlarski I. In vivo cytotoxic responses induced by allogeneic normal and neoplastic cells in mice: relative lack of immunogenicity of B16 melanoma cells. Cellular immunology. 1986;101(1):156–167. doi: 10.1016/0008-8749(86)90194-2. [DOI] [PubMed] [Google Scholar]
- Balch CM, et al. An evidence-based staging system for cutaneous melanoma. CA: A Cancer Journal for Clinicians. 2004;54(3):131–149. doi: 10.3322/canjclin.54.3.131. quiz 182–4. [DOI] [PubMed] [Google Scholar]
- Bhowmick NA, Neilson EG, Moses HL. Stromal fibroblasts in cancer initiation and progression. Nature. 2004;432(7015):332–337. doi: 10.1038/nature03096. [DOI] [PMC free article] [PubMed] [Google Scholar]
- Blackburn JS, et al. A matrix metalloproteinase-1/protease activated receptor-1 signaling axis promotes melanoma invasion and metastasis. Oncogene. 2009;28(48):4237–4248. doi: 10.1038/onc.2009.272. [DOI] [PMC free article] [PubMed] [Google Scholar]
- Blackburn JS, et al. RNA interference inhibition of matrix metalloproteinase-1 prevents melanoma metastasis by reducing tumor collagenase activity and angiogenesis. Cancer Research. 2007;67(22):10849–10858. doi: 10.1158/0008-5472.CAN-07-1791. [DOI] [PubMed] [Google Scholar]
- Boni A, et al. Selective BRAFV600E inhibition enhances T-cell recognition of melanoma without affecting lymphocyte function. Cancer Research. 2010;70(13):5213–5219. doi: 10.1158/0008-5472.CAN-10-0118. [DOI] [PubMed] [Google Scholar]
- Chapman PB, et al. Improved survival with vemurafenib in melanoma with BRAF V600E mutation. The New England journal of medicine. 2011;364(26):2507–2516. doi: 10.1056/NEJMoa1103782. [DOI] [PMC free article] [PubMed] [Google Scholar]
- Croteau W, et al. Differential mechanisms of tumor progression in clones from a single heterogeneous human melanoma. Journal of Cellular Physiology. 2012 doi: 10.1002/jcp.24225. [DOI] [PMC free article] [PubMed] [Google Scholar]
- Dankort D, et al. Braf(V600E) cooperates with Pten loss to induce metastatic melanoma. Nature Genetics. 2009;41(5):544–552. doi: 10.1038/ng.356. [DOI] [PMC free article] [PubMed] [Google Scholar]
- Dhomen N, et al. Oncogenic Braf induces melanocyte senescence and melanoma in mice. Cancer cell. 2009;15(4):294–303. doi: 10.1016/j.ccr.2009.02.022. [DOI] [PubMed] [Google Scholar]
- Eberle J, Wagner M, Macneil S. Human Melanoma Cell Lines Show Little Relationship Between Expression of Pigmentation Genes and Pigmentary Behaviour In Vitro. Pigment Cell Research. 1998;11(3):134–142. doi: 10.1111/j.1600-0749.1998.tb00723.x. [DOI] [PubMed] [Google Scholar]
- Eck SM, et al. Matrix metalloproteinase and G protein coupled receptors: co-conspirators in the pathogenesis of autoimmune disease and cancer. Journal of Autoimmunity. 2009;33(3–4):214–221. doi: 10.1016/j.jaut.2009.09.011. [DOI] [PMC free article] [PubMed] [Google Scholar]
- Frederick DT, et al. BRAF inhibition is associated with enhanced melanoma antigen expression and a more favorable tumor microenvironment in patients with metastatic melanoma. Clinical cancer research : an official journal of the American Association for Cancer Research. 2013;19(5):1225–1231. doi: 10.1158/1078-0432.CCR-12-1630. [DOI] [PMC free article] [PubMed] [Google Scholar]
- Herlyn M, Fukunaga-Kalabis M. What is a good model for melanoma? The Journal of investigative dermatology. 2010;130(4):911–912. doi: 10.1038/jid.2009.441. [DOI] [PubMed] [Google Scholar]
- Hooijkaas A, et al. Selective BRAF inhibition decreases tumor-resident lymphocyte frequencies in a mouse model of human melanoma. Oncoimmunology. 2012;1(5):609–617. doi: 10.4161/onci.20226. [DOI] [PMC free article] [PubMed] [Google Scholar]
- Hooijkaas AI, et al. Targeting BRAFV600E in an inducible murine model of melanoma. The American journal of pathology. 2012;181(3):785–794. doi: 10.1016/j.ajpath.2012.06.002. [DOI] [PubMed] [Google Scholar]
- Huntington JT, et al. Overexpression of collagenase 1 (MMP-1) is mediated by the ERK pathway in invasive melanoma cells: role of BRAF mutation and fibroblast growth factor signaling. The Journal of Biological Chemistry. 2004;279(32):33168–33176. doi: 10.1074/jbc.M405102200. [DOI] [PubMed] [Google Scholar]
- Joseph EW, et al. The RAF inhibitor PLX4032 inhibits ERK signaling and tumor cell proliferation in a V600E BRAF-selective manner. Proceedings of the National Academy of Sciences of the United States of America. 2010;107(33):14903–14908. doi: 10.1073/pnas.1008990107. [DOI] [PMC free article] [PubMed] [Google Scholar]
- Kawakami Y. Identification of a Human Melanoma Antigen Recognized by Tumor-Infiltrating Lymphocytes Associated with in vivo Tumor Rejection. Proceedings of the National Academy of Sciences. 1994;91(14):6458–6462. doi: 10.1073/pnas.91.14.6458. [DOI] [PMC free article] [PubMed] [Google Scholar]
- Khalili JS, et al. Oncogenic BRAF(V600E) Promotes Stromal Cell-Mediated Immunosuppression Via Induction of Interleukin-1 in Melanoma. 2012. [DOI] [PMC free article] [PubMed] [Google Scholar]
- Knight DA, et al. Host immunity contributes to the anti-melanoma activity of BRAF inhibitors. The Journal of clinical investigation. 2013;123(3):1371–1381. doi: 10.1172/JCI66236. [DOI] [PMC free article] [PubMed] [Google Scholar] [Retracted]
- Koya RC, et al. BRAF inhibitor vemurafenib improves the antitumor activity of adoptive cell immunotherapy. Cancer Research. 2012:192. doi: 10.1158/0008-5472.CAN-11-2837. [DOI] [PMC free article] [PubMed] [Google Scholar]
- Lee J-H, Choi J-W, Kim Y-S. Frequencies of BRAF and NRAS mutations are different in histological types and sites of origin of cutaneous melanoma: a meta-analysis. The British journal of dermatology. 2011;164(4):776–784. doi: 10.1111/j.1365-2133.2010.10185.x. [DOI] [PubMed] [Google Scholar]
- Leveson SH, et al. Correlations between the leukocyte adherence inhibition microassay and in vivo tests of transplantation resistance. Cancer research. 1979;39(2 Pt 2):582–586. [PubMed] [Google Scholar]
- Long GV, et al. Prognostic and clinicopathologic associations of oncogenic BRAF in metastatic melanoma. Journal of clinical oncology : official journal of the American Society of Clinical Oncology. 2011;29(10):1239–1246. doi: 10.1200/JCO.2010.32.4327. [DOI] [PubMed] [Google Scholar]
- Marsh T, Pietras K, McAllister SS. Fibroblasts as architects of cancer pathogenesis. Biochimica et biophysica acta. 2013;1832(7):1070–1078. doi: 10.1016/j.bbadis.2012.10.013. [DOI] [PMC free article] [PubMed] [Google Scholar]
- Menzies AM, et al. Distinguishing clinicopathologic features of patients with V600E and V600K BRAF-mutant metastatic melanoma. Clinical cancer research : an official journal of the American Association for Cancer Research. 2012;18(12):3242–3249. doi: 10.1158/1078-0432.CCR-12-0052. [DOI] [PubMed] [Google Scholar]
- Overwijk WW, et al. Tumor regression and autoimmunity after reversal of a functionally tolerant state of self-reactive CD8+ T cells. The Journal of experimental medicine. 2003;198(4):569–580. doi: 10.1084/jem.20030590. [DOI] [PMC free article] [PubMed] [Google Scholar]
- Rubinstein JC, et al. Incidence of the V600K mutation among melanoma patients with BRAF mutations, and potential therapeutic response to the specific BRAF inhibitor PLX4032. Journal of translational medicine. 2010;8:67. doi: 10.1186/1479-5876-8-67. [DOI] [PMC free article] [PubMed] [Google Scholar]
- Smalley KSM, Lioni M, Herlyn M. Targeting the stromal fibroblasts: a novel approach to melanoma therapy. Expert Review of Anticancer Therapy. 2005;5(6):1069–1078. doi: 10.1586/14737140.5.6.1069. [DOI] [PubMed] [Google Scholar]
- Straussman R, et al. Tumour micro-environment elicits innate resistance to RAF inhibitors through HGF secretion. Nature. 2012;487(7408):500–504. doi: 10.1038/nature11183. [DOI] [PMC free article] [PubMed] [Google Scholar]
- Tsai J, et al. Discovery of a selective inhibitor of oncogenic B-Raf kinase with potent antimelanoma activity. Proceedings of the National Academy of Sciences of the United States of America. 2008;105(8):3041–3046. doi: 10.1073/pnas.0711741105. [DOI] [PMC free article] [PubMed] [Google Scholar]
- Vultur A, Villanueva J, Herlyn M. Targeting BRAF in advanced melanoma: a first step toward manageable disease. Clinical cancer research : an official journal of the American Association for Cancer Research. 2011;17(7):1658–1663. doi: 10.1158/1078-0432.CCR-10-0174. [DOI] [PMC free article] [PubMed] [Google Scholar]
- Yamshchikov GV, et al. Sequential immune escape and shifting of T cell responses in a long-term survivor of melanoma. Journal of Immunology. 2005;174(11):6863–6871. doi: 10.4049/jimmunol.174.11.6863. [DOI] [PubMed] [Google Scholar]
- Yang H, et al. RG7204 (PLX4032), a selective BRAFV600E inhibitor, displays potent antitumor activity in preclinical melanoma models. Cancer research. 2010;70(13):5518–5527. doi: 10.1158/0008-5472.CAN-10-0646. [DOI] [PubMed] [Google Scholar]
Associated Data
This section collects any data citations, data availability statements, or supplementary materials included in this article.


