Abstract
Objectives
To date, studies have not comprehensively demonstrated the relationship between stroke incidence and socioeconomic status. This study investigated stroke incidence by household income level in conjunction with age, sex, and stroke subtype in Korea.
Methods
Contributions by the head of household were used as the basis for income levels. Household income levels for 21 766 036 people were classified into 6 groups. The stroke incidences were calculated by household income level, both overall within income categories and further by age group, sex, and stroke subtype. To present the inequalities among the six ranked groups in a single value, the slope index of inequality and relative index of inequality were calculated.
Results
In 2005, 57 690 people were first-time stroke patients. The incidences of total stroke for males and females increased as the income level decreased. The incidences of stroke increased as the income level decreased in those 74 years old and under, whereas there was no difference by income levels in those 75 and over. Intracerebral hemorrhage for the males represented the highest inequality among stroke subtypes. Incidences of subarachnoid hemorrhage did not differ by income levels.
Conclusions
The incidence of stroke increases as the income level decreases, but it differs according to sex, age, and stroke subtype. The difference in the relative incidence is large for male intracerebral hemorrhage, whereas the difference in the absolute incidence is large for male ischemic stroke.
Keywords: Stroke, Incidence, Income class, Republic of Korea
INTRODUCTION
Although the number of deaths from stroke has been steadily decreasing since the twentieth century in developed countries, the prevalence and incidence of stroke has not been significantly reduced because of the aging of populations and the development of diagnostic techniques [1,2].
While advances in medical technology have increased the percentage of patients that survive after stroke, there is also an increasing trend in the number of disabled stroke patients [3]. The incidence of stroke significantly increases with age; approximately 75% to 89% of stroke incidence occurs in individuals 65 years and over [4].
As of 2011, 17 studies on the relationship between stroke incidence and socioeconomic status showed mixed results that depended on how occupation, education, income, wealth, and the deprivation index were measured [5,6,7,8,9,10,11,12,13,14,15,16,17,18,19,20,21]. Overall, the incidence of stroke was found to be negatively associated with socioeconomic status. This trend was similar regardless of whether the study subjects were males or females, had regional or national residence, were over or under 65 years old, or had an ischemic or hemorrhagic stroke subtype. However, in some cases, groups over the age of 65 or 75 with high socioeconomic status had a higher incidence of stroke than the group with lower socioeconomic status [16,18,21].
To date, studies have not included men and women of all ages and stroke subtypes. Therefore, those studies cannot comprehensively demonstrate the relationship between stroke incidence and socioeconomic status.
Accordingly, we investigated the relationship between stroke incidence and socioeconomic status by targeting the general public in Korea and including both sexes, all ages, and all stroke subtypes.
METHODS
Study Population
Stroke patients in 2005 were defined as patients who were admitted to the hospital (inpatients) between January 1 and December 31, 2005 with stroke as the principal or secondary diagnosis. Individuals were excluded if they had been hospitalized between 1998 and 2004 with stroke as the principal or secondary diagnosis. Therefore, the study subjects had been admitted to the hospital with stroke as the principal or secondary diagnosis for the first time, and they had no previous record of hospitalization from stroke. Following the diagnostic codes of the International Classification of Diseases (10th revision), the stroke subtypes were classified as I60-I69 for total strokes, I63 for ischemic stroke, I60-I62 for hemorrhagic stroke, I61 for intracerebral hemorrhage (ICH), and I60 for subarachnoid hemorrhage (SAH).
The sample included 21 766 036 people (46.3% of the total population of Korea in 2005), including the "self-employed insured" with National Health Insurance and Medical Aid beneficiaries [22] (similar to Medicaid in the US). Income-related data were attached to this information. Demographic variables (sex and age), the type of medical coverage (self-employed insured with National Health Insurance and Medical Aid beneficiaries), and income-related data (contributions) were included.
The National Health Insurance "employee insured," who constitute almost half of the nation's population, were excluded from the analysis because these individuals do not have the burden of providing additional contributions for registering dependents; instead, they register their dependents for National Health Insurance even if they are not living together, which reduces the contribution burden. Most dependents of the self-employed insured actually live with the insured person and have a similar income level. In contrast, many dependents of the employee insured do not live at the same residence and may be at different income levels. Therefore, they were excluded from the analysis.
Socioeconomic Status
The target population was divided into self-employed insured and Medical Aid beneficiaries. The self-employed insured were subdivided into five groups based on income level. That is, the self-employed insured were first arranged according to their contribution score and then divided into quintiles. We classified the top 20% as group 1 (contribution score, over 712), the top 21% to 40% as group 2 (contribution score, 503 to 711), the top 41% to 60% as group 3 (contribution score, 351 to 502), the top 61% to 80% as group 4 (contribution score, 207 to 350), and the bottom 20% as group 5 (contribution score: 0 to 206). Medical Aid beneficiaries were classified separately. Contributions by the head of household were used as the basis for income levels. At the time of the study, dependents applied their contributions to the head of household. Contributions were reported by December 31, 2004, which is directly before the determination of stroke incidence in 2005.
Statistical Analyses
Age-standardized rates were based on 100 000 people and were calculated using the direct method by five-year age units. For the standard population, the five-year age distribution for the 2005 Korea census population was used.
To present the inequalities among the six ranked groups into a single value, two types of regression-based measurements were used. Using the slope index of inequality (SII) and the relative index of inequality (RII), we analyzed the absolute and relative differences in stroke incidence. The SII shows the absolute numerical difference in stroke incidence between the lowest income groups and the highest income group, while the RII shows the relative numerical difference in stoke incidence between the two groups. The SII and the RII have the advantage of representing the inequalities of the entire population as a single indicator. The indices compare the differences in incidences or mortality rates for each social class, taking into account the population size for each social class [23]. The RII was calculated using logistic regression, and the SII was calculated using Poisson regression. All of the analyses were completed using the computer software SAS version 9.2 (SAS Inc., Cary, NC, USA).
RESULTS
In 2005, 57 690 people were admitted to the hospital as first-time stroke inpatients (I60-I69). Among them, 34 586 patients had ischemic stroke (I63, 59.9% of total strokes), and 12 632 patients had hemorrhagic stroke (I60-I62, 21.9% of total strokes). When the hemorrhagic stroke was subdivided, 7656 patients had ICH (I61, 13.3% of total strokes and 60.6% of hemorrhagic stroke), and 3324 patients had SAH (I60, 5.8% of total strokes and 26.3% of hemorrhagic stroke).
The age-standardized incidences of total stroke (I60-I69) for males and females increased as the income level decreased (Table 1). In males, the age-standardized incidence of total stroke for Medical Aid beneficiaries was approximately two times higher than that of group 1. In contrast, Medical Aid beneficiaries 85 years and older had a lower incidence of stroke than the self-employed insured in groups 1 to 5. In females, the age-standardized incidence of total stroke for Medical Aid beneficiaries was approximately 1.7 times higher than that of group 1.
Table 1.
Incidence (per 100 000) of total stroke by age, sex, and socioeconomic status group in Korea, 2005
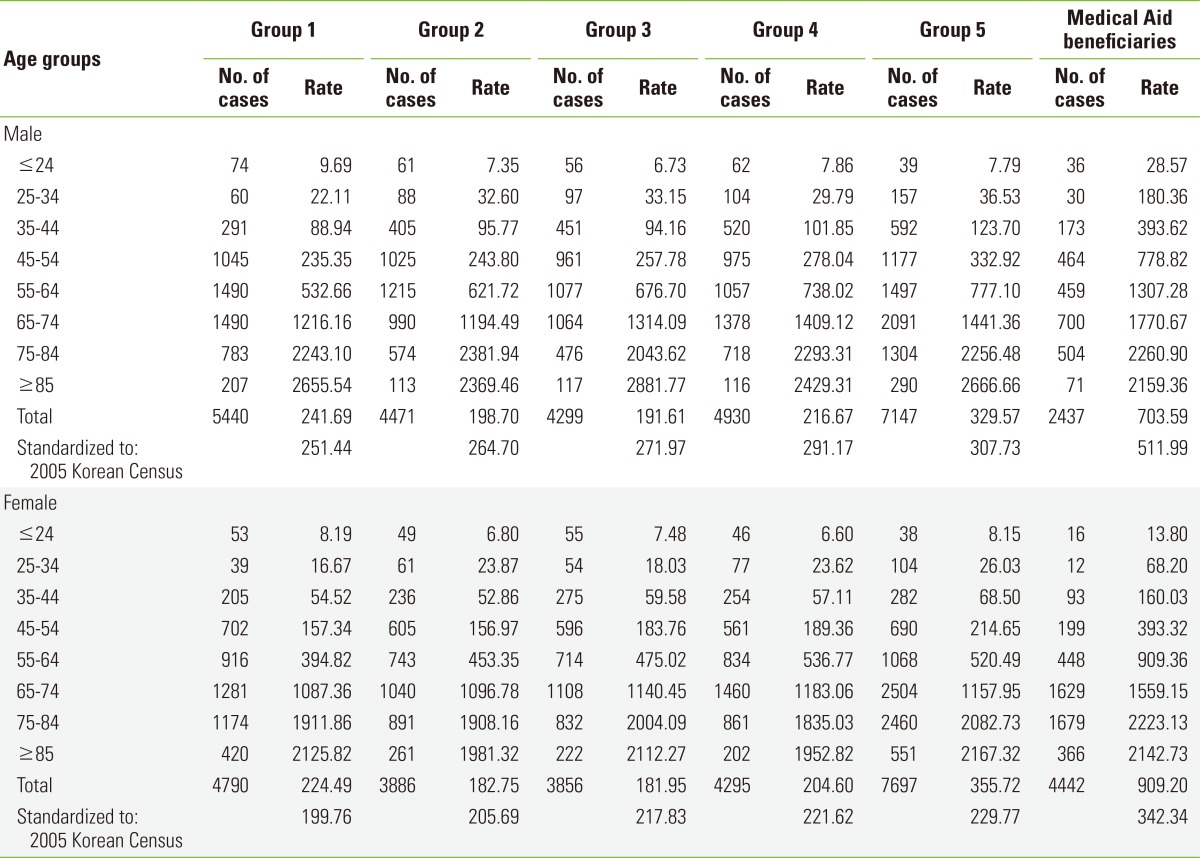
Table 2 compares the males' relative ratio of the incidences by income groups, with group 1 as the reference group, for each stroke subtype in the age groups 44 years and under, 45 to 59 years, 60 to 74 years, and 75 years and over. The incidence of total stroke and ischemic stroke increased as the income level decreased for individuals 74 years and under, whereas for individuals 75 years and over, there was no difference in the relative ratio of the incidences by income groups. The incidence of hemorrhagic stroke and intracerebral hemorrhage for Medical Aid beneficiaries was lower than the rates for those that were self-employed insured and 60 years and over. For individuals aged 75 and over with hemorrhagic stroke, the incidence for Medical Aid beneficiaries was only 0.36 times the rate for group 1. The relative ratio of the incidence for males with subarachnoid hemorrhage was lower for all ages among Medical Aid beneficiaries than among the self-employed insured.
Table 2.
Male relative ratio by age, socioeconomic status group, and stroke subtype
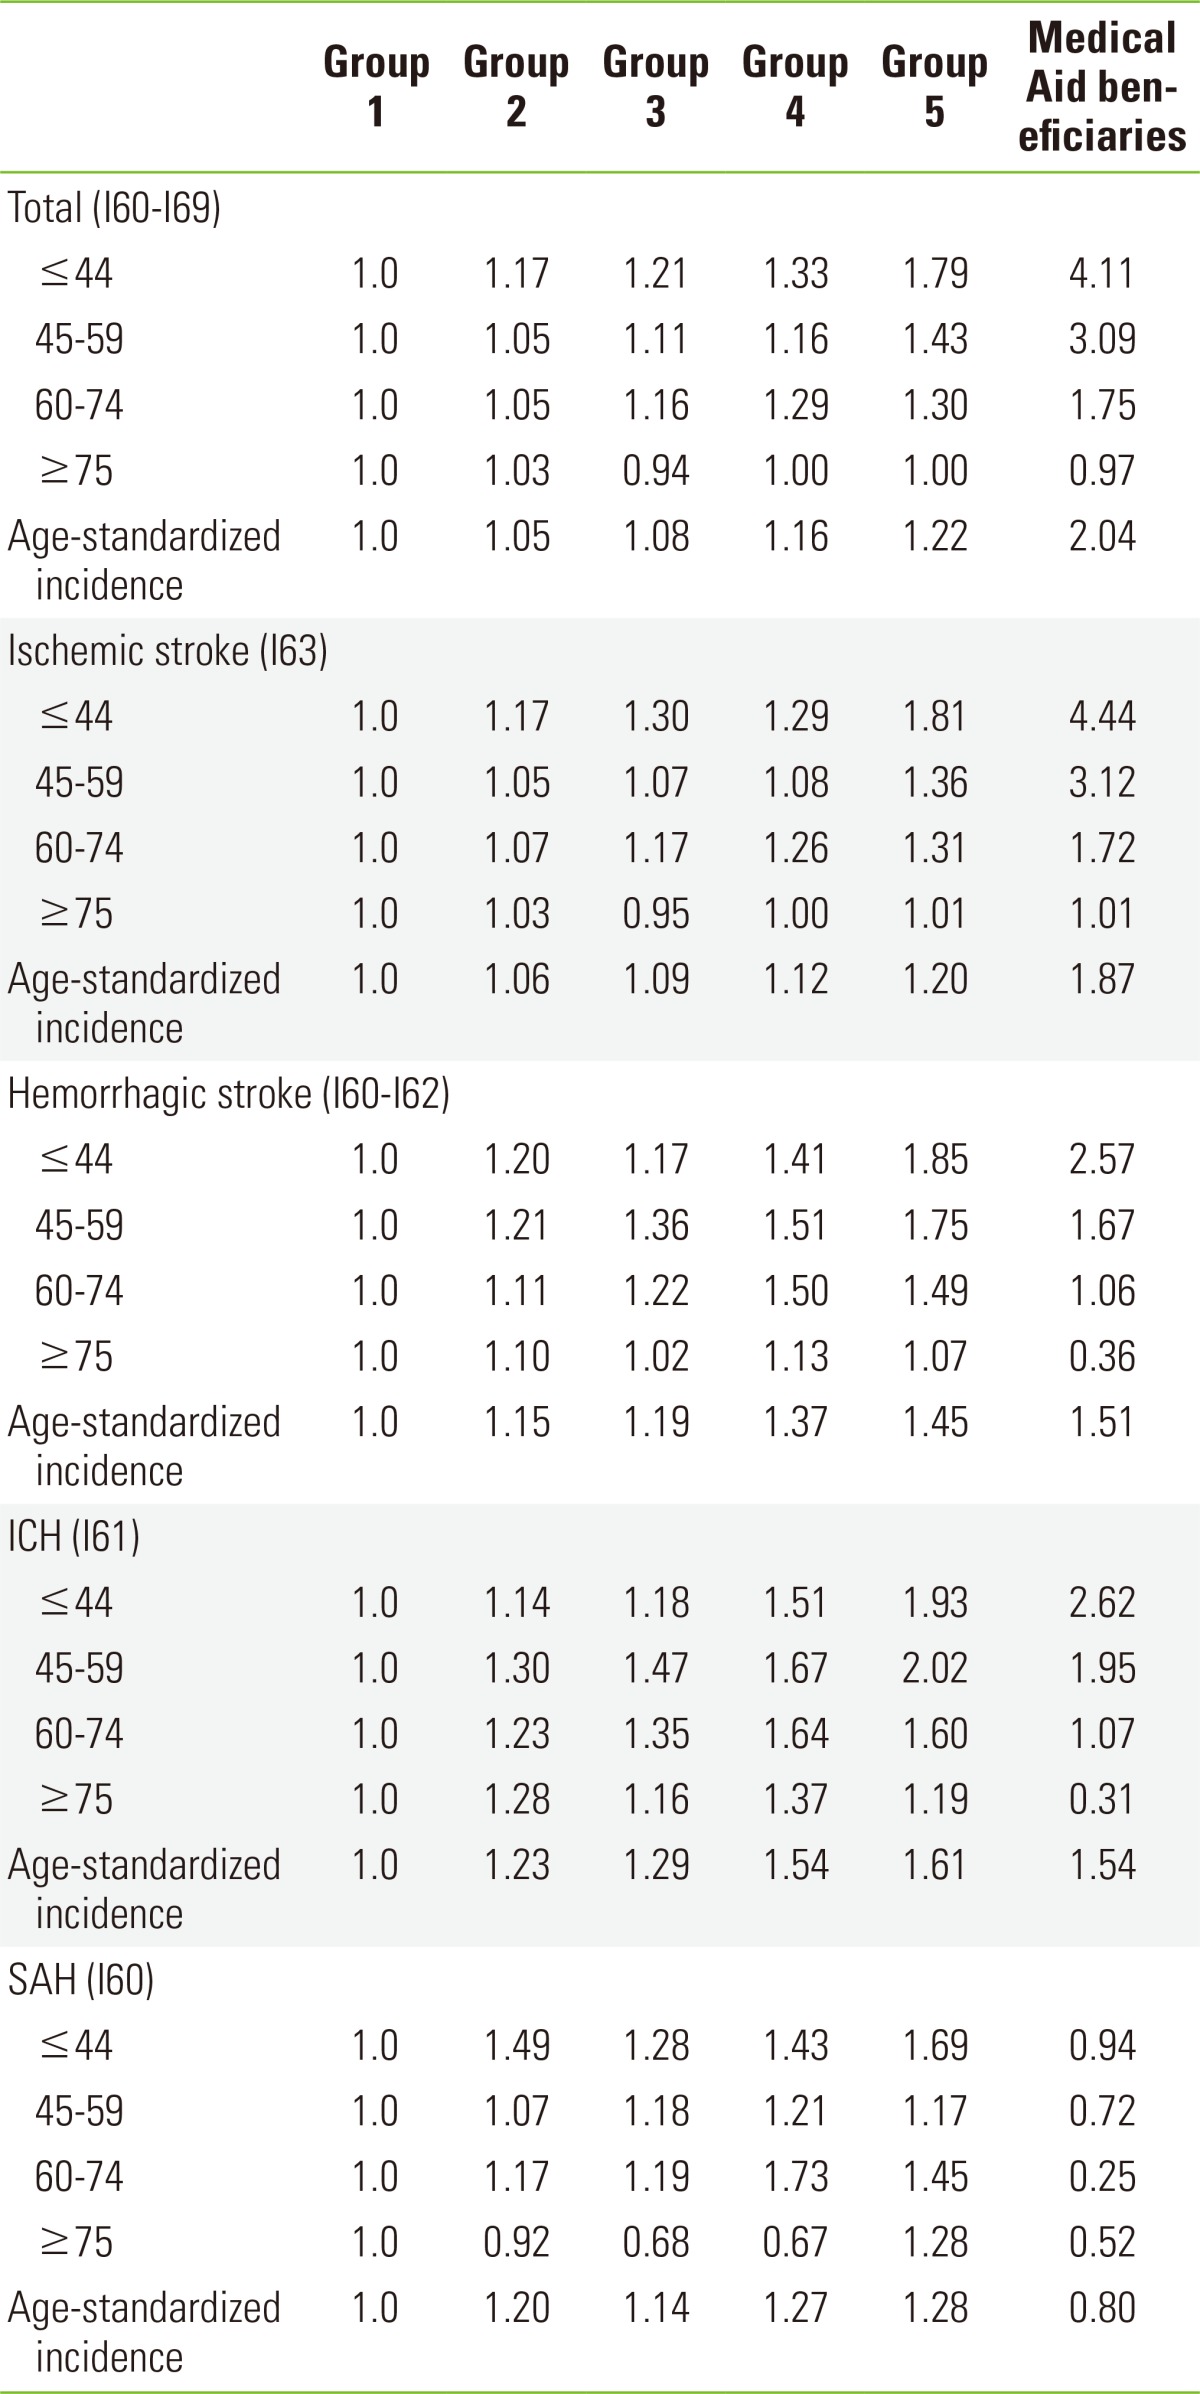
ICH, intracerebral hemorrhage; SAH, subarachnoid hemorrhage.
The relative ratio of total stroke and ischemic stroke incidences for females increased as the income level decreased for all ages (Table 3). The relative ratio of the hemorrhagic stroke incidence for females had similar characteristics to the relative ratio of the hemorrhagic stroke incidence for males. The difference in incidences by income levels was greater for males than for females. For individuals 60 years and over other than Medical Aid beneficiaries, there was almost no difference in the relative ratio of the hemorrhagic stroke incidence for each income level. For males with hemorrhagic stroke, the relative ratio of the incidence increased as the income level decreased for those under the age of 75, and there was not much difference between the income levels for those aged 75 and over; for females, the pattern changed starting at age 60. That is, the difference in the females' relative ratio of hemorrhagic stroke incidence according to income level did not show a consistent pattern for those 60 and over. Moreover, for female Medical Aid beneficiaries aged 60 and over, the hemorrhagic stroke incidence was lower than the incidence for self-employed insured of the same age. For those 75 and over, the incidence for Medical Aid beneficiaries was 0.42 times that of group 1. The relative ratio of the incidence for females with subarachnoid hemorrhage was lower for all ages in Medical Aid beneficiaries than in the self-employed insured.
Table 3.
Female relative ratio by age, socioeconomic status group, and stroke subtype
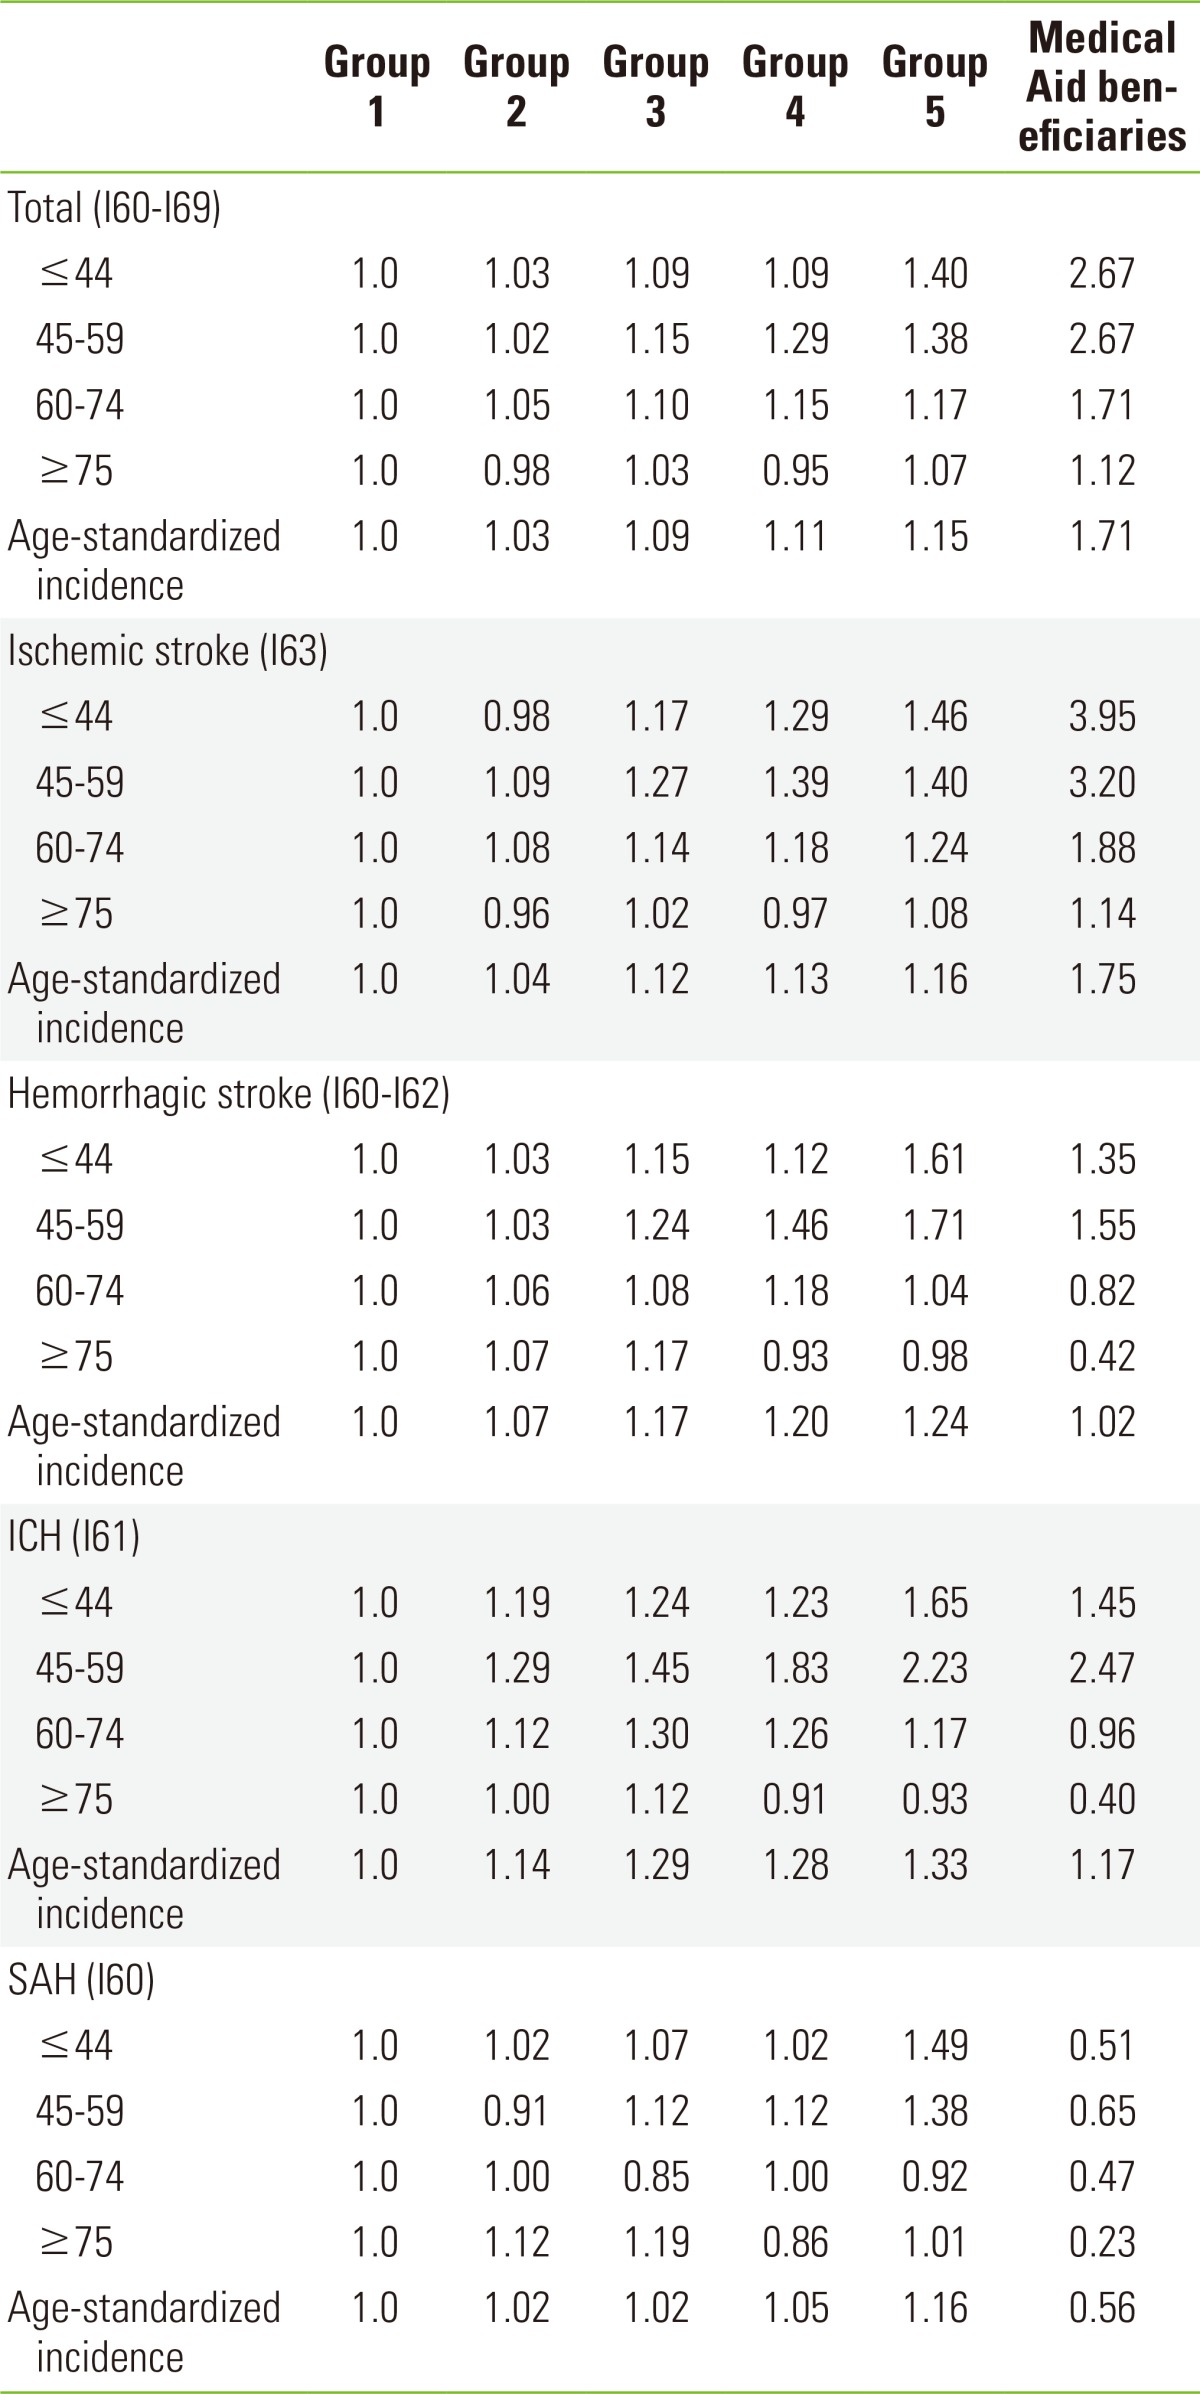
ICH, intracerebral hemorrhage; SAH, subarachnoid hemorrhage.
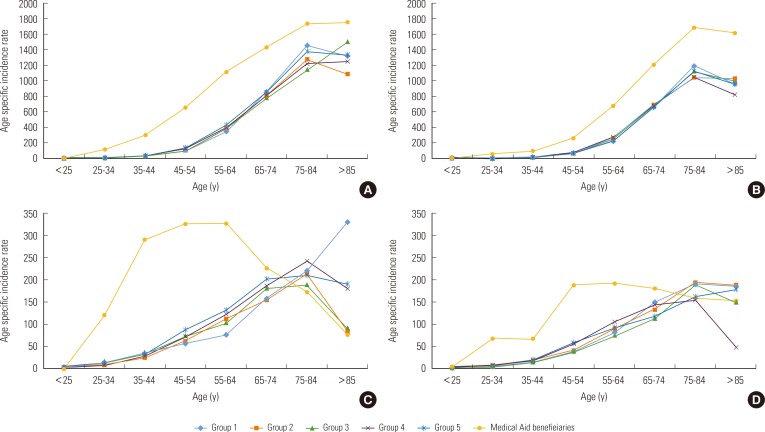
Figure 1 shows graphs of age-specific incidences, separately by sex for ischemic stroke (I63) and hemorrhagic stroke (I60-I62) by 10-year age cohorts in each income level. For ischemic stroke, Medical Aid beneficiaries had a higher ischemic stroke incidence than the self-employed insured both males and females. In the case of hemorrhagic stroke for both males and females aged 64 and under, the incidence was higher for Medical Aid beneficiaries than for the self-employed insured. However, for the 65 and over group, the incidence for Medical Aid beneficiaries was even lower than for the self-employed insured. For ages 85 and above, group 1 had the highest incidence of male hemorrhagic stroke among the self-employed insured and Medical Aid beneficiaries.
Figure 1.
Age-specific incidences by sex, socioeconomic status group, and stroke subtype (per 100 000). (A) Age-specific incidences of ischemic stroke in males. (B) Age-specific incidences of ischemic stroke in females. (C) Age-specific incidences of hemorrhagic stroke in males. (D) Age-specific incidences of hemorrhagic stroke in females.
Table 4 shows the SII and the RII by sex and stroke subtype. Note that the RII divides the SII by the average health levels of the entire group. For males, the intracerebral hemorrhage RII was 1.791, which represented the highest inequality among the subtypes. These inequalities in the incidence of stroke according to income level were statistically significant. However, subarachnoid hemorrhage did not show statistical significance. For females, the ischemic stroke RII was 1.440, whereas the RII for total strokes was 1.394. These inequalities were statistically significant; however, hemorrhagic stroke, intracerebral hemorrhage, and subarachnoid hemorrhage did not show statistically significant inequalities in the incidence of stroke. An examination of the males' SII showed that the incidence of total stroke per 100 000 individuals in the lowest income group was higher than in the group with the highest income level; there were 212.3 more males for total strokes. Subarachnoid hemorrhage occurred less frequently by 3.8 patients for the females.
Table 4.
RII (95% CI) and SII (per 100 000) by sex and stroke subtype
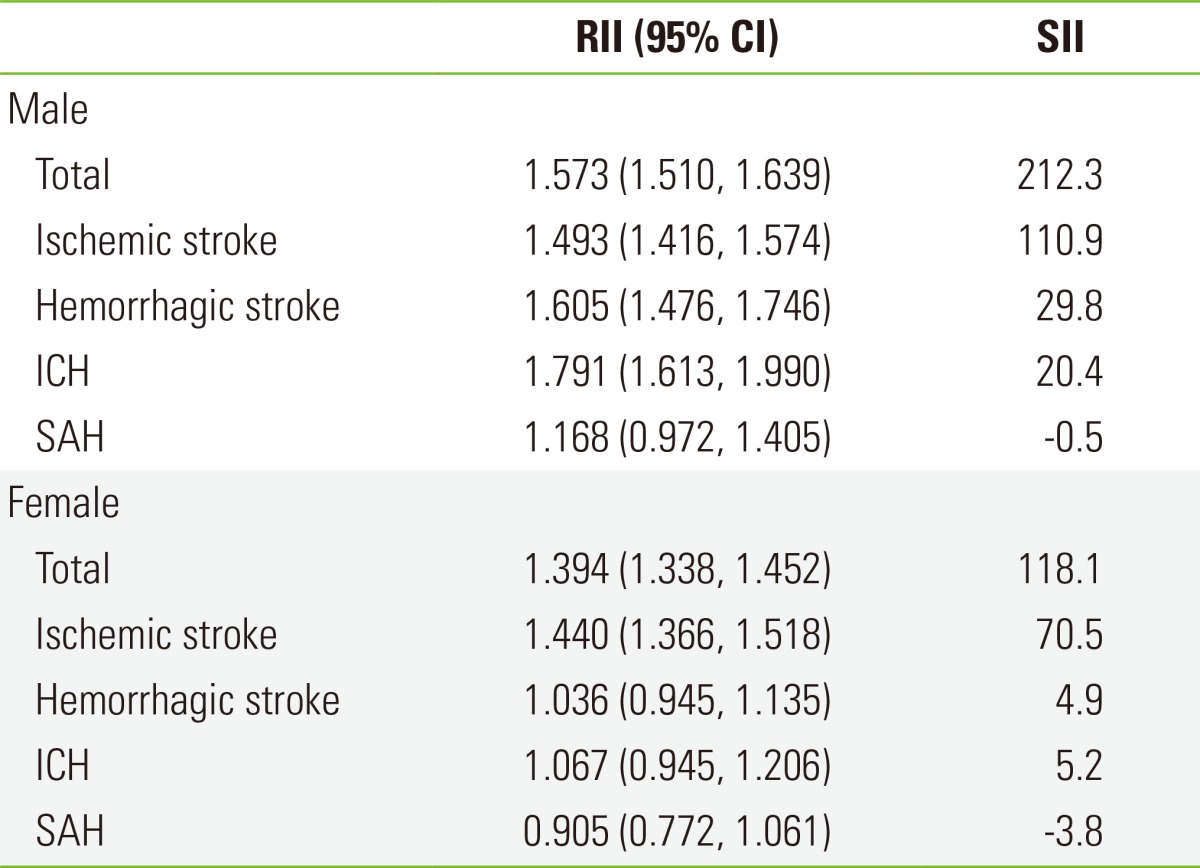
RII, relative index of inequality; CI, confidential interval; SII, slope index of inequality; ICH, intracerebral hemorrhage; SAH, subarachnoid hemorrhage.
DISCUSSION
This study showed that the incidence of stroke increased as the income level decreased, but there were slightly different patterns than in previous studies. These patterns can be summarized in three points.
First, for total strokes in individuals aged 75 and over, without subtype or sex distinctions, there were no differences in the incidence of stroke by income level, but there was an increasing trend in the incidence in the high income level group. Studies by van Rossum et al. [5], Avendano et al. [15], and Grimaud et al. [21] reported no differences in the incidences of stroke by income level and no increases in the incidence of stroke at high income levels for those aged 75 and over. The reduced effects of socioeconomic status on stroke incidence for individuals over a certain age can be explained by two hypotheses. The first hypothesis is that of "selective survival", in which more people in the low-income bracket die, for various reasons, than those in the high-income bracket. As a result, aging survivors in the low-income bracket are more likely to be selected among healthy individuals and cannot be compared with individuals in the high-income bracket [16,18,21]. This trend can be observed in our study, but the age at which the effects of socioeconomic status on stroke are reduced was different for each stroke subtype. Furthermore, the present finding that socioeconomic status was not relevant to the incidence of subarachnoid hemorrhage may be considered a new discovery. The second hypothesis was that of a "cohort and period effect", which means that the extent of the effect of socioeconomic status on the stroke incidence varies according to the "cohort" or the "period". For example, variation in socioeconomic status and variation in risk factors related to socioeconomic status in the aging population is smaller compared to other groups. Thus, the relationship between socioeconomic status and stroke incidence can be weaker than it is in lower age groups [18].
Second, in case of hemorrhagic stroke and intracerebral hemorrhage, for males under age 75 and females under age 60, there was a trend toward an increasing incidence of stroke as the income level decreased. However, over these ages, we were unable to find consistent characteristics linking stroke and income level. For the poverty bracket (Medical Aid beneficiaries), individuals aged 60 and over had lower incidence of stroke than the top 20% income bracket. Although there have been many previous studies on total strokes with no distinction among stroke subtypes, there have been relatively fewer studies that distinguish between hemorrhagic stroke and intracerebral hemorrhage. In 2008, Li et al. [19] found that the relationship between income and hemorrhagic stroke was not statistically significant (males p=0.18, females p=0.21). A 2009 study by Cesaroni et al. [20] showed that for males, the highest risk of stroke, which was statistically significant, was found in groups 2, 4, and 5, where group 1 was the highest income level; for females, a statistically significant risk of stroke was high only in group 5, the lowest income level. In 2001, Jakovljevic et al. [10] considered intracerebral hemorrhage. Compared to the group with the highest income level, the risk of stroke increased as the income level decreased in males and females aged 25 to 59 and in males 60 to 74 years old. However, for females 60 to 74 years old, the middle income group had the highest risk of stroke, and the group with the lowest income had the lowest risk of stroke. As shown in the above studies, there have been inconsistent findings on the relationship between the risk of hemorrhagic stroke and income level. Moreover, it is difficult to directly compare previous studies with the present study because they did not include ages 75 years old and above or they did not subdivide the ages. This may be because the incidence of hemorrhagic stroke is relatively smaller than the incidence of ischemic stroke in developed countries, which conduct most stroke research. Therefore, the incidence of hemorrhagic stroke may have been too small to divide into a subtype.
Third, in the case of subarachnoid hemorrhage for males and females, we were unable to find a consistent relationship between income level and incidence. In a 2001 study by Jakovljevic et al. [11], the risks of stroke were higher in the lower income groups than in the high income group, but the risks of stroke did not increase as the income level decreased.
The present study makes a number of contributions. First, the findings are nationally representative because the study subjects were the self-employed insured and Medical Aid beneficiaries who nationwide, and they comprised nearly half of Korea's total population. Second, the analysis of stroke by socioeconomic status was completed by subdividing the groups by age, sex, and stroke subtype. Individuals 75 years old and over were included without restrictions on age, and the subtypes of ischemic stroke, hemorrhagic stroke, and subarachnoid hemorrhage were also examined. Considering that the percentage of female ischemic stroke patients 75 and over was 35.8% of all female stroke patients, the inclusion of individuals aged 75 and over is critical for future studies of stroke. Third, our study showed the disparities of stroke incidence by using a single index (SII and RII). Although many studies have used SII and RII, most of them have used the index of self-rated health status [24,25,26] or mortality [26,27,28,29]. Regarding the incidence, only one study has addressed cancer using the SII and RII [29]. Finally, this study increased the accuracy of stroke diagnosis with the National Health Insurance inpatient medical expense claims data. A study in Korea analyzed the diagnostic accuracy of medical insurance claims for the year 2000: the inpatient diagnosis accuracy for ischemic stroke of 83.4%, and the diagnosis accuracy for hemorrhagic stroke of 85.7% [30], which were used in this study, are considered comparable to those reported in foreign studies.
There are some weaknesses of this study. First, the employee insured were excluded from the sample. We cannot say that the risk of stroke according to socioeconomic status is identical between self-employed insured and employee insured. Therefore, the generalizability of our results to all stroke patients is limited, although the exclusion of the employee insured might not have much influence on the results, considering that most of the employee insured are under 65 years old, whereas stroke mainly occurs in those 65 years old and above. Second, the results of this study do not indicate the independent effects of income on stroke incidence, as other dimensions of socioeconomic status such as education and occupation were not considered. Third, we could not explain our specific finding that the intracerebral hemorrhage incidence of group 1, which had the highest income level, increased continuously with age, while the incidences of other income groups decreased in those aged 75 and above. Therefore, future research needs to explore the reason for this.
Studies on the relationship between socioeconomic status and stroke must include individuals who are 75 years old and older. Particularly for the study of ischemic stroke in females, the percentage of ischemic stroke occurring in individuals aged 75 and above is more than 30%; therefore, we believe that the exclusion of this age group can distort the findings on the relationship between socioeconomic status and stroke. Furthermore, analyzing stroke without distinguishing sex, age, or stroke subtype makes it difficult to design effective policy alternatives for the management of each stroke subtype. Therefore, the patterns of stroke risks according to socioeconomic status should be examined in detail. As male intracerebral hemorrhage was the subtype with the greatest relative risk by income level in this study, studies focusing on male intracerebral hemorrhage would be helpful to mitigate the relative inequalities of experiencing a stroke.
ACKNOWLEDGMENTS
This research was supported by the National Health Insurance Service and a Department of Health and Welfare. This work was funded by a Chungnam National University School of Medicine grant for improving basic medical science research.
Footnotes
The authors have no conflicts of interest with the material presented in this paper.
References
- 1.Truelsen T, Piechowski-Jozwiak B, Bonita R, Mathers C, Bogousslavsky J, Boysen G. Stroke incidence and prevalence in Europe: a review of available data. Eur J Neurol. 2006;13(6):581–598. doi: 10.1111/j.1468-1331.2006.01138.x. [DOI] [PubMed] [Google Scholar]
- 2.Song IH, Oh DH, Kang HS, Choue CW, Kim KS, Kim MS, et al. Changing pattern of stroke during the recent 10 years in Korea. Korean J Intern Med. 1992;43(5):637–644. (Korean) [Google Scholar]
- 3.Granger CV, Sherwood CC, Greer DS. Functional status measures in a comprehensive stroke care program. Arch Phys Med Rehabil. 1977;58(12):555–561. [PubMed] [Google Scholar]
- 4.Centers for Disease Control and Prevention (CDC) State-specific mortality from stroke and distribution of place of death-United States 1999. MMWR Morb Mortal Wkly Rep. 2002;51(20):429–433. [PubMed] [Google Scholar]
- 5.Van Rossum CT, van de Mheen H, Breteler MM, Grobbee DE, Mackenbach JP. Socioeconomic differences in stroke among Dutch elderly women: the Rotterdam study. Stroke. 1999;30(2):357–362. doi: 10.1161/01.str.30.2.357. [DOI] [PubMed] [Google Scholar]
- 6.Hart CL, Hole DJ, Smith GD. The contribution of risk factors to stroke differentials, by socioeconomic position in adulthood: the Renfrew/Paisley study. Am J Public Health. 2000;90(11):1788–1791. doi: 10.2105/ajph.90.11.1788. [DOI] [PMC free article] [PubMed] [Google Scholar]
- 7.Peltonen M, Rosen M, Lundberg V, Asplund K. Social patterning of myocardial infarction and stroke in Sweden: incidence and survival. Am J Epidemiol. 2000;151(3):283–292. doi: 10.1093/oxfordjournals.aje.a010204. [DOI] [PubMed] [Google Scholar]
- 8.Engstrom G, Jerntorp I, Pessah-Rasmussen H, Hedblad B, Berglund G, Janzon L. Geographic distribution of stroke incidence within an urban population: relations to socioeconomic circumstances and prevalence of cardiovascular risk factors. Stroke. 2001;32(5):1098–1103. doi: 10.1161/01.str.32.5.1098. [DOI] [PubMed] [Google Scholar]
- 9.Jakovljevic D, Sarti C, Sivenius J, Torppa J, Mahonen M, Immonen-Raiha P, et al. Socioeconomic status and ischemic stroke: the FINMONICA Stroke Register. Stroke. 2001;32(7):1492–1498. doi: 10.1161/01.str.32.7.1492. [DOI] [PubMed] [Google Scholar]
- 10.Jakovljevic D, Sarti C, Sivenius J, Torppa J, Mahonen M, Immonen-Raiha P, et al. The FINMONICA Stroke Register. Socioeconomic differences in the incidence, mortality and prognosis of intracerebral hemorrhage in Finnish adult population. Neuroepidemiology. 2001;20(2):85–90. doi: 10.1159/000054765. [DOI] [PubMed] [Google Scholar]
- 11.Jakovljevic D, Sivenius J, Sarti C, Torppa J, Mahonen M, Immonen-Raiha P, et al. Socioeconomic inequalities in the incidence, mortality and prognosis of subarachnoid hemorrhage: the FINMONICA Stroke Register. Cerebrovasc Dis. 2001;12(1):7–13. doi: 10.1159/000047674. [DOI] [PubMed] [Google Scholar]
- 12.Wolfe CD, Rudd AG, Howard R, Coshall C, Stewart J, Lawrence E, et al. Incidence and case fatality rates of stroke subtypes in a multiethnic population: the South London Stroke Register. J Neurol Neurosurg Psychiatry. 2002;72(2):211–216. doi: 10.1136/jnnp.72.2.211. [DOI] [PMC free article] [PubMed] [Google Scholar]
- 13.Gillum RF, Mussolino ME. Education, poverty, and stroke incidence in whites and blacks: the NHANES I epidemiologic follow-up study. J Clin Epidemiol. 2003;56(2):188–195. doi: 10.1016/s0895-4356(02)00535-8. [DOI] [PubMed] [Google Scholar]
- 14.Qureshi AI, Suri MF, Saad M, Hopkins LN. Educational attainment and risk of stroke and myocardial infarction. Med Sci Monit. 2003;9(11):CR466–CR473. [PubMed] [Google Scholar]
- 15.Avendano M, Kawachi I, Van Lenthe F, Boshuizen HC, Mackenbach JP, Van den Bos GA, et al. Socioeconomic status and stroke incidence in the US elderly: the role of risk factors in the EPESE study. Stroke. 2006;37(6):1368–1373. doi: 10.1161/01.STR.0000221702.75002.66. [DOI] [PubMed] [Google Scholar]
- 16.Lisabeth LD, DiezRoux AV, Escobar JD, Smith MA, Morgenstern LB. Neighborhood environment and risk of ischemic stroke: the brain attack surveillance in Corpus Christi (BASIC) project. Am J Epidemiol. 2007;165(3):279–287. doi: 10.1093/aje/kwk005. [DOI] [PubMed] [Google Scholar]
- 17.Kuper H, Adami HO, Theorell T, Weiderpass E. The socioeconomic gradient in the incidence of stroke: a prospective study in middle-aged women in Sweden. Stroke. 2007;38(1):27–33. doi: 10.1161/01.STR.0000251805.47370.91. [DOI] [PubMed] [Google Scholar]
- 18.Avendano M, Glymour MM. Stroke disparities in older Americans: is wealth a more powerful indicator of risk than income and education? Stroke. 2008;39(5):1533–1540. doi: 10.1161/STROKEAHA.107.490383. [DOI] [PMC free article] [PubMed] [Google Scholar]
- 19.Li C, Hedblad B, Rosvall M, Buchwald F, Khan FA, Engstrom G. Stroke incidence, recurrence, and case-fatality in relation to socioeconomic position: a population-based study of middle-aged Swedish men and women. Stroke. 2008;39(8):2191–2196. doi: 10.1161/STROKEAHA.107.507756. [DOI] [PubMed] [Google Scholar]
- 20.Cesaroni G, Agabiti N, Forastiere F, Perucci CA. Socioeconomic differences in stroke incidence and prognosis under a universal healthcare system. Stroke. 2009;40(8):2812–2819. doi: 10.1161/STROKEAHA.108.542944. [DOI] [PubMed] [Google Scholar]
- 21.Grimaud O, Dufouil C, Alperovitch A, Pico F, Ritchie K, Helmer C, et al. Incidence of ischaemic stroke according to income level among older people: the 3C study. Age Ageing. 2011;40(1):116–121. doi: 10.1093/ageing/afq142. [DOI] [PMC free article] [PubMed] [Google Scholar]
- 22.National Health Insurance Service. NHI Program: population coverage. [cited 2014 Feb 26]. Available from: http://www.nhis.or.kr/static/html/wbd/g/a/wbdga0403.html.
- 23.Mackenbach JP, Kunst AE. Measuring the magnitude of socioeconomic inequalities in health: an overview of available measures illustrated with two examples from Europe. Soc Sci Med. 1997;44(6):757–771. doi: 10.1016/s0277-9536(96)00073-1. [DOI] [PubMed] [Google Scholar]
- 24.Park BH, Jung M, Lee TJ. Associations of income and wealth with health status in the Korean elderly. J Prev Med Public Health. 2009;42(5):275–282. doi: 10.3961/jpmph.2009.42.5.275. [DOI] [PubMed] [Google Scholar]
- 25.Jung Y, Cho Y, Oh J. Differential effects of family income on self-rated health by age: analysis of Seoul citizens health indicators survey 2001, 2005. (Korean) J Prev Med Public Health. 2007;40(5):381–387. doi: 10.3961/jpmph.2007.40.5.381. [DOI] [PubMed] [Google Scholar]
- 26.Khang YH, Lynch JW, Yun S, Lee SI. Trends in socioeconomic health inequalities in Korea: use of mortality and morbidity measures. J Epidemiol Community Health. 2004;58(4):308–314. doi: 10.1136/jech.2003.012989. [DOI] [PMC free article] [PubMed] [Google Scholar]
- 27.Khang YH, Yun SC, Hwang IA, Lee MS, Lee SI, Jo MW, et al. Changes in mortality inequality in relation to the Korean economic crisis: use of area-based socioeconomic position. (Korean) J Prev Med Public Health. 2005;38(3):359–365. [PubMed] [Google Scholar]
- 28.Khang YH, Lynch JW, Kaplan GA. Health inequalities in Korea: age- and sex-specific educational differences in the 10 leading causes of death. Int J Epidemiol. 2004;33(2):299–308. doi: 10.1093/ije/dyg244. [DOI] [PubMed] [Google Scholar]
- 29.Kim CW, Lee SY, Moon OR. Inequalities in cancer incidence and mortality across income groups and policy implications in Korea. Public Health. 2008;122(3):229–236. doi: 10.1016/j.puhe.2007.07.003. [DOI] [PubMed] [Google Scholar]
- 30.Park JK, Kim KS, Kim CB, Lee TY, Lee KS, Lee DH, et al. The accuracy of ICD codes for cerebrovascular diseases in medical insurance claims. Korean J Prev Med. 2000;33(1):76–82. [Google Scholar]


