

Abstract
A basic EEG feature upon voluntary movements in healthy human subjects is a β (13–30 Hz) band desynchronization followed by a postmovement event-related synchronization (ERS) over contralateral sensorimotor cortex. The functional implications of these changes remain unclear. We hypothesized that, because β ERS follows movement, it may reflect the degree of error in that movement, and the salience of that error to the task at hand. As such, the signal might underpin trial-to-trial modifications of the internal model that informs future movements. To test this hypothesis, EEG was recorded in healthy subjects while they moved a joystick-controlled cursor to visual targets on a computer screen, with different rotational perturbations applied between the joystick and cursor. We observed consistently lower β ERS in trials with large error, even when other possible motor confounds, such as reaction time, movement duration, and path length, were controlled, regardless of whether the perturbation was random or constant. There was a negative trial-to-trial correlation between the size of the absolute initial angular error and the amplitude of the β ERS, and this negative correlation was enhanced when other contextual information about the behavioral salience of the angular error, namely, the bias and variance of errors in previous trials, was additionally considered. These same features also had an impact on the behavioral performance. The findings suggest that the β ERS reflects neural processes that evaluate motor error and do so in the context of the prior history of errors.
Keywords: error history, motor error, postmovement β event-related synchronization, event-related desynchronization
Introduction
An adaptive internal model that predicts the consequences of voluntary movement is thought to be a central feature in motor control, permitting compensation for instabilities due to feedback delays and uncertainty (Wolpert and Miall, 1996). Differences between the predicted consequences of the movement and the actual sensory feedback related to the action then drive revision of the internal model and improve behavioral performance through motor adaptation (Noto and Robinson, 2001; Tseng et al., 2007; Shadmehr et al., 2010). Visuomotor-rotation tasks are often used to investigate motor adaptation; in these, the relevant sensory feedback is assumed to be the angular error between the target and the response. However, it may not just be the error in the last response that determines recalibration of the internal model. Visuomotor learning has been proposed to involve Bayesian inference and integrate information from multiple sources with different time courses, such as diverse sensory inputs and top-down prediction (Korenberg and Ghahramani, 2002; Körding and Wolpert, 2004). A potentially important source of additional information in guiding recalibration of the top-down prediction might be the history of previous errors, as this will dictate how much store should be set by the current error (Baddeley et al., 2003; Semrau et al., 2012). To date, however, there has been relatively little evidence of trial-to-trial variations in neural activity that might instantiate this Bayesian model of how motor adaptation is achieved.
EEG has the temporal resolution to follow neural responses from trial to trial, and one fundamental feature of the human EEG that might plausibly relate to the evaluation of motor error and its consequences is the postmovement event-related synchronization (ERS) that occurs over sensorimotor cortex contralateral to movement (Alegre et al., 2008). Accordingly, here we investigate changes in oscillatory activities in the EEG associated with error monitoring and adaptation during a joystick task where two types of visual perturbations, random or constant, were introduced. The results show that the amplitude of the β ERS is attenuated after movement with large angular error, even when other possible motor confounds are controlled. The trial-to-trial correlation between postmovement ERS and preceding error is consistently negative and is enhanced when the error in the current trial is weighted by the bias and variance of the errors in previous trials. In short, we propose that the β ERS signals neural activity that implements Bayesian inference to update internal models during motor adaptation.
Materials and Methods
Subjects.
Twelve right-handed healthy subjects gave their written informed consent to participate in the experiment (7 men, mean age 24 years, age range 18–35 years). They all had normal or corrected-to-normal vision and no medical history that might interfere with the task. The study was approved by the local ethics committee of the University of Oxford.
Experimental setup.
Subjects were seated in front of a computer monitor and held a finger-joystick with their dominant right hand, which was rested on a padded arm support. The position of the joystick was displayed on the computer monitor as a cursor in the form of a red circle that was 6 mm (0.6 visual degrees) in diameter. The target was a green circle (6 mm diameter) displayed on the screen. Each trial started with the target (in green) and the cursor (in red) in the center of the monitor. Then the target moved from the screen center to another position randomly selected from eight positions equally spaced around an invisible circle with a radius of 7.5 cm (6.1 visual degrees; Fig. 1A). The green target remained at its new position for 750 ms before returning to the center position, where the target stayed stationary for a further 1.75–2.25 s (uniformly distributed) before the next trial began, making the total intertrial interval between 2.5 and 3 s. Subjects were instructed to move the joystick when the green target jumped so as to shift the red cursor from the central start position to match the position of the target in a rapid, discrete, and straight movement. The position of both red cursor and green target circles was continuously presented throughout the experiment. Perturbation was implemented by introducing an angular rotation between the red cursor and the actual movement of the joystick, so that the visual feedback of the joystick position was deviated from its actual position (Fig. 1B). Each subject completed three sessions of the task, with the sessions differing in terms of the type of perturbation rotation (Fig. 1C).
Figure 1.

Experimental setup and measurements. A, Experimental paradigm. B, Perturbation was implemented as a rotation between the actual joystick position (in black) and its visual feedback (in red). C, Sessions with different types of perturbation: zero (NoRot), randomly changing across trials (RdmRot), or constant across trials (CnstRot). D, Calculation of initial angular error. Green circle represents the position of the target. Red line indicates the joystick cursor trajectory. Red star represents the position of the cursor at the point of maximal velocity. E, Calculation of reaction time (RT) and movement duration (MT) where time 0 is the timing of target position jump. Blue line indicates the velocity trajectory in one trial. Filled circle, star, and open circle represent the timing of movement initiation, maximal velocity, and termination, respectively. F, The calculation of event-related power change: the ERS and ERD. Vertical lines indicate the timing of the target jump, response initiation, and movement termination, respectively. Horizontal blue double arrow indicates the minimal normalized EEG power (trough) between cue and movement termination. Horizontal red double arrow indicates the peak normalized EEG power after movement termination. ERD and ERS are the average within a 200 ms window around the trough and peak, respectively.
No rotation session (No ROT).
After familiarization with the apparatus, each subject performed a short session of 50 trials where there was no rotation between the actual movement of the joystick and its visual feedback, the red cursor.
Random rotation session (Rdm ROT).
After the no rotation session, each subject completed a session of 150 trials with a rotation between the red cursor and the joystick movement in 60% of randomly selected trials at the time of target jump (Rdm ROT session). Rotations were equally distributed between 40, 24, and 12 degrees and could be either in the clockwise or anticlockwise direction, so that each rotation angle was presented in 30 trials with 15 trials in either direction, and the average bias of the perturbation was zero.
Constant rotation session (Cnst ROT).
Each subject also completed a session of 150 trials, when the perturbation was set to a constant 40 degree clockwise rotation between the red cursor and the joystick movement across all trials.
Data recording.
The task was presented using open-source software (PsychoPy version 1.74). The timing of jump for the green target and the positions of the cursor and target were sampled through PsychoPy at 100 Hz and sent to a digital to analog converter (U3, LabJack) to synchronize the cursor and target position with the simultaneous EEG recordings.
Scalp EEG was recorded from 12 channels over F3, Fz, F4, FC3, FCz, FC4, C3, Cz, C4, CP3, CPz, and CP4 according to the international 10–20 EEG system (see Fig. 3A). EEG was amplified, filtered between DC and 370 Hz, and sampled at the rate of 2048 Hz using a Porti 32 channel system (TMSi). EEG was referenced to the average signal across all electrodes. The position of the joystick and the timing of the target jump were also recorded through the Porti amplifier.
Figure 3.

EEG data. A, Recorded EEG electrode placements in dark gray from the international 10–20 system. B, Group average normalized power spectra during trials with no rotational perturbation. Perimovement ERD and postmovement ERS were observed across different channels, but more prominently in C3 and CP3 contralateral to movement. C, Example power spectra from an individual subject showing clear separation between α and β reactivity in C3. D, Examples of trial-by-trial variation in C3 EEG from one typical subject in constant perturbation session showed α and β ERS increased with increasing trial execution order. However, this was confounded by reducing error across execution order. Vertical lines indicate the timing of cue (target jump), average response initiation, and movement termination.
Behavioral analysis.
Analyses of both behavioral and EEG data were performed in MATLAB (version 2012b, MathWorks). The position of the cursor was differentiated to calculate velocity, which was subsequently low-pass filtered through a Gaussian kernel with a window duration of 50 ms. The angular error was computed as the angle between the line connecting the start position and the cursor at the time of maximum velocity and the line connecting the start position and the target (Fig. 1D). Movement initiation was defined as the time when the joystick velocity crossed the threshold of three times the SD of the signal (and its noise) at “rest,” and sustained this speed for at least 100 ms. Movement termination was the last time the hand velocity fell below the threshold for that trial (Fig. 1E). Thus, our measure of movement duration included all corrective movements, but our measurement of error was focused on the initial angular error of the cursor relative to the target before any corrective movements. Path length was the total distance the cursor traveled between movement initiation and termination, normalized against the optimal path length (the length of a direct line between the initial position and the target position). Reaction time (interval between target jump and movement initiation), movement duration (interval between movement initiation and movement termination), path length, and initial angular error were calculated for each individual trial and then averaged within subjects for each experimental condition.
Models of trial-by-trial visuomotor adaptation.
A state-space model of trial-by-trial adaptation has been used in several studies to model the process of visuomotor adaptation (Thoroughman and Shadmehr, 2000; Donchin et al., 2003) as follows:
where x̂(k) is the current internal estimate of the rotation, e(k) is the prediction error, and K is the adaptation rate that is normally mathematically determined by optimization. Further modifications of the above formulation include introducing a “saving” term (Fine and Thoroughman, 2007):
Visuomotor adaptation has also been suggested to involve Bayesian inference (Korenberg and Ghahramani, 2002; Körding and Wolpert, 2004). Thus, the posterior distribution of visuomotor mapping takes into account both the prior knowledge of the perturbation and new evidence, or updated visual feedback. Assuming that the uncertainties associated with prior knowledge and evidence are Gaussian, the optimal least-squares and maximum-likelihood solution under iterative updating is the Kalman filter, where update of the new estimate (x̂(k + 1)) is driven by the mismatch between the sensory feedback and predicted state (xsense(k + 1) − x̂(k)). Weighting is determined by the variance associated with the latest feedback (σsense2(k)) and the previous estimate (σestimate2(k)) as follows:
 |
Assuming that the internal estimate of the rotation is transformed into the control command for perfect compensation, the mismatch between the target and the actual movement (observed movement error e(k)) is the prediction error corrupted by movement noise and feedback noise. Thus, according to the Bayesian update provided by Kalman filtering, the optimal adaptation rate is the relative confidence of the latest measurements and the previous estimate. High confidence in the previous estimate and large uncertainty associated with feedback leads to a slower update of the internal model; low confidence in the previous estimate and small uncertainty associated with feedback lead to greater weighting of feedback and a faster update of the internal model. Humans have been shown to take the statistics of sensory noise into account when planning motor acts (Baddeley et al., 2003; Yamamoto and Ando, 2012). Uncertainties associated with movement execution and visuomotor mapping have also been shown to affect how much the error in a preceding trial alters the performance in the next trial (Burge et al., 2008; Saijo and Gomi, 2012).
In the classical Kalman filter, σsense2 and σestimate2 are known a priori, and σsense2 is usually assumed to be constant. However, when subjects began each test session, they did not have a priori knowledge about the statistical properties of the perturbation. We therefore assume that subjects estimate the current noise condition based on the previous error history from similar tasks and adjust the weight given to current error feedback based on this estimation of noise. The changing learning rate (and other phenomena, such as savings, spontaneous recovery, and interference) in motor adaptation has been accounted for in previous studies by a simple two-state model (Smith et al., 2006), which simulated the process of adaptation as the sum of two adaptive processes with different adaptation rates, with the ratio of the two processes changing with time.
Here we argue that the adaptation rate is changing dynamically with the estimate of the uncertainties associated with the feedback and the forward model as predicted by the Bayesian rule, and that the variance (σ2) and the squared bias (μ̄2) of the error history are inversely related to the confidence in the feedback and the previous estimate from the forward model, respectively. Thus, the ratio between the squared bias to the variance in the previous error history indicates the confidence in the new measurements relative to the previous estimate. A large bias in the previous error history indicates consistency of the error and strongly biased perturbation, and therefore will lead to increased sensitivity to errors and a faster adaptation rate (Fine and Thoroughman, 2007). A large variation in the feedback history, on the other hand, will reduce the confidence in new feedback and should reduce the adaptation rate (Fine and Thoroughman, 2007). Therefore, we assume that the adaptation rate is as follows:
 |
where the variance (σ2) and the squared bias (μ̄2) are updated over each trial based on previous error history. The number of previous trials taken into account and the constant c are to be determined mathematically by optimization.
The model proposed here (Eq. 4) was compared with other models used in previous literature, the model with extra saving factor, and models in which errors were weighted by bias or variance only to determine whether both terms were required. To do so, the optimal least-squares estimates of the free variables in each model were determined using the nonlinear optimization function in MATLAB (fmincon), and the models were compared based on the Akaike information criterion (AIC). First, the sum of the squared error (SSE) was calculated for each model. The AIC of each model was then calculated as follows: AIC = n * Ln(SSE/n) + 2 * (k + 1), where n = sample size, k = number of parameters, and SSE = sum of squared error. To compare different models, we computed, for each model, the differences in AIC with respect to the AIC of the best candidate model as follows: Δi(AIC) = AICi − min (AIC). The Akaike weight for a model wi(AIC) = was then calculated and used to evaluate the probability that the ith model was the best model in the AIC sense given the data and the set of candidate models (Burnham and Anderson, 2002). The relative likelihood of two different models of interest was also evaluated using the relative Akaike weight . This procedure was applied to data from each subject separately. The Akaike weights (mean ± SEM across subjects) of all the models to be compared and the average relative Akaike weight (mean ± SEM across subjects) between models of interest are presented in Table 1.
Table 1.
Results of AIC analysis for competing models
| Model | No. of estimated parameters | AICi | Δi(AIC) | wi(AIC) | |
|---|---|---|---|---|---|
| 1 | 1 | 727.23 ± 9.02 | 9.54 ± 3.29 | 0.054 ± 0.026 | 0.0056 ± 0.0022 |
| 2 | 2 | 715.00 ± 8.32 | 0.98 ± 0.65 | 0.377 ± 0.070 | — |
| 3 | 4 | 716.08 ± 9.15 | 3.94 ± 0.67 | 0.153 ± 0.063 | 0.763 ± 0.421 |
| 4 | 2 | 715.57 ± 8.75 | 2.59 ± 0.72 | 0.177 ± 0.035 | 0.903 ± 0.341 |
| 5 | 3 | 715.24 ± 8.96 | 2.95 ± 0.99 | 0.161 ± 0.017 | 0.676 ± 0.294 |
| 6 | 2 | 749.21 ± 10.24 | 29.57 ± 7.19 | 0.059 ± 0.044 | 0.0004 ± 0.0004 |
| 7 | 2 | 729.22 ± 9.02 | 11.52 ± 3.29 | 0.020 ± 0.009 | 0.0021 ± 0.0008 |
The AIC analysis identified the single-state model with a saving factor and an adaptation rate (model 2) to have the highest probability of being the best model, and this was closely followed by the model with weighted errors (model 4) and then the two-state model (model 3). Compared with model 2, the model with weighted errors (model 4) was 0.903 ± 0.341 times as probable to minimize the information loss, indicating no significant difference between these models in terms of AIC, and both models were significantly better than the single-state space model without the saving factor (model 1). However, including the extra parameter of saving factor in the model with weighted error (model 5) did not further improve the model. Besides, weighting the errors by variance or bias only (model 6 and 7) led to a significant possibility of loss of information, suggesting that the weighting of the error required both the bias and variance term to avoid information loss.
The model performance was also assessed by the variance accounted for (VAF), i.e., the ratio between the root-mean-square of the residual error and the variance of the data:
EEG analysis.
Raw EEG data were first offline bandpass filtered between 0.1–100 Hz, with a 50 Hz notch filter, and down sampled to 200 Hz. The response-locked EEG time series from each single trial were decomposed into their time-frequency representations at 1 Hz intervals in the 2–90 Hz range, through a continuous wavelet transformation using the Morlet wavelet as the mother wavelet. An estimate of frequency-band-specific power at each time point was defined as the squared magnitude of the resulting complex signal after convolving the raw time series with the mother wavelet.
As the time course of the power vector was observed to be log-normal distributed, the raw power data were log transformed before normalization. Event-related EEG power change was subsequently calculated as the percentage change relative to the overall average by normalizing the power at each frequency and each time point relative to the average power of that frequency across the whole experimental session, and then subtracting 100 from the normalized value, so that a value higher than zero indicated power higher than the overall average power of that frequency and vice versa. To control for any slow drift in power with time within each experimental session, a simple linear regression of normalized power with time was calculated for each frequency and subtracted from the normalized power. Event-related power changes were investigated within four frequency bands (θ, 4–8 Hz; α, 9–12 Hz; β, 13–30 Hz; and γ, 31–85 Hz). Perimovement event-related desynchronization (ERD) (Yuan et al., 2010) was defined as the average normalized power over a 200 ms window centered around the trough of the power change between cue onset and movement termination. Postmovement ERS was defined as the average normalized power over a 200 ms window centered on the peak of the power change after movement termination (Fig. 1F). Both ERD and ERS were calculated for each individual trial for the frequency bands of interest before averaging for further analysis. All time frequency computations were performed with custom-written MATLAB routines. Two-way repeated-measures ANOVAs with factors frontal–parietal location (4 levels: F, FC, C, and CP) and medial–lateral location (3 levels: z, 3 and 4) were applied to the average postmovement ERS in each frequency band when there was no rotational perturbation. Those channels showing significantly higher ERS in a given frequency band were used to investigate the activities over that band.
Statistical analyses.
For the two experimental sessions with rotational perturbations, all the trials were sorted by either execution order in time or by the size of the absolute initial angular error in descending order. Then execution order and angular error trial sequences were each grouped into 5 bins of 30 trials each. All behavioral kinematics and EEG measurements were calculated for each individual trial and then averaged within bins before averaging across subjects.
To determine the effect of angular errors independent of movement execution (including movement duration and path length), trials with different angular errors but similar movement durations and path lengths were selected for comparison. Within each experimental session, bins of trials with large errors and small errors were created by grouping the 30% of the trials with the largest and smallest absolute initial angular errors, respectively. Then, trials with movement durations longer than the median movement duration of the whole session were excluded from both bins to control for differences in movement duration and path length. This gave rise to 26 ± 4 trials per subject with large error and 31 ± 2 trials per subject with small error but matched movement duration and path length when the perturbation was constant; and 25 ± 2 and 27 ± 3 trials per subject with large and small errors, respectively, in the random perturbation session. EEG power changes over these trials were first averaged within subjects and compared between conditions.
The effects of execution order, error size, and perturbation type (random or constant) on a set of behavioral and EEG measurements were assessed through multivariate mixed effects linear modeling using the “nlme” package in R (version 3.1–113) (Pinheiro et al., 2013). In the modeling, the perturbation type and the execution order were treated as categorical independent variables, and the error size was treated as a continuous independent variable. The normality assumption of the modeling was assessed by visually inspecting the distribution of the continuous independent variable, and by inspecting the Q-Q plot of the residuals of the modeling. This led us to take the square root of the absolute error, and the transformation made the error size and the model residuals normally distributed. The modeling started with including all independent variables of interest and their two-way interactions as predictive terms. Then the model was gradually simplified by removing terms with an insignificant effect. To double check the validity of removing or adding each predictive term, the fits of the simpler and more complex models were compared, only the terms that made a significant difference to the fitting of the model were retained. For variables with a significant effect, the estimated regression coefficient (mean ± SEM) and the p value are reported. Additional one-way repeated ANOVAs and two-tailed t tests were used to examine the size of effects, with multiple comparisons corrected for using Bonferroni correction in post hoc analysis. Partial correlation was also used to investigate the relationship between initial angular error and postmovement activities of separate frequency bands while controlling the effect of any ERS in other frequency bands, and other behavioral covariates. Data are mean ± SEM, unless otherwise specified.
Results
Behavioral results
Subjects made progressively less initial angular error as trial number increased when the rotational perturbation was constant, but not when the rotational perturbation was random (Fig. 2A). The mixed effect linear modeling of initial angular error with factors of execution order (five bins of 30 trials each in order of execution) and perturbation type (random or constant) confirmed an effect of execution order (β = −1.977 ± 0.351, p < 0.0001) and an interaction between execution order and perturbation type (β = −4.839 ± 0.494, p < 0.0001). When the perturbation was 40°, the absolute angular error reduced from 28.7° ± 4.1° in the first 30 trials to 9.1° ± 2.2° in the last 30 trials (t(11) = 12.635, p < 0.001), confirming successful adaptation.
Figure 2.

Behavioral results. A, Average absolute angular error sorted into bins according to ascending (left to right) execution order. Angular error reduced with time when the perturbation was constant, but not when the perturbation was random. B, Movement duration sorted into bins according to decreasing error size (left to right). Movement duration (MT) reduced with diminishing error. C, Path length sorted into bins according to decreasing error size (left to right). This suggests that there were more corrective movements when there was large initial error. Circles and bars represent mean ± SEM. NoROT, No rotational perturbation; Rdm ROT, random rotational perturbation; Cnst ROT, constant rotational perturbation.
Reaction time was stable across the entire experiment, as confirmed by a lack of main effect of execution order (p = 0.792) or perturbation type (p = 0.179). Reaction time did not change with initial angular error (p = 0.405) either.
Movement duration and path length were so defined that they included corrective movements, and thus they were greater when movement initial angular error was high, independent of the type of perturbation (Fig. 2B,C). This was confirmed by an effect of error size on movement duration (β = 0.0397 ± 0.0116, p = 0.001) and path length (β = 0.0295 ± 0.0077, p = 0.0002), and a lack of main effect of perturbation type (p = 0.1316 for movement duration and p = 0.7152 for path length, respectively) or of interaction between perturbation type and error size (p = 0.2672 for movement duration and p = 0.1801 for path length, respectively).
Postmovement synchronization in α and β bands is maximal over sensorimotor cortex contralateral to the moving hand
Power spectra (Fig. 3B) averaged across trials without rotational perturbation showed event-related activity in four frequency bands. There was increased activity in θ band (4–8 Hz) starting before movement termination, more prominent in channels located over frontal cortex. An ERD between 9 Hz and 30 Hz (involving both the α and β bands) was observed after the target jump and during movement across all channels. The ERD was followed by a clear rebound or ERS after movement termination. The ERS was maximal over C3, where it peaked at 622 ± 42 ms and 547 ± 44 ms after movement termination in the α and β bands, respectively. Inspection of power spectra from individual subjects identified a clear separation between the α (9–12 Hz) and β (13–30 Hz) ERS in 10 out of the 12 subjects (Fig. 3C), although the two effects became more confluent after averaging across subjects (Fig. 3B).
The postmovement ERS peak was calculated for each individual trial, individual channel, and frequency band, before averaging across trials in each subject. Two-way repeated-measures ANOVAs with factors frontal–parietal location (4 levels: F, FC, C, and CP; see notation in Fig. 3A) and medial–lateral location (3 levels: z, 3, and 4) were followed by post hoc paired t tests. These identified channels located over the frontal cortex (F3, Fz, and F4) as having the highest ERS in the θ band, and channels located over sensorimotor cortical areas contralateral to the performing hand (C3 and CP3) as having the highest α and β ERS. There was no effect of location on the γ ERS. Thus, in subsequent analyses, θ (4–8 Hz) activity was averaged over F3, Fz, and F4, and α (9–12 Hz), β (13–30 Hz), and γ (31–85 Hz) activities averaged over C3 and CP3.
Postmovement β ERS is modulated by initial angular error independent from movement duration and path length, or the type of perturbation
The postmovement ERS in both the α and β bands were observable in individual trials as shown in data from typical subjects, and both α and β postmovement ERS increased with increasing execution order and diminishing error size when perturbations were constant (Fig. 3D).
To investigate the effect of initial angular errors on the postmovement ERS independent of movement execution (including movement duration and path length), trials with different initial errors but similar movement durations and path lengths were selected for comparison. This gave rise to 26 ± 4 trials per subject for large error trials (average angular error = 32.1° ± 2.4° across subjects) and 31 ± 2 trials per subject for small error trials (average angular error = 3.67° ± 0.61° across subjects) with matched average reaction time (t(11) = 0.862, p = 0.407), movement duration (t(11) = 0.093, p = 0.928), and path length (t(11) = 1.778, p = 0.103) when the rotational perturbation was constant. Figure 4A confirms similar desynchronization around movement but suppressed postmovement rebound in both α and β frequency bands in trials with large initial angular errors compared with matched trials with small angular errors. When the rotational perturbation was random, the postmovement ERS in the β band was also significantly suppressed by large errors, but not that in the α band (Fig. 4B).
Figure 4.

Contrast in EEG reactivity in trials with small and large error. A, Constant perturbation. Group mean postmovement synchronization in α and β bands was suppressed in trials with large initial errors. B, Random perturbation. Only group mean postmovement synchronization in the β band was significantly suppressed by error. Reaction time, movement duration, and path length were controlled for between large and small error trials. Thick lines indicate mean normalized power. Surrounding thin dashed lines indicate SE. Vertical lines indicate the average timing of cue onset, movement onset, and movement termination, respectively. Purple dots represent significant differences between large and small error trials.
In addition, the independent effect of movement complexity on postmovement ERS was investigated by comparing trials with longer movement duration and path length against trials with shorter movement duration and path length, but with matched angular error. In the session with constant perturbation, for the trials that are different in terms of movement duration and complexity (average movement duration = 553 ± 41 ms vs 428 ± 27 ms, t(11) = 2.631, p = 0.023; average path length = 1.323 ± 0.018 vs 1.130 ± 0.010, t(11) = 6.735, p < 0.001), but similar in terms of angular errors (33.85 ° ± 1.85 ° vs 32.19 ° ± 2.20 °, p = 0.174), there was no significant difference in the β band ERS (Fig. 5A). Likewise, in the session with random perturbations, for trials that were different in terms of movement duration (627 ± 79 ms vs 537 ± 69 ms; t(11) = 3.231, p = 0.008) and path length (1.325 ± 0.041 vs 1.126 ± 0.024; t(11) = 5.004, p < 0.001), but similar in terms of angular errors (28.55 ° ± 1.53 ° vs 30.06 ° ± 1.48 °, p = 0.102), there was no significant difference in the β band ERS (Fig. 5B).
Figure 5.

Lack of contrast in EEG reactivity in trials with short and long movement duration. A, Constant perturbation. For trials with matched initial angular errors, the postmovement activities were not modulated by movement duration or total path length. Thick lines indicate mean normalized power. Surrounding thin dashed lines indicate SE. Vertical lines indicate the timing of cue onset, average movement onset, and movement termination for short movement and long movement, respectively. Differences were not significant. B, Same for random perturbation.
We also observed increased θ power after movement, with the θ increase being most prominent over the frontal cortex (F3, Fz, and F4, shown in Fig. 3B). However, we did not observe any consistent effect of either error or execution order on the amplitude of the θ increase (Figs. 4 and 5). Besides, considering the frontal bias of eye movement-related scalp EEG artifacts and the fact that eye movement artifacts manifest as task-related increases in low-frequency power, we elected not to comment further about the nature of the θ activity but focused on the activities in the α and β frequency bands.
When all the trials were grouped into bins according to execution order (all the 150 trials in one session for each subject were grouped into 5 bins with 30 trials in each bin), the mixed effect linear modeling identified a significant effect of execution order bin (β = 11.980 ± 1.806, p < 0.0001) in predicting the amplitude of the α ERS. There was no significant effect of perturbation type (p = 0.9485) or interaction between perturbation type and execution order (p = 0.5878). Error size did not have additional prediction power (β = −5.453 ± 3.935, p = 0.1494) when the effect of execution order was taken into account. This therefore suggested a sequence effect on the α ERS, independent of the type of perturbation (Fig. 6A). A paired t test confirmed that the α ERS increased from 42.4 ± 9.1% in the first bin of 30 trials to 80.7 ± 7.5% in the last bin of 30 trials (t(11) = −2.762, p = 0.018).
Figure 6.
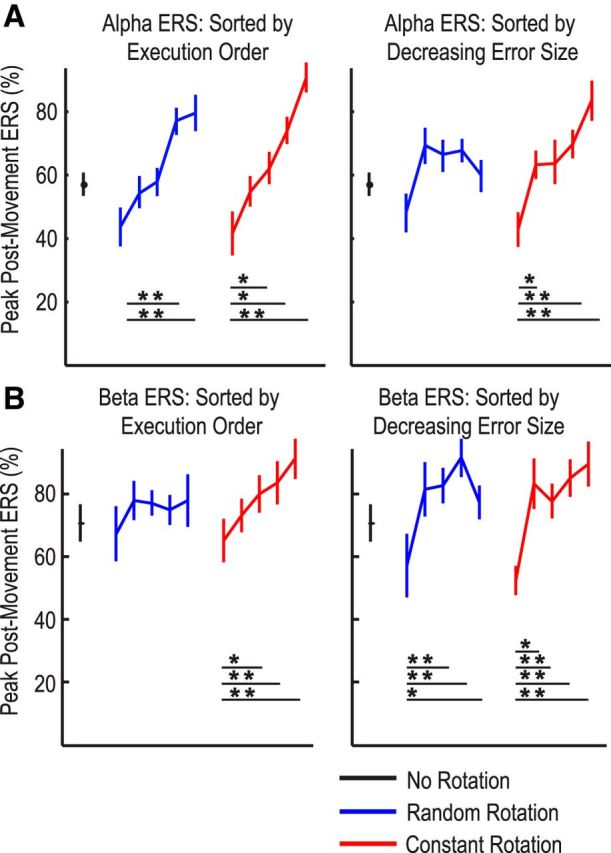
Postmovement ERS and variation with behavior. A, Group mean α ERS consistently increased over bins of increasing execution order, independent of perturbation type; group mean α ERS was suppressed by large errors, but only when the perturbation was constant. B, Group mean β ERS increased with execution order only when the perturbation was constant, and it was suppressed by large errors independent of perturbation type. *Significant difference (p < 0.05, Bonferroni correction for multiple comparisons). **Significant difference (p < 0.01, Bonferroni correction for multiple comparisons). Circles and bars represent mean ± SEM.
There were contrasting effects for the postmovement β ERS. When all trials were grouped into bins according to execution order (Fig. 6B), the mixed effect linear modeling identified execution order (β = 4.935 ± 2.319, p = 0.0401) and error size (β = −4.830 ± 1.081, p < 0.0001) as significant predictors of β ERS amplitude, and disclosed an interaction between execution order and perturbation type (β = 2.570 ± 1.316, p = 0.0453). A one-way repeated-measures ANOVA demonstrated that execution order had an effect on the β ERS only when the perturbation was constant (F(4,44) = 8.244, p < 0.001), and not when the perturbation was random (F(4,44) = 1.507, p = 0.217). In contrast, the effect of error size was independent of the perturbation type: a paired t test confirmed that the average β ERS in the bin with largest initial angular errors was lower than in the bin with the smallest initial error (59.5 ± 5.6% compared with 89.1 ± 7.1%, t(11) = −3.162, p = 0.009). A further paired t test showed no significant difference in the β ERS change between the bin with largest error and the bin with smallest error between the two perturbation types (22.91 ± 5.47% for random perturbation and 34.33 ± 7.70% for constant perturbation, t(11) = −1.439, p = 0.089).
β ERS is not only modulated by error but also the salience of error
When the perturbation was changing randomly across trials, the trial-to-trial correlation (n = 150) between preceding angular error and postmovement β ERS was −0.167 ± 0.030, which was weak but consistently negative across subjects (t(11) = −5.260, p < 0.001, one sample t test). The partial correlation controlling for the effects of postmovement activities in the remaining three frequency bands was little different (r = −0.160 ± 0.035 across subjects; t(11) = 0.492, p = 0.633), suggesting that the relationship with the β ERS was frequency selective. The partial correlation controlling for both the effects of movement duration and path length (r = −0.157 ± 0.032 across subjects with one sample t test: t(11) = −3.30, p = 0.007) was similar to the bivariate correlation coefficient between error and β ERS (paired sample t test: t(11) = 1.664, p = 0.124), suggesting that the relationship with the β ERS was independent from movement duration and path length. Conversely, there was no significant correlation between β ERS and movement duration or path length, when the effect of error size was partialized: r = −0.055 ± 0.030 with one sample t test: t(11) = −1.81, p = 0.097 between movement duration and β ERS; and r = −0.054 ± 0.028 with one sample t test: t(11) = −1.932, p = 0.080 between path length and β ERS.
With constant perturbation, the trial-to-trial negative correlation between preceding angular error and the β ERS was stronger compared with when the perturbation was random (r = −0.247 ± 0.032 across subjects, with one sample t test: t(11) = 4.039, p = 0.002), and this was similar to the partial correlation coefficients (r = −0.236 ± 0.041 across subjects; paired sample t test: t(11) = −0.436, p = 0.672) when the effects of postmovement activities in the other three frequency bands were controlled, suggesting a frequency selective effect of the β ERS. The partial correlation controlling for the effects of movement duration and path length was also similar (r = −0.213 ± 0.043 across subjects; paired sample t test: t(11) = 1.181, p = 0.262 compared with bivariate correlation coefficients), suggesting that this relationship between error size and the β ERS was independent from movement duration and path length. Conversely, there was no significant correlation between β ERS and movement duration or path length, when the effect of error size was partialized: r = −0.065 ± 0.046 with one sample t test: t(11) = −1.50, p = 0.162 between movement duration and β ERS; and r = −0.058 ± 0.045 with one sample t test: t(11) = −1.80, p = 0.099 between path length and β ERS.
But did the angular error on the last trial sufficiently describe the β ERS? Or was the impact of error upon the β ERS influenced by the statistics of angular error in other preceding trials? Previous results showed that the β ERS also changed with time. When the perturbation was randomly presented, the attenuation of postmovement ERS in trials with large perturbation recovered with subsequent presentation (Fig. 7A). Two-way ANOVA with factors of perturbation angle (0° or 40°) and presentation order (5 bins) identified a significant effect of perturbation angle (F(1,11) = 7.495, p = 0.019) and interaction between presentation order and perturbation angle (F(4,44) = 5.884, p = 0.001). Post hoc analysis showed a significant effect of perturbation order on postmovement β ERS when the perturbation was 40° (F(4,44) = 5.672, p = 0.001), with significantly lower β ERS in the first presentation than in the last presentation bin (t(11) = −2.995, p = 0.012). This was despite an absence of any error difference in the response to 40° perturbations between these bins (t(11) = 0.582, p = 0.572). These results suggest that β ERS is not only modulated by error but also the salience of the error, which changes with presentation order as the randomness of perturbations becomes apparent.
Figure 7.

Dependence of both behavior and β ERS on error in last trial and trial history. A, In random perturbation sessions, attenuation of β ERS after trials with large perturbation recovered with repetitive presentation, despite the absence of any difference in the error in the response between successive bins. B, Correlation between β ERS and error weighted by the squared bias and variance of previous trials in constant perturbation sessions. C, VAF of a model describing performance on the next trial through error on the last trial weighted by the squared bias and variance of previous error history in constant perturbation sessions. Both correlations and VAF were more enhanced when the previous 20 trials were taken into account than when only unweighted error was considered. Circles and bars represent mean ± SEM. *Significant difference with Bonferroni correction for multiple comparisons.
When the perturbation was constant, the ratio of the squared bias to the variance of errors indicates the salience of the error used for updating the internal model in the visuomotor adaptation (for details, see Materials and Methods). We plotted the partial correlation between the β ERS and the error in the preceding trial weighted by the ratio of the squared bias to the variance of errors over different numbers of preceding trials. One-way ANOVA confirmed a significant effect of the previous error window length on the correlation coefficients (F(2.259,27.112) = 14.129, p < 0.001). The optimal history of trials was graphically determined to involve the last 20 trials when the perturbation was constant (Fig. 7B). Partial correlations between the β ERS and the error in the preceding trial weighted by the ratio of the squared bias to the variance of errors in the previous 20 trials during constant perturbations were −0.296 ± 0.0368, when the effects of postmovement activities in all other three frequency bands were controlled. This trial-to-trial correlation was again consistently negative across subjects (t(11) = −7.696, p < 0.001, one sample t test), and was significantly more negative than the partial correlation between the β ERS and the unweighted error in the preceding trial (t(11) = 3.951, p = 0.002). Thus, the error in the last trial weighted by the ratio of the squared bias to the variance of errors predicted 10.4 ± 2.3% of the variance in the following β ERS compared with only 6.6 ± 2.1% (t(11) = 4.127, p = 0.002) of the variance when only the unweighted error was considered.
Next, we tested whether behavior on the next trial was similarly influenced by a weighted function of angular error on the last trial. Through the AIC analysis, we showed that the state-space model (Eq. 4) with error weighted by the ratio of the squared bias to the variance of previous error history could better describe trial-to-trial variation in the internal estimation of the rotation than error alone, when the perturbation was constant. Therefore, learning was better modeled as dynamic, changing according to the updated estimation of uncertainties associated with the visual feedback. One-way ANOVA confirmed a significant effect of the previous error window length on the model fitting (F(1.439,15.825) = 8.680, p < 0.005). The optimal history of trials was graphically determined, and model fits were best when the statistical properties of the last 20 trials were considered, deteriorating again when the window was increased still further (Fig. 7C). With this optimal history, the variance of the error history accounted for by the model (VAF = 36.0 ± 2.7%) was significantly larger than the model when unweighted errors were considered (32.7 ± 2.9%; t(11) = −4.444, p = 0.001).
With both the β ERS and behavior being similarly better predicted by a weighted function of angular error on the last trial that took into account the statistical features of the last 20 trials, the question arises whether the β ERS could help mediate the influence of angular error and its history on behavior in the next trial. When the angular error was weighted by the ratio of the squared bias to the variance of the error in the previous 20 trials, the correlation between the weighted error and the trial to trial variation in the internal estimation of the rotation modeled using Equation 4 (see Materials and Methods) was 0.724 ± 0.024. However, this correlation coefficient was significantly reduced (r = 0.585 ± 0.029, t(11) = 3.865, p = 0.003) when the β ERS was used as a predictor and a partial correlation estimated. The proportion of the variance in the internal model explained by error and its history was reduced by 33.7 ± 5.5% (from 52.8 ± 3.4% to 35.0 ± 3.4%, t(11) = −4.089, p = 0.002), consistent with the hypothesis that the β ERS mediated part of the correlation between the weighted error and the change in the internal model on the next trial.
Discussion
Behavioral studies suggest that, during trial-to-trial motor adaptation in tasks involving brisk or ballistic movements, changes in the internal forward model are determined not only by prediction error but also by the relevance and uncertainty associated with the visual feedback (Körding and Wolpert, 2004; Fine and Thoroughman, 2007; Wei and Körding, 2009). Consistently large prediction errors in the setting of relatively small trial-to-trial variance supposedly lead to more rapid updating of the internal model (Semrau et al., 2012; Patton et al., 2013). Relatively lacking, however, is evidence of trial-to-trial variations in neural activity that might instantiate this Bayesian model of how motor adaptation is achieved. Here we show that the sensorimotor β ERS that follows brisk goal-directed movements is dynamic and negatively correlates with preceding error and correlates even better when such error is weighted by the statistical properties of the past error history, specifically by the ratio of squared bias to the variance of previous error history within a certain window. The implication is that the postmovement β ERS may reflect neural processes that effect a Bayesian computation during motor adaptation, weighting the prediction error by the statistical properties of the past error history. Crucially, this weighting of error also explained more variance in the change in behavioral performance over time than error alone. It is therefore our thesis that the postmovement β ERS is the product of neural processes that help fashion behavioral performance according to Bayesian inferences.
The correlation between trial error weighted by the statistical properties of its history and the postmovement β ERS was relatively weak, albeit consistent and significant. It should also be acknowledged that there is a covariation of duration and of path length with error size in the movements. However, the variation of the movement duration and path length was small relative to the difference in the error size we observed, and the relationship between the β ERS and error size was maintained when the effects of these covariates were controlled in the analyses. Yet the EEG is a complex signal, which can be affected by multiple cortical processes and confounded by scalp electromyographic activity. As such, the correlations demonstrated here may place only a lower limit on the relevance of the β ERS to motor adaptation. Importantly, too, the correlations reported here were frequency specific and held true when the effects of postmovement activities in the θ, α, and γ bands were controlled. Indeed, the other prominent postmovement reactivity, the α ERS, correlated with time on task rather than error. These two factors were disambiguated in the session with random rotational perturbation, when the α ERS, and not the β ERS, still correlated with trial sequence. The dependence of the α ERS on time on task, and the observation that α power is higher even before target jump comparing large error trials and small error trials in constant perturbation session (Figs. 3C and 4A), renders α an unlikely candidate for postmovement error analysis but raises the possibility that the variation in α reactivity might be the result of a systematic variation in attention or arousal as task duration increased (Macdonald et al., 2011). Crucially, the modulation of both the α and β band ERS by time and error was independent from other parameters related to movement execution, such as reaction time, movement duration, or path length. This observation is particularly important in the case of the β band, as several reports suggest that the perimovement β ERD may be influenced by the precise pattern that movement takes (Spinks et al., 2008; Yuan et al., 2010; Tan et al., 2013). This in turn opens up the theoretical possibility that some of the subsequent β ERS may be a passive rebound that is secondarily affected by these movement parameters. Our data suggest that, regardless of such a putative contribution to the β ERS, there is a component of the β ERS that relates to trial error.
Early theories of the functional role of the β ERS proposed that it was related to the return to an idling state of the motor cortex (Salmelin et al., 1995; Pfurtscheller et al., 1996). These views were supported by the finding of reduced motor cortical excitability during the β ERS (Chen et al., 1998, 1999). An alternative hypothesis, however, has related the β rebound to the sensory afferance due to movement, given that a similar phenomenon follows passive movements (Cassim et al., 2001; Alegre et al., 2002). More recently, it was reported that the cortical β ERS was severely attenuated when the preceding movement was prematurely terminated (Alegre et al., 2008). This observation prompted the speculation that the postmovement β ERS was somehow involved in the comparison between the predicted outcome of the intended movement and the results of the actually executed movement. Our data demonstrate that the postmovement β ERS is suppressed in trials with large initial angular error. However, the relationship is more complicated than this, as the strongest correlations between behavioral performance or β ERS amplitude proved to be with the error in a given trial weighted by the associated consistency of the error history, as measured by the bias, and the associated uncertainty of the error history, as measured by the variance. In the current paradigm, our state-space model explained more variance in both the β ERS and motor performance when the errors over the last 20 trials were used to estimate bias and variance. However, it is possible, perhaps even likely, that this integration window itself varies according to trial order number, task context, and the statistical properties of the error history. Trial order number may become relevant at the onset of the task, when the integration window may be abbreviated and/or the error history in past related scenarios contributes to the weighting of error. Evidence also suggests that the integration window can be much shorter in the response to random perturbations (Scheidt et al., 2001). In contrast, prior experience of a perturbation made consistently in the opposite direction modulates the rate at which adaptive changes occur to a new perturbation, with the interference reaching an asymptote after 15–40 trials (Sing and Smith, 2010).
The postmovement β ERS may therefore reflect neural processes linked to the evaluation of the results of a completed movement with respect to its predicted outcome, given an internal model of the intended movement (Shadmehr et al., 2010), but in the context of the consistency and uncertainty of prior angular errors. Whether the relevant neural processes underpin this evaluation of error and its history, or the effect of this evaluation drives the behavioral response, remains to be clarified. The distinction is subtle as, in either case, the correlations between trial error weighted by its history and the β ERS and subsequent behavioral performance still provide evidence that neural processes exist that could mediate Bayesian inference in motor adaptation (Körding and Wolpert, 2004; Fine and Thoroughman, 2007; Wei and Körding, 2009). However, there is evidence that allows us to consider the distinction still further. Given that the cerebellum is thought to play a preeminent role in the updating of internal models (Maschke et al., 2004; Smith and Shadmehr, 2005), whereas the primary motor cortex plays a more important role in retention in motor adaptation (Hadipour-Niktarash et al., 2007; Galea et al., 2011), a reasonable supposition is that the postmovement β ERS is related to the activity of cortical inputs from the cerebellar receiving nuclei of the thalamus. Consistent with this, studies in patients with thalamic lesions suggest that the motor thalamus facilitates cortical β oscillations (Van Der Werf et al., 2006), and those with direct recordings from thalamus demonstrate β-band coherence between sensorimotor cortex and motor thalamus that is attenuated in subjects with suspected cerebellar pathology (Marsden et al., 2000).
This cerebellar input to the sensorimotor cortex may help explain the motor cortex's role in the adaptive response to motor errors (Paz and Vaadia, 2004; Diedrichsen et al., 2005). But why should related motor cortical activity be focused in the β frequency band? One current theory seeking to explain the function of β activity is that it promotes the status quo (Gilbertson et al., 2005; Engel and Fries, 2010), or, in the present context, acts to preserve the set of motor commands that achieved the last response. Motor areas of the basal ganglia might also be involved in this function, given the β-band coherence between activities in these nuclei and sensorimotor cortex increases after movement (Litvak et al., 2012) and the recent observation that β power in ventral striatum increases after goal-reaching on correct trials and with learning in rodents (Howe et al., 2011).The heightened β synchronization after responses with minimal angular error might then reinforce the motor commands or forward model that requires little updating. Conversely, the attenuation of the β ERS after responses with large angular errors would facilitate a change in the set of motor commands that achieved the last response, especially when past errors have shown little variability.
Footnotes
This work was supported by the Medical Research Council and was carried out in the NIHR cognitive health Clinical Research Facility, Oxford, UK.
The authors declare no competing financial interests.
This is an Open Access article distributed under the terms of the Creative Commons Attribution License (http://creativecommons.org/licenses/by/3.0), which permits unrestricted use, distribution and reproduction in any medium provided that the original work is properly attributed.
References
- Alegre M, Labarga A, Gurtubay IG, Iriarte J, Malanda A, Artieda J. β electroencephalograph changes during passive movements: sensory afferences contribute to β event-related desynchronization in humans. Neurosci Lett. 2002;331:29–32. doi: 10.1016/S0304-3940(02)00825-X. [DOI] [PubMed] [Google Scholar]
- Alegre M, Alvarez-Gerriko I, Valencia M, Iriarte J, Artieda J. Oscillatory changes related to the forced termination of a movement. Clin Neurophysiol. 2008;119:290–300. doi: 10.1016/j.clinph.2007.10.017. [DOI] [PubMed] [Google Scholar]
- Baddeley RJ, Ingram HA, Miall RC. System identification applied to a visuomotor task: near-optimal human performance in a noisy changing task. J Neurosci. 2003;23:3066–3075. doi: 10.1523/JNEUROSCI.23-07-03066.2003. [DOI] [PMC free article] [PubMed] [Google Scholar]
- Burge J, Ernst MO, Banks MS. The statistical determinants of adaptation rate in human reaching. J Vis. 2008;8 doi: 10.1167/8.4.20. 20.1–19. [DOI] [PMC free article] [PubMed] [Google Scholar]
- Burnham KP, Anderson DR. Model selection and multimodel inference: a practical information-theoretic approach. New York: Springer; 2002. [Google Scholar]
- Cassim F, Monaca C, Szurhaj W, Bourriez JL, Defebvre L, Derambure P, Guieu JD. Does post-movement β synchronization reflect an idling motor cortex? Neuroreport. 2001;12:3859–3863. doi: 10.1097/00001756-200112040-00051. [DOI] [PubMed] [Google Scholar]
- Chen R, Yaseen Z, Cohen LG, Hallett M. Time course of corticospinal excitability in reaction time and self-paced movements. Ann Neurol. 1998;44:317–325. doi: 10.1002/ana.410440306. [DOI] [PubMed] [Google Scholar]
- Chen R, Corwell B, Hallett M. Modulation of motor cortex excitability by median nerve and digit stimulation. Exp Brain Res. 1999;129:77–86. doi: 10.1007/s002210050938. [DOI] [PubMed] [Google Scholar]
- Diedrichsen J, Hashambhoy Y, Rane T, Shadmehr R. Neural correlates of reach errors. J Neurosci. 2005;25:9919–9931. doi: 10.1523/JNEUROSCI.1874-05.2005. [DOI] [PMC free article] [PubMed] [Google Scholar]
- Donchin O, Francis JT, Shadmehr R. Quantifying generalization from trial-by-trial behavior of adaptive systems that learn with basic functions: theory and experiments in human motor control. J Neurosci. 2003;23:9032–9045. doi: 10.1523/JNEUROSCI.23-27-09032.2003. [DOI] [PMC free article] [PubMed] [Google Scholar]
- Engel AK, Fries P. β-band oscillations: signalling the status quo? Curr Opin Neurobiol. 2010;20:156–165. doi: 10.1016/j.conb.2010.02.015. [DOI] [PubMed] [Google Scholar]
- Fine MS, Thoroughman KA. Trial-by-trial transformation of error into sensorimotor adaptation changes with environmental dynamics. J Neurophysiol. 2007;98:1392–1404. doi: 10.1152/jn.00196.2007. [DOI] [PubMed] [Google Scholar]
- Galea JM, Vazquez A, Pasricha N, de Xivry JJ, Celnik P. Dissociating the roles of the cerebellum and motor cortex during adaptive learning: the motor cortex retains what the cerebellum learns. Cereb Cortex. 2011;21:1761–1770. doi: 10.1093/cercor/bhq246. [DOI] [PMC free article] [PubMed] [Google Scholar]
- Gilbertson T, Lalo E, Doyle L, Di Lazzaro V, Cioni B, Brown P. Existing motor state is favored at the expense of new movement during 13–35 Hz oscillatory synchrony in the human corticospinal system. J Neurosci. 2005;25:7771–7779. doi: 10.1523/JNEUROSCI.1762-05.2005. [DOI] [PMC free article] [PubMed] [Google Scholar]
- Hadipour-Niktarash A, Lee CK, Desmond JE, Shadmehr R. Impairment of retention but not acquisition of a visuomotor skill through time-dependent disruption of primary motor cortex. J Neurosci. 2007;27:13413–13419. doi: 10.1523/JNEUROSCI.2570-07.2007. [DOI] [PMC free article] [PubMed] [Google Scholar]
- Howe MW, Atallah HE, McCool A, Gibson DJ, Graybiel AM. Habit learning is associated with major shifts in frequencies of oscillatory activity and synchronized spike firing in striatum. Proc Natl Acad Sci U S. 2011;A108:16801–16806. doi: 10.1073/pnas.1113158108. [DOI] [PMC free article] [PubMed] [Google Scholar]
- Körding KP, Wolpert DM. Bayesian integration in sensorimotor learning. Nature. 2004;427:244–247. doi: 10.1038/nature02169. [DOI] [PubMed] [Google Scholar]
- Korenberg AT, Ghahramani Z. A Bayesian view of motor adaptation. Curr Psychol Cogn. 2002;21:537–564. [Google Scholar]
- Litvak V, Eusebio A, Jha A, Oostenveld R, Barnes G, Foltynie T, Limousin P, Zrinzo L, Hariz MI, Friston K, Brown P. Movement-related changes in local and long-range synchronization in Parkinson's disease revealed by simultaneous magnetoencephalography and intracranial recordings. J Neurosci. 2012;32:10541–10553. doi: 10.1523/JNEUROSCI.0767-12.2012. [DOI] [PMC free article] [PubMed] [Google Scholar]
- Macdonald JS, Mathan S, Yeung N. Trial-by-trial variations in subjective attentional state are reflected in ongoing prestimulus EEG α oscillations. Front Psychol. 2011;2:82. doi: 10.3389/fpsyg.2011.00082. [DOI] [PMC free article] [PubMed] [Google Scholar]
- Marsden JF, Ashby P, Limousin-Dowsey P, Rothwell JC, Brown P. Coherence between cerebellar thalamus, cortex and muscle in man: cerebellar thalamus interactions. Brain. 2000;123:1459–1470. doi: 10.1093/brain/123.7.1459. [DOI] [PubMed] [Google Scholar]
- Maschke M, Gomez CM, Ebner TJ, Konczak J. Hereditary cerebellar ataxia progressively impairs force adaptation during goal-directed arm movements. J Neurophysiol. 2004;91:230–238. doi: 10.1152/jn.00557.2003. [DOI] [PubMed] [Google Scholar]
- Noto CT, Robinson FR. Visual error is the stimulus for saccade gain adaptation. Brain Res Cogn Brain Res. 2001;12:301–305. doi: 10.1016/S0926-6410(01)00062-3. [DOI] [PubMed] [Google Scholar]
- Patton JL, Wei YJ, Bajaj P, Scheidt RA. Visuomotor learning enhanced by augmenting instantaneous trajectory error feedback during reaching. PloS One. 2013;8:e46466. doi: 10.1371/journal.pone.0046466. [DOI] [PMC free article] [PubMed] [Google Scholar]
- Paz R, Vaadia E. Specificity of sensorimotor learning and the neural code: neuronal representations in the primary motor cortex. J Physiol Paris. 2004;98:331–348. doi: 10.1016/j.jphysparis.2005.09.005. [DOI] [PubMed] [Google Scholar]
- Pfurtscheller G, Stancák A, Jr, Neuper C. Post-movement β synchronization: a correlate of an idling motor area? Electroencephalogr Clin Neurophysiol. 1996;98:281–293. doi: 10.1016/0013-4694(95)00258-8. [DOI] [PubMed] [Google Scholar]
- Pinheiro J, Bates D, DebRoy S, Sarkar D R Development Core Team. Nlme: linear and nonlinear mixed effects models. R package version. 2013 3.1–113. [Google Scholar]
- Saijo N, Gomi H. Effect of visuomotor-map uncertainty on visuomotor adaptation. J Neurophysiol. 2012;107:1576–1585. doi: 10.1152/jn.00204.2011. [DOI] [PubMed] [Google Scholar]
- Salmelin R, Hämäläinen M, Kajola M, Hari R. Functional segregation of movement-related rhythmic activity in the human brain. Neuroimage. 1995;2:237–243. doi: 10.1006/nimg.1995.1031. [DOI] [PubMed] [Google Scholar]
- Scheidt RA, Dingwell JB, Mussa-Ivaldi FA. Learning to move amid uncertainty. J Neurophysiol. 2001;86:971–985. doi: 10.1152/jn.2001.86.2.971. [DOI] [PubMed] [Google Scholar]
- Semrau JA, Daitch AL, Thoroughman KA. Environmental experience within and across testing days determines the strength of human visuomotor adaptation. Exp Brain Res. 2012;216:409–418. doi: 10.1007/s00221-011-2945-z. [DOI] [PubMed] [Google Scholar]
- Shadmehr R, Smith MA, Krakauer JW. Error correction, sensory prediction, and adaptation in motor control. Annu Rev Neurosci. 2010;33:89–108. doi: 10.1146/annurev-neuro-060909-153135. [DOI] [PubMed] [Google Scholar]
- Sing GC, Smith MA. Reduction in learning rates associated with anterograde interference results from interactions between different timescales in motor adaptation. PLoS Comput Biol. 2010:6. doi: 10.1371/journal.pcbi.1000893. [DOI] [PMC free article] [PubMed] [Google Scholar]
- Smith MA, Shadmehr R. Intact ability to learn internal models of arm dynamics in Huntington's disease but not cerebellar degeneration. J Neurophysiol. 2005;93:2809–2821. doi: 10.1152/jn.00943.2004. [DOI] [PubMed] [Google Scholar]
- Smith MA, Ghazizadeh A, Shadmehr R. Interacting adaptive processes with different timescales underlie short-term motor learning. PLoS Biol. 2006;4:e179. doi: 10.1371/journal.pbio.0040179. [DOI] [PMC free article] [PubMed] [Google Scholar]
- Spinks RL, Kraskov A, Brochier T, Umilta MA, Lemon RN. Selectivity for grasp in local field potential and single neuron activity recorded simultaneously from M1 and F5 in the awake macaque monkey. J Neurosci. 2008;28:10961–10971. doi: 10.1523/JNEUROSCI.1956-08.2008. [DOI] [PMC free article] [PubMed] [Google Scholar]
- Tan H, Pogosyan A, Anzak A, Ashkan K, Bogdanovic M, Green AL, Aziz T, Foltynie T, Limousin P, Zrinzo L, Brown P. Complementary roles of different oscillatory activities in the subthalamic nucleus in coding motor effort in Parkinsonism. Exp Neurol. 2013;248:187–195. doi: 10.1016/j.expneurol.2013.06.010. [DOI] [PMC free article] [PubMed] [Google Scholar]
- Thoroughman KA, Shadmehr R. Learning of action through adaptive combination of motor primitives. Nature. 2000;407:742–747. doi: 10.1038/35037588. [DOI] [PMC free article] [PubMed] [Google Scholar]
- Tseng YW, Diedrichsen J, Krakauer JW, Shadmehr R, Bastian AJ. Sensory prediction errors drive cerebellum-dependent adaptation of reaching. J Neurophysiol. 2007;98:54–62. doi: 10.1152/jn.00266.2007. [DOI] [PubMed] [Google Scholar]
- Van Der Werf YD, Sadikot AF, Strafella AP, Paus T. The neural response to transcranial magnetic stimulation of the human motor cortex: II. Thalamocortical contributions. Exp Brain Res. 2006;175:246–255. doi: 10.1007/s00221-006-0548-x. [DOI] [PubMed] [Google Scholar]
- Wei K, Körding K. Relevance of error: what drives motor adaptation? J Neurophysiol. 2009;101:655–664. doi: 10.1152/jn.90545.2008. [DOI] [PMC free article] [PubMed] [Google Scholar]
- Wolpert DM, Miall RC. Forward models for physiological motor control. Neural Netw. 1996;9:1265–1279. doi: 10.1016/S0893-6080(96)00035-4. [DOI] [PubMed] [Google Scholar]
- Yamamoto M, Ando H. Probabilistic models of state estimation predict visuomotor transformations during prism adaptation. Vis Neurosci. 2012;29:119–129. doi: 10.1017/S0952523812000053. [DOI] [PubMed] [Google Scholar]
- Yuan H, Perdoni C, He B. Relationship between speed and EEG activity during imagined and executed hand movements. J Neural Eng. 2010;7:26001. doi: 10.1088/1741-2560/7/2/026001. [DOI] [PMC free article] [PubMed] [Google Scholar]