Abstract
Background
p53 influences genomic stability, apoptosis, autophagy, response to stress, and DNA damage. New p53-target genes could elucidate mechanisms through which p53 controls cell integrity and response to damage.
Methods
DRAGO (drug-activated gene overexpressed, KIAA0247) was characterized by bioinformatics methods as well as by real-time polymerase chain reaction, chromatin immunoprecipitation and luciferase assays, time-lapse microscopy, and cell viability assays. Transgenic mice (94 p53−/− and 107 p53+/− mice on a C57BL/6J background) were used to assess DRAGO activity in vivo. Survival analyses were performed using Kaplan–Meier curves and the Mantel–Haenszel test. All statistical tests were two-sided.
Results
We identified DRAGO as a new p53-responsive gene induced upon treatment with DNA-damaging agents. DRAGO is highly conserved, and its ectopic overexpression resulted in growth suppression and cell death. DRAGO−/− mice are viable without macroscopic alterations. However, in p53−/− or p53+/− mice, the deletion of both DRAGO alleles statistically significantly accelerated tumor development and shortened lifespan compared with p53−/− or p53+/− mice bearing wild-type DRAGO alleles (p53−/−, DRAGO−/− mice: hazard ratio [HR] = 3.25, 95% confidence interval [CI] = 1.7 to 6.1, P < .001; p53+/−, DRAGO−/− mice: HR = 2.35, 95% CI = 1.3 to 4.0, P < .001; both groups compared with DRAGO+/+ counterparts). DRAGO mRNA levels were statistically significantly reduced in advanced-stage, compared with early-stage, ovarian tumors, but no mutations were found in several human tumors. We show that DRAGO expression is regulated both at transcriptional—through p53 (and p73) and methylation-dependent control—and post-transcriptional levels by miRNAs.
Conclusions
DRAGO represents a new p53-dependent gene highly regulated in human cells and whose expression cooperates with p53 in tumor suppressor functions.
Response of cancer cells to anticancer drug treatment is mediated by the activation of genes responsible for the initiation of a cascade of events eventually leading to cell cycle arrest or apoptosis. The most representative of these genes is the product of the p53 gene, which is induced, mainly by a post-translational mechanism, after treatment of cells with drugs acting with different mechanisms of action (1–3). The induction of p53 results in an increased transcription of genes containing the p53 binding site in their regulatory sequences, including CDKN1A (p21), BAX, GADD45A, TNFRSF10B (DR5), BBC3 (PUMA), and PMAIP1 (Noxa), all genes involved in the control of the cell cycle or apoptosis (4–8). It has been reported that after DNA damage, p53 is differently modified, depending on the kind of damage induced, mostly through phosphorylation, acetylation, sumoylation, and methylation (9–14). The different post-translational modifications could have a strong impact on the differential transcription of p53-downstream genes, thus possibly dictating the decision to activate cell cycle arrest or apoptosis (15,16).
Recent evidence implicates p53 in the regulation of other functions, including autophagy, cell metabolism, reactive oxygen species production, and immune response (2,17–20). For some of these functions, the downstream effectors, activated by p53, have been characterized. For others, these mediators have yet to be identified. The search for genes activated either early or at relatively longer times after anticancer drug treatment is an important research area that could help in defining new genes involved in the maintenance of cell integrity and control.
In this article, we report the isolation of a new gene termed DRAGO (drug-activated gene overexpressed, KIAA0247). This gene is activated in a p53-dependent way after DNA damage and shows potent growth-suppressive activity in vitro. DRAGO also cooperates with p53 in preventing tumor onset in vivo.
Methods
Identification of DRAGO
Differential display was performed on total RNA extracted at 1, 6, and 24 hours after treatment of the human ovarian cancer cells A2780 with tallimustin. Fragments presenting a differential expression after treatment were excised and sequenced.
Isolation of Genomic Clones
Clones containing the genomic DRAGO sequences were isolated by screening a genomic library spotted on filters obtained through the UK Human Genome Mapping Project Resource Centre. Details are given in the Supplementary Methods (available online).
Promoter Activity Investigation
An approximately 10-Kb long genomic fragment comprising exon1 and part of the first intron of DRAGO was isolated from the genomic library. This fragment and its subfragments were investigated for the presence of putative p53 binding sites. Their responsiveness to p53 and different p73 isoforms was assessed by luciferase and chromatin immunoprecipitation assays. Refer to the Supplementary Methods (available online) for more details.
Small Interfering RNA experiments
Cells were transfected with 60nM DRAGO and control small interfering RNAs (siRNAs; Sigma-Aldrich, St. Louis, MO) 24 hours after seeding using Lipofectamine 2000 (Invitrogen, Carlsbad, CA). Drug treatment started 24 hours after transfection. HCT116 p53+/+ and p53−/− growth curves in the absence or presence of drugs were obtained using the MTS cell proliferation assay (Promega, Madison, WI). Absorbance was acquired using a plate reader (Infinite M200; TECAN, Männedorf, Switzerland). Experiments, each consisting of six replicates, were repeated three times. Detailed procedures are given in the Supplementary Methods (available online).
DRAGO and p53 Transgenic Mice
DRAGO knockout mice were generated by GenOway (Lyon, France), starting from a genomic clone isolated from a murine genomic library containing the entire DRAGO sequence (for details see Supplementary Methods, available online). The DRAGO allele was inactivated in embryonic stem cells from 126SV mice by deleting the region comprising exon 3 to exon 5 (Supplementary Figure 1, A and B, available online). p53 transgenic mice (TRP53tm1Tyj/J strain on a C57BL/6J genetic background) were purchased from Jackson Lab (Bar Harbor, ME). p53 transgenic and DRAGO knockout mice were crossed, and a total of 201 mice (94 p53 −/− and 107 p53 +/− mice on a C57BL/6J background) were used in the experiments.
Statistical Analyses
All statistical analyses were performed using PRISM6 (GraphPad Software, La Jolla, CA). Survival was assessed with Kaplan–Meier analyses, and the Mantel–Haenszel version of the log-rank test was used to test the hypothesis of no difference among curves and to calculate the hazard ratios (HRs) and relative confidence intervals (CIs). For all the other comparisons, the t test was applied. All statistical tests were two-sided.
Results
Discovery of DRAGO and Its Regulation by p53
By using differential display, we isolated a cDNA fragment whose expression was induced 24 hours after treatment by tallimustine, a DNA minor groove alkylating agent (21). This fragment was found to match an uncharacterized gene, KIAA0247 (22), deposited in Genebank (D87434.1), which we named DRAGO (drug-activated gene overexpressed). The full length cDNA of DRAGO is 5338bp long and contains six exons coding for a 303–amino acid protein, with the ATG located in the second exon. Interestingly, the majority of the cDNA (approximately 4000bp) is composed of a long 3’-untranslated region (3’UTR), which occupies most of exon 6 and harbors numerous consensus binding sites (adenine–uridine-rich elements) for proteins known to participate in the control of messenger RNA stability as well as potential miRNA binding sites (Figure 1A). By comparing the gene sequence with others present in Genebank, we found that the human DRAGO gene is highly conserved among species (Figure 1B). Protein sequence analysis did not reveal any conserved domain except for the presence of one SUSHI domain in exon 3 and two transmembrane domains in exons 2 and 4.
Figure 1.
DRAGO features. A) Gene structure with exons numbered from one to six. Slashes indicate intron 1 and 2; red and blue boxes indicate the position of the predicted SUSHI and transmembrane domains, respectively. B) Alignment of human DRAGO protein with homologs (CHICK = Gallus gallus; DANRE = Danio rerio; MOUSE = Mus musculus; PANTR = Pan troglodytes; RAT = Rattus norvegicus; XENLA = Xenopus laevis); identical residues are marked with an asterisk (*), conserved residues with double dots (:), semiconserved residues with a single dot (.). The color indicates hydrophobic (blue), positively charged (green), and negatively charged (red) amino acids.
p53 and DNA Damage–Dependent Regulation of DRAGO
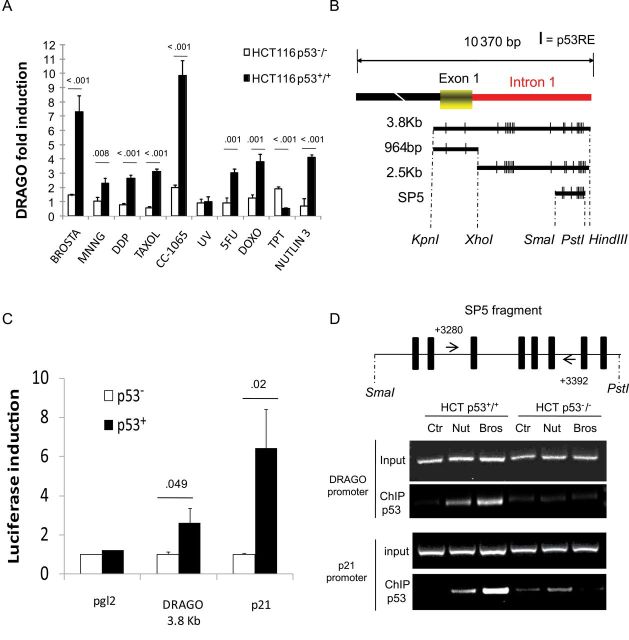
To verify that the induction of DRAGO was not restricted to tallimustine treatment, we tested different anticancer agents for their ability to selectively induce the expression of DRAGO by using real-time polymerase chain reaction. These experiments were performed both in HCT116 p53+/+ and HCT116 p53−/− cells. All drugs tested (cisplatin, alkylating agents, antimetabolites, topoisomerase II inhibitors, taxanes, Nutlin-3) were able to induce the expression of DRAGO in HCT116 p53+/+ cells but not in HCT116 p53−/− cells (Figure 2A). Most of the compounds tested caused a twofold to fourfold increase of DRAGO expression, except brostallicin and CC-1065, which induced higher DRAGO expression (P < .001 for all compounds; except nitrosoguanidine: P = .008; 5-fluorouracil: P = .001; and doxorubicin: P = .001, multiple t test with Bonferroni correction). Of note, we observed no effect with topotecan and ultraviolet treatments. We also tested the induction of DRAGO in cells with an inducible expression of p53 (or p73). In these systems, the overexpression of either p53 or p73 only slightly induced DRAGO mRNA, whereas a classical p53-inducible gene, such as p21, showed a strong induction (Supplementary Figure 2, available online).
Figure 2.
DRAGO regulation by p53. A) Real-time polymerase chain reaction showing DRAGO mRNA expression level in HCT116 p53+/+ and p53−/− cells. Data are the mean ± standard deviation and are pooled from three independent experiments. Values above the columns represent multiple t test P values with Bonferroni correction. B) DRAGO 5’ untranslated region (UTR): subfragments were obtained by restriction enzyme digestion as shown in the picture. Bars represent p53REs. C) Luciferase induction levels by p53 using the 3.8-Kb fragment from DRAGO 5’UTR. (Black bars: cotransfection with p53; pgl2 = empty vector; p21 = p21 promoter representing positive control). Data are the mean ± standard deviation and are representative of three independent experiments. Values above the columns represent multiple t test P values with Bonferroni correction. D) Upper panel: schematic diagram of SP5 promoter region showing p53 response elements (black bars) and primer position (arrows). Lower panel: chromatin immunoprecipitation (ChIP) assay displaying interaction between p53 and DRAGO promoter in basal conditions (ctr) and upon treatment with Nutlin-3 (Nut, 10 uM) and Brostallicin (Bros, 200nM) in HCT p53+/+ cells. p21 promoter and HCT p53−/− cells were used as positive and negative controls, respectively. All statistical tests were two-sided.
DRAGO Transcriptional Control by p53 and Different p73 Isoforms
The DRAGO sequence was searched for potential p53 binding sites. Several sequences were identified within exon 1 and the first intron (Figure 2B). A 3.8-Kb fragment spanning exon 1 and a portion of intron 1 was subcloned upstream of the luciferase reporter gene. Upon cotransfection with a p53-expression vector into a p53-null cell line (SaoS-2), this fragment proved to be responsive to p53 (P = .049, multiple t test with Bonferroni correction) (Figure 2C). Further luciferase assays established the SP5 fragment (a 602-bp fragment generated by Pst1-SmaI digestion of the original 3.8-Kb promoter fragment) (Figure 2B) within intron 1 as the shortest promoter portion able to transactivate the luciferase gene by p53, as well as by TAp73α, TAp73β, and TAp73γ isoforms (Supplementary Figure 3, available online). p53 transactivation activity on SP5 was almost completely lost when the p53 response elements located in this region underwent site-directed mutagenesis (Supplementary Figure 4, available online). Physical interaction between the SP5 nucleotide sequence and p53, as well as p73 isoforms, was confirmed by electromobility shift assay experiments (Supplementary Figure 5, available online). These results were further confirmed by chromatin immunoprecipitation assay demonstrating the interaction between p53 and the SP5 promoter sequence (Figure 2D).
Effects Induced by DRAGO Overexpression
The entire DRAGO cDNA was cloned into the pCDNA3 expression vector and transfected into different cell lines, either expressing or not expressing a wtp53. DRAGO cDNA had growth suppressive activity in all cell lines, regardless of the status of p53, and no clones could be stained 14 days after transfection (Figure 3A). Transient transfection of DRAGO cDNA induced the formation of vacuoles in 3T3 fibroblasts (Figure 3B), as well as in SaoS-2 cells. Time-lapse experiments performed in SaoS-2, U2OS, and HCT116 cells transfected with the green fluorescent protein–DRAGO expression construct showed that cells overexpressing green fluorescent protein–DRAGO fusion protein died (Figure 3C), with an initial formation of vacuoles and subsequent cellular membrane disruption.
Figure 3.
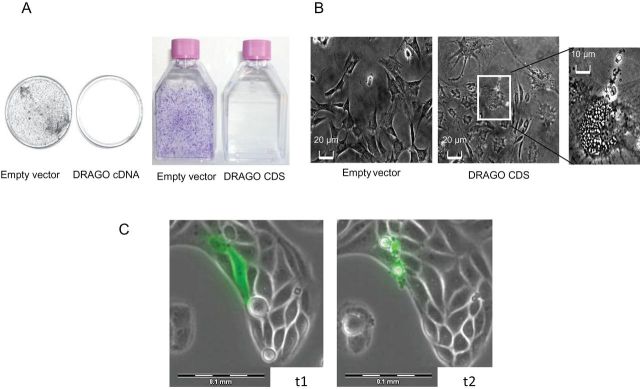
DRAGO expression induces cell death. A) Crystal violet staining of A2780 cell line 14 days after transfection with DRAGO full-length cDNA (plates), and DRAGO coding sequence (CDS; flasks). B) Contrast phase microscopy of 3T3 cells 24 hours after transfection with DRAGO coding sequence. Morphological abnormalities are magnified (Scale bars = 20 µm; scale bar in magnified field = 10 µm). C) Frames taken from time-lapse microscopy movie of green fluorescent protein–DRAGO transiently transfected SaoS-2 cells (t1 and t2: 16 and 22 hours after transfection, respectively). (Scale bar = 0.1mm).
Effects of DRAGO Silencing
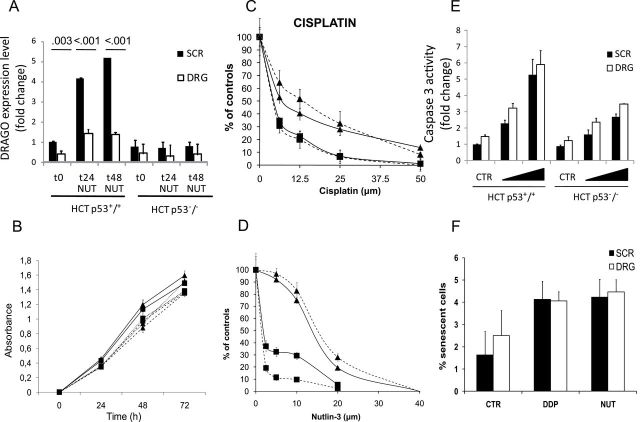
We decided to explore the phenotype associated with the depletion of DRAGO expression by transfecting cells with siRNA against DRAGO mRNA. The knockdown reduced the gene expression by roughly 60% in the basal condition (P = .003, multiple t test with Bonferroni correction) and completely antagonized the drug-induced DRAGO overexpression (P < .001 at both 24 and 48 hours) (Figure 4A). Silencing of DRAGO did not influence the growth of either wild-type or HCT116 p53−/− cells (Figure 4B) No statistically significant changes in the cytotoxic activity of cisplatin (Figure 4C) and Nutlin-3 (Figure 4D) were observed on HCT116 p53+/+ cells. Then we treated the p53 isogenic HCT116 cell lines with combinations of Nutlin-3 and doxorubicin that were shown to induce high levels of apoptosis in the same cell lines (23). Silencing of DRAGO did not statistically significantly influence the apoptotic response (Figure 4E). Similarly we treated the cell lines with different drugs and evaluated the expression of β-Gal, a senescence marker. DRAGO knockdown did not induce considerable changes to the senescence response (Figure 4F).
Figure 4.
Effects of DRAGO silencing. A) DRAGO expression in HCT116 p53+/+ and HCT116 p53−/− cell lines in basal condition (t0) and in response to 10 μM Nutlin-3 (NUT) 24 (t24) and 48 (t48) hours after treatment. Cells were concomitantly treated with scramble small interfering RNA (siRNA; SCR) and DRAGO siRNA (DRG). Values above the columns represent multiple t test P values. B) HCT116 p53+/+ (■) and HCT116 p53-/- (▲) growth curves in basal conditions (solid line) and upon treatment with DRAGO siRNA (dashed line) and scramble siRNA (dotted line). C and D) HCT116 p53+/+ (■) and p53−/− (▲) cell proliferation assay with concomitant treatment with DRAGO siRNA (dashed line) and scramble siRNA (solid line). E) Caspase 3 activity in basal conditions (CTR) and in response to increasing doses of cytotoxic treatment (combination of a constant dose of 10 μM Nutlin-3 with increasing doses of doxorubicin at 0.5 and 1 μM). Cells were concomitantly treated with scramble siRNA (SCR) and DRAGO siRNA (DRG). F) Senescence response in HCT116 p53+/+ cells in basal conditions (CTR) and in response to cisplatin (DDP, 10 μM) and Nutlin-3 (NUT, 10 μM). Cells were concomitantly treated with scramble siRNA (SCR) and DRAGO siRNA (DRG). All data shown are the mean ± standard deviation of three independent experiments. All statistical tests were two-sided.
DRAGO Mutational Status and Expression Level in Human Tumors
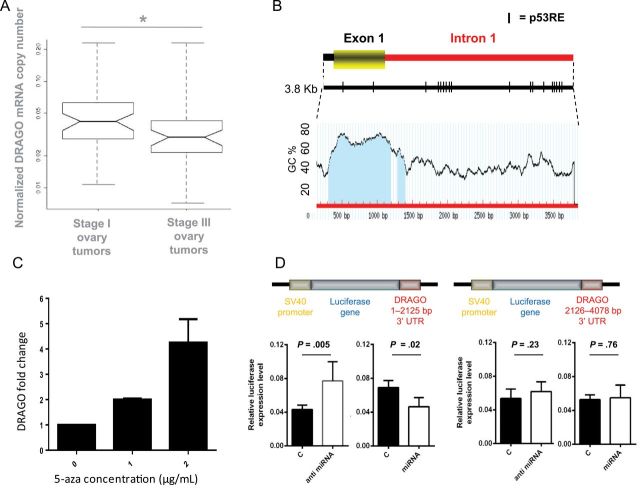
To check for the presence of DRAGO mutations in tumors, we initially sequenced the DRAGO gene in a panel of 12 human cancer cell lines without finding any mutations. We extended the analysis to 20 primary human tumors, considering several ovarian, colon, and endometrial cancers, without finding any mutations (data not shown). We then measured the expression of DRAGO mRNA in human ovarian cancer at different International Federation of Gynecology and Obstetrics (FIGO) stages (24) of the disease by real-time polymerase chain reaction. Analyzing 49 stage I samples and 47 stage III samples of ovarian tumors, we found that advanced-stage tumors do express roughly 30% less DRAGO mRNA than early-stage tumors (Figure 5A), and the difference between stage I and III levels was statistically significant (P = .02, two-sided t test). Whereas no p53 mutations were found in early-stage patients, approximately 50% of late-stage patients presented mutations in the p53 gene. We stratified stage III patients based on their p53 mutational status, but the DRAGO gene expression level did not statistically significantly differ between the two populations (P = .66, two-sided t test) (Supplementary Figure 6, available online).
Figure 5.
DRAGO expression regulation. A) DRAGO mRNA levels in stage I (n = 49) and stage III (n = 47) ovarian tumors determined by real-time reverse-transcription polymerase chain reaction (*P = .02, two-sided t test). After normalization of each sample to its own set of housekeeping genes, data are expressed as absolute copy numbers on a linear scale. The line within the boxes indicates the median. The top edge of the boxes represents the 75th percentile, the bottom edge represents the 25th percentile. The range is shown as a vertical dashed line. B) Methylation prediction of the 3.8-Kb fragment from DRAGO 5’ untranslated region (UTR), GC = guanine–cytosine. The blue area represents the expected CpG island. C) Real-time polymerase chain reaction showing induction of DRAGO mRNA in response to increasing concentration of demethylating agent 5-aza-2’-deoxycytidine (5-aza) in SaoS-2 cells. Data are the mean ± standard deviation and are pooled from three independent experiments. D) Luciferase assays performed with DRAGO 3’UTR fragments 1–2125 and 2126–5078 cloned downstream from the luciferase gene in SKOV3 cells. Cotransfection with anti-miRNA15-b determined an increase in luciferase induction for fragment 1–2125, whereas cotransfection with miRNA15-b determined a decrease in luciferase activity for the same fragment. No increase was observed for fragment 2126–5078. Results shown are the mean ± standard deviation of three independent experiments. P values (two-sided t test) are shown in each panel.
Transcriptional and Post-transcriptional DRAGO Expression Regulation
The absence of mutations and the decreased expression in advanced tumors prompted us to verify whether epigenetic regulation of DRAGO could play a role in controlling its expression. We indeed identified a CpG island of approximately 1000bp covering exon 1 and part of the first intron (Methprimer; USFC, CA) (Figure 5B). We therefore tested whether treatment of the SaoS2 cell line with the demethylating agent 5’aza-2’-deoxycytidine resulted in changes of the gene mRNA expression. Figure 5C shows that 5’aza-2’-deoxycytidine is indeed able to increase the messenger level in a concentration-dependent manner.
We assessed the role of 3’UTR sequence in controlling DRAGO expression by subcloning this region downstream of the luciferase reporter gene. Two different fragments (corresponding to the nucleotides 1–2125 and 2126–4078 of the region) were tested. We arbitrarily selected miRNA15-b, which has a putative binding site in the first fragment (nucleotides 1–2125). The luciferase-based plasmids were stably transfected in SKOV3 cells, and the luciferase expression levels were analyzed after transfection with anti hsa-miRNA15b or pre-miRNA15b. Figure 5D shows that luciferase expression increased twofold after transfection with anti-miRNA in cells expressing the luciferase gene upstream from the 1–2125 fragment (P = .005, unpaired t test), whereas no increase could be measured in cells expressing the luciferase gene upstream of the 2126–4078 fragment (P = .23). In accordance, transfection with pre-miRNA15b statistically significantly reduced the expression of the luciferase gene upstream from the 1–2125 fragment (P = .02) and again was ineffective in cells expressing the 2126–4078 fragment (P = .76).
DRAGO Tumor Suppressor Role in Cooperation With p53
The generation of mice bearing targeted deletion of DRAGO was performed in collaboration with GenOway. These mice were viable and fertile and did not show any notable developmental defect. In addition, DRAGO −/− mice showed no tumor formation within 2 years.
We then crossed DRAGO +/− with p53 +/− mice on a C57Bl/6J background. DRAGO +/− p53 +/− mice were intercrossed to generate all of the different genotype combinations, which were generated with the expected frequencies, except for the p53 −/− female subpopulation, whose occurrence was statistically significantly lower than the estimated value (Supplementary Table 1, available online), as already described in the literature (25). Survival analysis of the p53-null background mice showed a progressive decrease of lifespan with deletion of one or both DRAGO alleles, respectively, in comparison with mice carrying wild-type DRAGO (p53 −/− DRAGO +/+) (Figure 6A). p53 −/− DRAGO +/+ mice had a median survival time of 190 days, which decreased to 166 days in p53 −/− DRAGO +/− mice and was further reduced to 139 days in p53 −/− DRAGO −/− mice. The analysis indicated a statistically significant difference in survival between DRAGO +/+ and DRAGO −/− subpopulations (p53 −/− DRAGO −/− mice: HR = 3.25, 95% CI = 1.7 to 6.1, P < .001, compared with DRAGO +/+ counterpart) (Figure 6B). The histopathological analysis of tumors that arose in these mice did not show statistically significant differences among the groups, with a marked prevalence of lymphomas followed by sarcomas, as expected for p53 −/− mice (Figure 6C) (26). In mice with p53+/− background, DRAGO +/+ mice displayed a prolonged survival compared with either DRAGO +/− or DRAGO −/− mice. Unlike what was observed on the p53 −/− background, DRAGO +/− and DRAGO −/− mice had similar survival, which showed a decrease of about 120 days in the median survival compared with DRAGO +/+ mice (Figure 7A), and displayed hazard ratios with a statistically significant higher risk of death (p53 +/− DRAGO −/− mice: HR = 2.35, 95% CI = 1.3 to 4.0, p < .001; p53 +/− DRAGO +/− mice: HR = 3.6, 95% CI = 2.1 to 6.1, P < .001) (Figure 7B). Histopathological examinations of the tumor spectrum in the p53 +/− subpopulations showed a higher incidence of sarcomas, followed by lymphomas and carcinomas (Figure 7C), in accordance with the literature (25). Furthermore, stratified survival assessment indicated that in all malignancies p53 +/− DRAGO +/+ subpopulation showed the best survival, whereas p53 +/− DRAGO +/− and p53 +/− DRAGO −/− subpopulations displayed shortened survival with overlapping curves (Supplementary Figure 7, available online).
Figure 6.
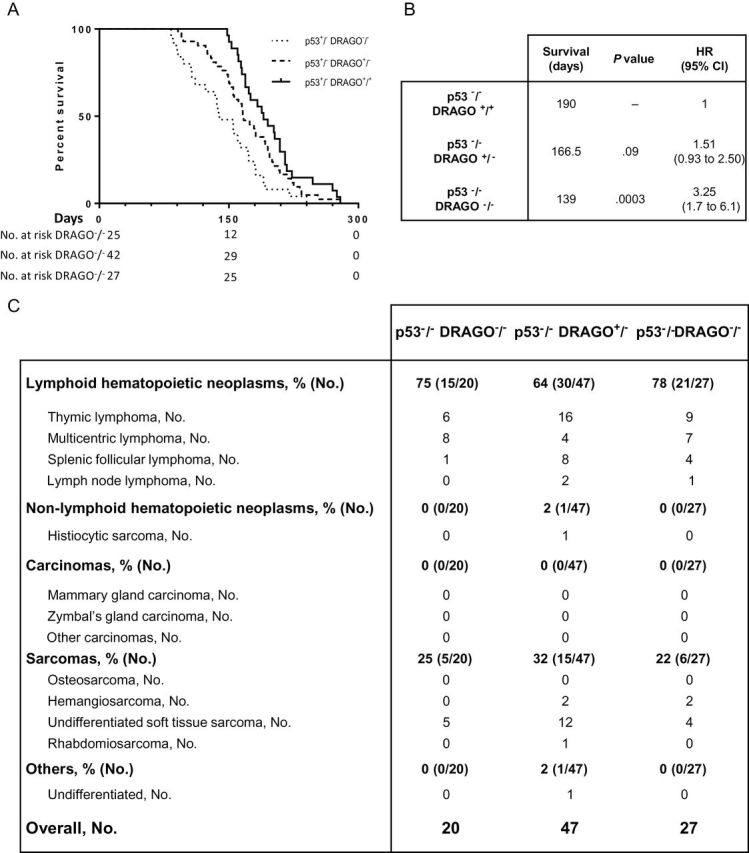
Assessment of p53−/− background DRAGO subpopulations. A) Kaplan–Meier curves of DRAGO+/+ (n = 27), DRAGO+/− (n = 42), and DRAGO−/− (n = 25) mice. B) Statistical analysis (median survival, Mantel–Haenszel P value, and hazard ratio [HR] with 95% confidence interval [CI]). C) Tumor spectrum. All statistical tests were two-sided.
Figure 7.
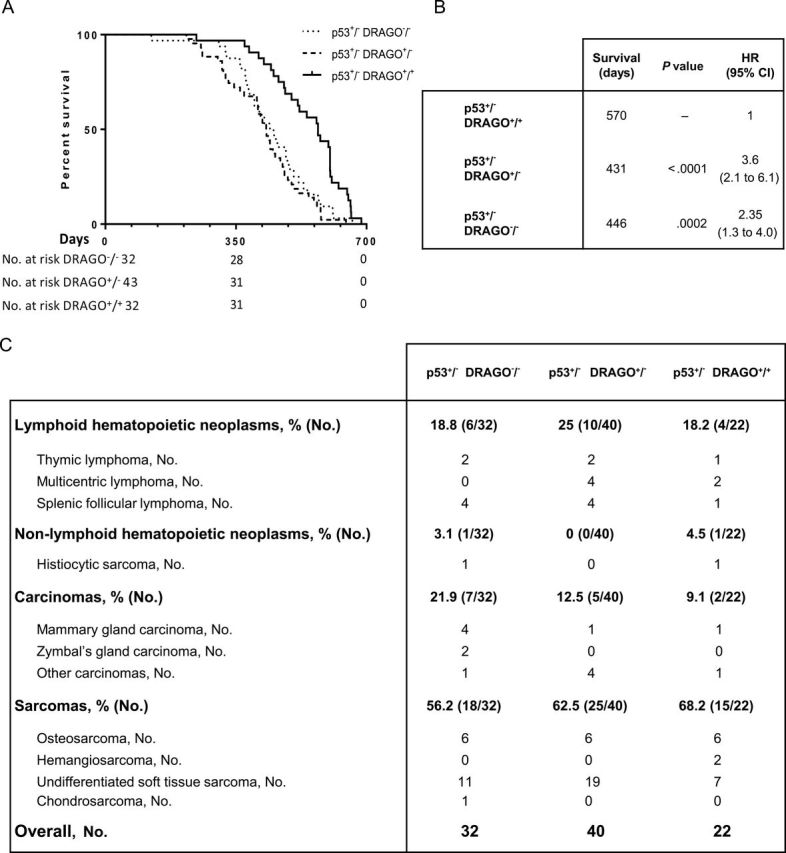
Assessment of p53+/− background DRAGO subpopulations. A) Kaplan–Meier curves of DRAGO+/+ (n = 32), DRAGO+/− (n = 43), and DRAGO−/− (n = 32) mice. B) Statistical analysis (median survival, Mantel–Haenszel P value, and hazard ratio [HR] with 95% confidence interval [CI]). C) Tumor spectrum. All statistical tests were two-sided.
Discussion
We have identified a new p53-responsive gene, named DRAGO, whose induction is lethal for the cells. Indeed 3T3 MEF transient transfection and the green fluorescent protein–DRAGO time-lapse experiments demonstrated that DRAGO-overexpressing cells underwent cell death a few hours after transfection. Consequently, we could not isolate stably transfected single-cell clones overexpressing the DRAGO protein.
Our in vitro data demonstrated that DRAGO is induced by p53 in response to cytotoxic insults, and we provided evidence that p73 is involved in DRAGO regulation as well. The overexpression of p53 (or p73) per se only slightly induces DRAGO expression, whereas treatment with drugs that are known to determine post-translational modifications of p53 and p73 causes a clear DRAGO overexpression. Nutlin-3, a compound known to induce overexpression of p53 by interfering with p53–mdm2 interaction is also able to induce DRAGO expression. This observation is not surprising because it has been reported that treatment with Nutlin-3 induces phosphorylation of p53 and γH2AX foci formation in cancer cells growing in vitro (23,26), consistent with the induction of DNA damage response. Interestingly, in the same cellular context, ultraviolet treatment does not induce DRAGO, and we could speculate that DNA damage is necessary but not sufficient to induce DRAGO, and either the extent of damage or the signal cascade activated by the different damage induction is an important factor determining its activation.
Knockdown of DRAGO expression by silencing RNA demonstrated that the gene is dispensable in physiological conditions and that it does not seem to be involved in the apoptosis/senescence–mediated response to stress. Data from the assessment of the DRAGO −/− murine phenotype were in accordance with those from the siRNA experiments, as these mice displayed a normal phenotype in physiological conditions. Despite DRAGO expression being dispensable for activation of the apoptosis/senescence response to several stresses in vitro, in human cancer different lines of evidence indicate that DRAGO behaves like an antioncogene. In stage III ovarian tumors, DRAGO mRNA level decreases compared with stage I tumors, even in the absence of mutations in the coding region of the gene. A similar finding has been reported for several oncosuppressive genes, such as p21, ING3, RASSF1A, RU NX3, for which an inverse association between messenger expression levels and tumor progression has been described (27–30). Similar to DRAGO, these antioncogenes are rarely found mutated in tumors. Rather, mechanisms such as promoter methylation or post-transcriptional gene silencing are responsible for the reduction of the expression levels of these genes. We showed evidence that the same mechanisms are also implicated in DRAGO gene expression regulation. Our hypothesis supporting the role of DRAGO as an oncosuppressive gene is also corroborated by the finding that, in a clinical study, low DRAGO (KIAA0247) RNA levels detected in feces are associated with a reduced 5-year overall survival and increased tumor size in colorectal cancer patients (31).
In spite of the gene’s potential oncosuppressive features, DRAGO −/− mice did not develop spontaneous tumors, which, however, does not exclude a potential antioncogene activity. Similarly, other known oncosuppressor genes did not induce any apparent phenotype when knocked out in a mouse model (32). DRAGO displayed a protective effect against tumor onset and statistically significantly prolonged mouse survival in a p53-defective background. Combined p53 DRAGO knockout mice showed a tumor distribution similar to either p53 +/− or p53 −/− single-mutant mice (25). Such results indicate that the oncosuppressive effect of DRAGO is independent of tumor type and that the gene inactivation accelerates tumor development. Also, the survival reduction observed in DRAGO +/− and DRAGO −/− mice on a p53 −/− background clearly demonstrates that other transcription factors besides p53 are responsible for DRAGO transactivation.
We propose a model in which DRAGO expression is strongly regulated at post-transcriptional level by miRNAs and/or proteins binding the adenine–uridine-rich elements located in the long 3’UTR of DRAGO. In case of irreversible damage, the gene is induced by p53, leading to cell death. In vitro experiments in p53 isogenic cell lines demonstrated the prominent role of p53 in transactivating DRAGO after treatment with cytotoxic agents. We hypothesize that p73 is also responsible for DRAGO regulation under physiological conditions.
Indeed we observed that deletion of DRAGO on a p53 +/− background resulted in a reduction in lifespan similarly to that observed in p53 +/− p73 +/− mice (33). We might speculate that DRAGO could be a major downstream effector of p73, besides its demonstrated regulation by p53, so that deletion of either p73 or DRAGO determines a similar outcome on p53 +/− mice. As reported in the Results, this potential role of p73 in transactivating DRAGO is compatible with the data from the luciferase and electromobility shift assay experiments. Thus, we might hypothesize that p73 is partially responsible for DRAGO expression in p53 knockout mice. Our hypothesis is supported by the evidence that tumor distribution in p53 +/− p73 +/− and p53+/− DRAGO+/− mice is similar. Indeed sarcomas are the most common malignancies (50% for p53 +/− p73 +/− mice and approximately 60% for p53 +/− DRAGO +/− mice), followed by lymphomas (22.5% vs. approximately 25%) and carcinomas (27.5% vs. approximately 12%) (33).
One limitation of our study is that, despite several efforts, we could not produce a specific antibody recognizing DRAGO protein, and this prevented us from defining protein expression level in all experimental settings.
Our results highlighted a role in tumor suppression for DRAGO. Although direct evidence is yet to be presented, the data available so far would suggest a possible function in the immune response: KIAA0247 silencing determines a downregulation of CCL2 in response to lipopolysaccharides treatment in vitro (34); a microarray experiment showed that KIAA0247 is one of the few human genes always overexpressed in response to different inflammatory stresses (35); and data from microarray databases (http://genomicdbdemo.bxgenomics.com/web/ and http://biogps.org) show that KIAA0247 is expressed at higher levels in cells belonging to the immune system, both innate and adaptive (Supplementary Figure 8, available online). The only known functional domain present in DRAGO protein is a SUSHI domain, a domain shared by complement and adhesion proteins. Further studies are in progress to specifically address this point.
P. Rusconi is a fellow of the Monzino Foundation, Milan, Italy. All authors declare no potential conflicts of interest.
References
- 1. Lane D, Levine A. p53 research: the past thirty years and the next thirty years. Cold Spring Harb Perspect Biol. 2010;2(12):a000893. [DOI] [PMC free article] [PubMed] [Google Scholar]
- 2. Menendez D, Inga A, Resnick MA. The expanding universe of p53 targets. Nat Rev Cancer. 2009;9(10):724–737 [DOI] [PubMed] [Google Scholar]
- 3. Vousden KH, Prives C. Blinded by the light: the growing complexity of p53. Cell. 2009;137(3):413–431 [DOI] [PubMed] [Google Scholar]
- 4. El-Deiry WS, Tokino T, Velculescu VE, et al. WAF1, a potential mediator of p53 tumor suppression. Cell. 1993;75(4):817–825 [DOI] [PubMed] [Google Scholar]
- 5. Nakano K, Vousden KH. PUMA, a novel proapoptotic gene, is induced by p53. Mol Cell. 2001;7(3):683–694 [DOI] [PubMed] [Google Scholar]
- 6. Oda E, Ohki R, Murasawa H, et al. Noxa, a BH3-only member of the Bcl-2 family and candidate mediator of p53-induced apoptosis. Science. 2000;288(5468):1053–1058 [DOI] [PubMed] [Google Scholar]
- 7. Wade Harper J, Adami GR, Wei N, Keyomarsi K, Elledge SJ. The p21 Cdk-interacting protein Cip1 is a potent inhibitor of G1 cyclin-dependent kinases. Cell. 1993;75(4):805–816 [DOI] [PubMed] [Google Scholar]
- 8. Wu GS, Burns TF, McDonald ER, et al. KILLER/DR5 is a DNA damage-inducible p53-regulated death receptor gene. Nat Genet. 1997;17(2):141–143 [DOI] [PubMed] [Google Scholar]
- 9. Appella E, Anderson CW. Post-translational modifications and activation of p53 by genotoxic stresses. Eur J Biochem. 2001;268(10):2764–2772 [DOI] [PubMed] [Google Scholar]
- 10. Chuikov S, Kurash JK, Wilson JR, et al. Regulation of p53 activity through lysine methylation. Nature. 2004;432(7015):353–360 [DOI] [PubMed] [Google Scholar]
- 11. Gostissa M, Hengstermann A, Fogal V, et al. Activation of p53 by conjugation to the ubiquitin-like protein SUMO-1. EMBO J. 1999;18(22):6462–6471 [DOI] [PMC free article] [PubMed] [Google Scholar]
- 12. Gu W, Roeder RG. Activation of p53 Sequence-Specific DNA Binding by Acetylation of the p53 C-Terminal Domain. Cell. 1997;90(4):595–606 [DOI] [PubMed] [Google Scholar]
- 13. Luo J, Li M, Tang Y, et al. Acetylation of p53 augments its site-specific DNA binding both in vitro and in vivo. Proc Natl Acad Sci U S A. 2004;101(8):2259–2264 [DOI] [PMC free article] [PubMed] [Google Scholar]
- 14. Shieh S-Y, Ikeda M, Taya Y, Prives C. DNA Damage-induced phosphorylation of p53 alleviates inhibition by MDM2. Cell. 1997;91(3):325–334 [DOI] [PubMed] [Google Scholar]
- 15. Lu X. p53: a heavily dictated dictator of life and death. Curr Opin Genet Dev. 2005;15(1):27–33 [DOI] [PubMed] [Google Scholar]
- 16. Vousden KH, Lu X. Live or let die: the cell’s response to p53. Nat Rev Cancer. 2002;2(8):594–604 [DOI] [PubMed] [Google Scholar]
- 17. Aylon Y, Oren M. New plays in the p53 theater. Curr Opin Genet Dev. 2011;21(1):86–92 [DOI] [PMC free article] [PubMed] [Google Scholar]
- 18. Li H, Lakshmikanth T, Garofalo C, et al. Pharmacological activation of p53 triggers anticancer innate immune response through induction of ULBP2. Cell Cycle. 2011;10(19):3346–3358 [DOI] [PubMed] [Google Scholar]
- 19. Munoz-Fontela CS, Pazos M, Delgado I, et al. p53 serves as a host antiviral factor that enhances innate and adaptive immune responses to influenza A virus. J Immunol. 2011;187(12):6428–6436 [DOI] [PMC free article] [PubMed] [Google Scholar]
- 20. Vousden KH, Ryan KM. p53 and metabolism. Nat Rev Cancer. 2009;9(10):691–700 [DOI] [PubMed] [Google Scholar]
- 21. Marchini S, Broggini M, Sessa C, D’Incalci M. Development of distamycin-related DNA binding anticancer drugs. Expert Opin Investig Drugs. 2001;10(9):1703–1714 [DOI] [PubMed] [Google Scholar]
- 22. Nagase T, Seki N, Ishikawa K, et al. Prediction of the coding sequences of unidentified human genes. VI. The coding sequences of 80 new genes (KIAA0201-KIAA0280) deduced by analysis of cDNA clones from cell line KG-1 and brain. DNA Res. 1996;3(5):321–329 [DOI] [PubMed] [Google Scholar]
- 23. Rigatti MJ, Verma R, Belinsky GS, Rosenberg DW, Giardina C. Pharmacological inhibition of Mdm2 triggers growth arrest and promotes DNA breakage in mouse colon tumors and human colon cancer cells. Mol Carcinog. 2012;51(5):363–378 [DOI] [PMC free article] [PubMed] [Google Scholar]
- 24. Heintz AP, Odicino F, Maisonneuve P, et al. Carcinoma of the ovary. FIGO 26th annual report on the results of treatment in gynecological cancer. Int J Gynaecol Obstet. 2006;95(Suppl 1):S161–S192 [DOI] [PubMed] [Google Scholar]
- 25. Sah VP, Attardi LD, Mulligan GJ, et al. A subset of p53-deficient embryos exhibit exencephaly. Nat Genet. 1995;10(2):175–180 [DOI] [PubMed] [Google Scholar]
- 26. Lang GA, Iwakuma T, Suh YA, et al. Gain of function of a p53 hot spot mutation in a mouse model of Li-Fraumeni syndrome. Cell. 2004;119(6):861–872 [DOI] [PubMed] [Google Scholar]
- 27. Burbee DG, Forgacs E, Zöchbauer-Müller S, et al. Epigenetic inactivation of RASSF1A in lung and breast cancers and malignant phenotype suppression. J Natl Cancer Inst. 2001;93(9):691–699 [DOI] [PMC free article] [PubMed] [Google Scholar]
- 28. Kodach LL, Jacobs RJ, Heijmans J, et al. The role of EZH2 and DNA methylation in the silencing of the tumour suppressor RUNX3 in colorectal cancer. Carcinogenesis. 2010;31(9):1567–1575 [DOI] [PMC free article] [PubMed] [Google Scholar]
- 29. Shiohara M, el-Deiry WS, Wada M, et al. Absence of WAF1 mutations in a variety of human malignancies. Blood. 1994;84(11):3781–3784 [PubMed] [Google Scholar]
- 30. Wang Y, Dai DL, Martinka M, Li G. Prognostic significance of nuclear ING3 expression in human cutaneous melanoma. Clin Cancer Res. 2007;13(14):4111–4116 [DOI] [PubMed] [Google Scholar]
- 31. Huang C-J, Yang S-H, Huang S-M, et al. A predicted protein, KIAA0247, is a cell cycle modulator in colorectal cancer cells under 5-FU treatment. J Transl Med. 2011;9(1):82. [DOI] [PMC free article] [PubMed] [Google Scholar]
- 32. Deng C, Zhang P, Harper JW, Elledge SJ, Leder P. Mice lacking p21CIP1/WAF1 undergo normal development, but are defective in G1 checkpoint control. Cell. 1995;82(4):675–684 [DOI] [PubMed] [Google Scholar]
- 33. Flores ER, Sengupta S, Miller JB, et al. Tumor predisposition in mice mutant for p63 and p73: evidence for broader tumor suppressor functions for the p53 family. Cancer Cell. 2005;7(4):363–373 [DOI] [PubMed] [Google Scholar]
- 34. Schwanzer-Pfeiffer D, Roßmanith E, Schildberger A, Falkenhagen D. Characterization of SVEP1, KIAA, and SRPX2 in an in vitro cell culture model of endotoxemia. Cell Immunol. 2010;263(1):65–70 [DOI] [PubMed] [Google Scholar]
- 35. Staib F, Robles AI, Varticovski L, et al. The p53 tumor suppressor network is a key responder to microenvironmental components of chronic inflammatory stress. Cancer Res. 2005;65(22):10255–10264 [DOI] [PMC free article] [PubMed] [Google Scholar]


