

Summary
Skin pigment pattern formation in zebrafish requires pigment-cell autonomous interactions between melanophores and xanthophores, yet the molecular bases for these interactions remain largely unknown. Here, we examined the dali mutant that exhibits stripes in which melanophores are intermingled abnormally with xanthophores. By in vitro cell culture, we found that melanophores of dali mutants have a defect in motility and that interactions between melanophores and xanthophores are defective as well. Positional cloning and rescue identified dali as tetraspanin 3c (tspan3c), encoding a transmembrane scaffolding protein expressed by melanophores and xanthophores. We further showed that dali mutant Tspan3c expressed in HeLa cell exhibits a defect in N-glycosylation and is retained inappropriately in the endoplasmic reticulum. Our results are the first to identify roles for a tetraspanin superfamily protein in skin pigment pattern formation and suggest new mechanisms for the establishment and maintenance of zebrafish stripe boundaries.
Keywords: Zebrafish, Stripe pattern, Tetraspanin, melanophore, xanthophore
Introduction
Animals exhibit a variety of striking and colorful pigment patterns that are appealing not only for their aesthetics but also for the fundamental questions they raise about the diversification and generation of form. A useful model organism in which to address these issues is the zebrafish, which has a distinctive and stereotyped adult pigment pattern of several dark stripes that alternate with light interstripes. Stripes comprise black melanophores and iridescent iridophores, whereas interstripes comprise yellow–orange xanthophores and iridophores; all of these cell types arise from latent precursors of neural crest origin during the larval-to-adult transformation (Johnson et al., 1995; Parichy and Turner, 2003b).
The development of zebrafish stripes and interstripes involves dynamic and reciprocal interactions amongst pigment cell classes. During early stages of adult pigment pattern development, iridophores develop in the prospective interstripe region and contribute to specifying the development of xanthophores at this site, as well as the localization of melanophores further dorsally and ventrally (Frohnhofer et al., 2013; Parichy, 2009; Patterson and Parichy, 2013). Short and long-range interactions between melanophores and xanthophores are then essential for establishing and maintaining boundaries between stripes and interstripes (Maderspacher and Nusslein-Volhard, 2003; Parichy and Turner, 2003a; Yamaguchi et al., 2007). Remarkably, these interactions conform to the expectations of reaction–diffusion models of pattern formation (Kondo and Asai, 1995; Kondo and Shirota, 2009; Miyazawa et al., 2010; Nakamasu et al., 2009) that rely on mechanisms of local activation and long-range inhibition (Turing, 1952); such patterning systems may be widespread in animal development (Jung et al., 1998; Miura et al., 2009; Miura and Shiota, 2000; Nakamura et al., 2006; Sheth et al., 2012). These pigment cell-autonomous interactions are capable of generating a wide variety of patterns, and changes in these interactions may have contributed to the diversification of patterns among species (Miyazawa et al., 2010; Quigley et al., 2005; Watanabe and Kondo, 2012).
The molecular mechanisms of pigment cell development and pattern formation are beginning to be elucidated, and several genes have been identified for their requirements in the development of particular pigment cell lineages (Budi et al., 2008; Krauss et al., 2013; Lister et al., 1999; Lopes et al., 2008; Minchin and Hughes, 2008; Parichy et al., 2000a; Parichy et al., 2000b; Parichy et al., 1999) or for the acquisition of cell-type specific pigments (Dooley et al., 2013; Kelsh et al., 2000; Le Guyader et al., 2005; Ziegler, 2003). By contrast, phenotypes of several zebrafish mutants identify genes required for pattern formation itself. For example, mutations in connexin 41.8 (cx41.8) and igsf11 result in the development of spots rather than stripes in leopard and seurat mutants, respectively (Eom et al., 2012; Watanabe et al., 2006; Watanabe and Kondo, 2012). A qualitatively different pattern phenotype is found in jaguar mutants with mutations in potassium inwardly-rectifying channel, subfamily J, member 13 (kcnj13; previously, kir7.1), in which melanophores and xanthophores are no longer confined to stripes and interstripes but are instead intermingled with one another in stripes that are abnormally broad, demonstrating a requirement for kcnj13 in the development of stripe–interstripe boundaries (Iwashita et al., 2006; Maderspacher and Nusslein-Volhard, 2003). More recently, a role has been found for Kcnj13 in mediating melanophore–xanthophore interactions in vitro. When melanophores and xanthophores are placed adjacent to one another, melanophores migrate away and xanthophores follow. This “escape behavior” of melanophores was preceded by a change in their membrane potential following contact by xanthophores. Melanophores derived from jaguar mutants, however, were constantly depolarized and failed to retreat from xanthophores, indicating that Kcnj13 sets the resting membrane potential of melanophores (Inaba et al., 2012) and suggesting that loss of this repulsive interaction in jaguar mutants contributes to a failure of sorting-out in vivo.
In this study, we analyzed the dali mutant, which shows a phenotype similar to that of jaguar, namely, broad stripes consisting of xanthophores as well as melanophores. We show that dali promotes melanophore motility and is essential for melanophore–xanthophore interactions in vitro, similar to Kcnj13, yet is not required for melanophore depolarization. We further show that dali encodes Tetraspanin 3c, a member of the tetraspanin superfamily (Hemler, 2003; Hemler, 2005; Zoller, 2009) expressed by melanophores and xanthophores. Tetraspanins act as scaffolds to anchor proteins at cell and organelle membranes (Baldwin et al., 2008; Kobayashi et al., 2000; Xu et al., 2004) within tetraspanin-enriched microdomains, and contribute to cell adhesion (Shigeta et al., 2003; Spring et al., 2013), migration (Baldwin et al., 2008; Liu et al., 2007), proliferation (Tiwari-Woodruff et al., 2001), and cell–cell fusion (Chen et al., 1999; Tachibana and Hemler, 1999). We show that intermingled melanophores and xanthophores in the dali mutant result from a missense substitution in the first transmembrane domain of Tspan3c that leads to abnormal endoplasmic reticulum (ER) retention and incomplete N-glycosylation. These are the first data to implicate a tetraspanin in pigment pattern formation and suggest novel mechanisms underlying the melanophore–xanthophore interactions and the development of boundaries during zebrafish adult stripe development.
Results
dali promotes boundary formation between melanophores and xanthophores
In wild-type zebrafish, melanophores and xanthophores are found in stripes and interstripes, respectively (Figure 1A). To identify genes underlying the formation of this pattern, we undertook a forward genetic screen for ENU-induced mutant phenotypes having defects in stripe–interstripe boundaries. One such mutant is dali, which exhibits distinct heterozygous and homozygous phenotypes. Heterozygotes exhibit broken stripes and retain clear boundaries between melanophores and xanthophores (Figure 1B). Homozygotes, however, have fewer, broader stripes that contain not only melanophores but intermingled xanthophores as well (Figure 1C). The defect in stripe number and width is evident by the juvenile stage and the intermingled pigment cells phenotype is apparent in the adult (data not shown). All experiments described below used pigment cells isolated from homozygous mutants. Thus, dali is essential for the development of stripes and the segregation of melanophores and xanthophores into discrete spatial domains. These phenotypes are strikingly similar to those of mutants for jaguar, encoding Kcnj13 (Figure 1D, 1E), raising the possibility that dali and jaguar might affect some of the same processes.
Figure 1.
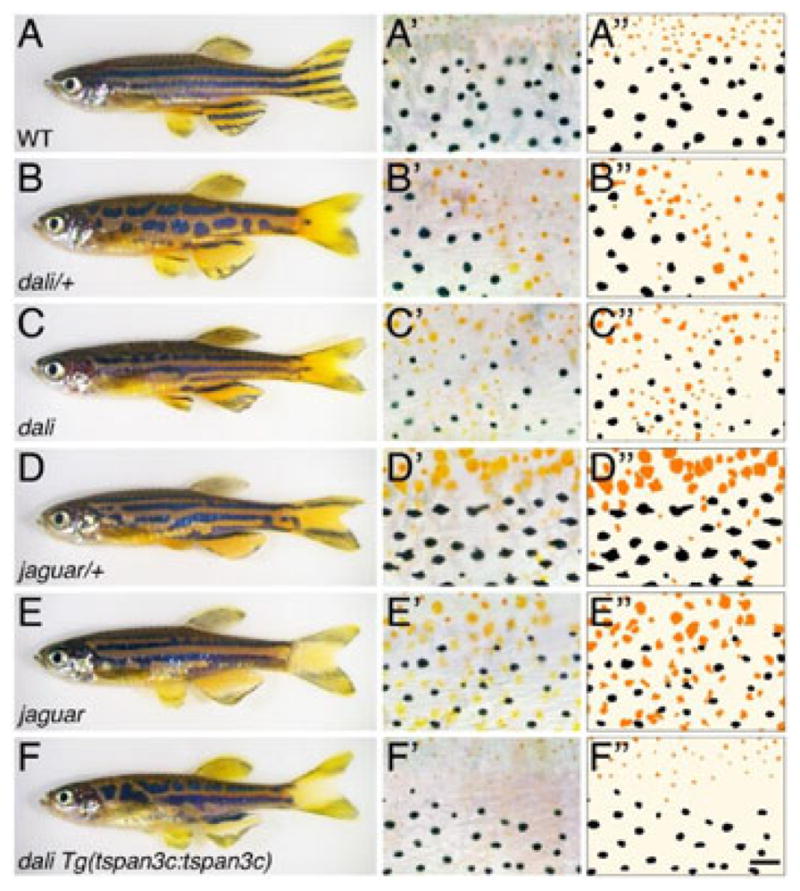
Adult pigment patterns of wild-type, dali and jaguar mutants. (A) Wild-type. (B,C) Heterozygous and homozygous dali mutants. (D,E) Heterozygous and homozygous jaguarb230 mutants. (F) Partial rescue of dali mutant phenotype by Tspan3c expression (see text for details). (A′–F′) Magnified images of middle region between dorsal and anal fins of trunk showing encroachment of xanthophores into melanophore domains in mutants homozygous for dali and jaguar (C′,E′); heterozygous mutants (B′,D′) as well as homozygous dali mutants expressing Tspan3c (F′) have disrupted patterns but little or no intermingling of melanophores and xanthophores. (A″–F″) Corresponding tracings illustrating distributions xanthophores (orange) and melanophores. Scale bar: in (F″), 60 μm for (A′–F′).
dali promotes melanophore migration
Stripe development and regeneration involve the directional migration of melanophores (Parichy et al., 2000b; Parichy and Turner, 2003b). To test if dali promotes melanophore migration, we assessed the motility of pigment cells in vitro over 24 hours (Eom et al., 2012). These analyses revealed that total distances migrated by melanophores isolated from dali mutants were half those of melanophores from wild-type fish (Figure 2A, 2B, 2E-left). Net (rectilinear) displacements of dali mutant melanophores were, likewise, only a quarter those of wild-type melanophores (Figure 2E-right; Supplementary Videos S1, S2). In contrast to melanophores, isolated xanthophores migrated little in vitro (but see below) and we failed to detect differences between wild-type and dali mutant backgrounds (Figure 2C–E; Supplementary Videos S2, S3).
Figure 2.

dali mutant melanophores have a motility defect in vitro. (A,B,E) Distances migrated by wild-type melanophores (n=10) and dali mutant melanophores (n=10) revealed significantly reduced motility of the latter (*p<0.01). (C,D,E) Distances migrated by wild-type xanthophores (n=10) and dali mutant xanthophores (n=6) were not significantly different between genotypes. Data were collected from two or more independent experiments.
dali-dependent interactions between melanophores and xanthophores
Repulsive interactions between melanophores and xanthophores play critical roles in organizing and maintaining stripes and interstripes (Inaba et al., 2012; Maderspacher and Nusslein-Volhard, 2003; Nakamasu et al., 2009; Parichy et al., 2000b; Parichy and Turner, 2003a; Yamaguchi et al., 2007). We asked whether such interactions might be defective in dali mutants by placing adult melanophores and xanthophores in close proximity to one another in vitro. We assessed resulting interactions both by time-lapse imaging and by measuring the migration distances of melanophores during successive time intervals during the 4 hours after each melanophore was first contacted by a xanthophore. To measure both repulsive and attractive behavior of melanophores relative to xanthophores, we used only x-axis values of melanophore migration (Figure 3E). Changes in distance that are positive would indicate a repulsive interaction (red double-headed arrow) in which the melanophore “escapes” from the xanthophore (which might give “chase”); changes in distance that are negative (i.e., if the melanophore moves even closer to the xanthophore) would reflect an attractive interaction (blue double-headed arrow). Measured as displacements along just a single axis, these values indicate directionality but will tend to underestimate total distances migrated. In pairs of wild-type cells, melanophores contacted by xanthophores migrated away and the xanthophores followed, with increasing distances between cell centroids (i.e., melanophores “escaped” despite being “chased” (Supplementary Video S3 and Figure 3A, 3F)), consistent with a repulsive effect of xanthophores on melanophores and with previous observations (Inaba et al., 2012). In contrast, dali mutant melanophores and xanthophores failed to migrate and remained in close contact with one another (Supplementary Video S4 and Figure 3B, 3F).
Figure 3.

Pigment cells from dali mutant have defects in cell–cell interactions. (A) Contact between wild-type melanophores and wild-type xanthophores results in movement away by the melanophore, and following by the xanthophore (10 of 11 pairs tested). (B) Contact between dali mutant melanophores and xanthophores did not result in such behaviors (7 of 7 pairs). (C) Wild-type xanthophores failed to elicit escape responses by dali mutant melanophores (7 of 7 pairs). (D) Likewise, dali mutant xanthophores failed to elicit escape responses by wild-type melanophores (13 of 15 pairs). Scale bar: 50 μm. (E) Indicator of repulsive activity of melanophores. X-axis values of melanophore migrations (double-headed arrows) were used to evaluate repulsive (red arrow) or attractive (blue arrow) activities. (F) Significant differences in escape behavior were detected between WT pairs and all others (*p<0.01). Data were collected from two or more independent experiments.
To determine the cellular bases for the lack of responsiveness by dali mutant pigment cells, we generated reciprocal melanophore–xanthophore pairings of wild-type and mutant cells. In these experiments, wild-type xanthophores failed to stimulate the migration of dali mutant melanophores, whereas dali mutant xanthophores failed to stimulate the migration of wild-type melanophores (Supplementary Videos S5, S6; Figure 3C, 3D, 3F). These results indicate that dali acts within melanophores to promote their responsiveness to xanthophores, and also acts within xanthophores to promote their repulsive effects on melanophores. Time-lapse videos of reciprocal pairings also revealed a more subtle difference in cell behaviors. After being contacted by wild-type xanthophores, dali mutant melanophores retracted somewhat, as evidenced by their strongly asymmetrical shapes, although they failed to “escape”, apparently owing to a defect in directional migration (Supplementary Video S5). By contrast, after being contacted by dali mutant xanthophores, wild-type melanophores exhibited neither retraction nor directional escape behaviors (Supplementary Video S6). These observations raise the possibility that Tspan3c has different functions in melanophores and xanthophores.
Finally, because a normal resting membrane potential is required for melanophores to depolarize in response to contacts with xanthophores, we compared the resting membrane potential of dali mutant melanophore to wild-type melanophores. In contrast to the defective membrane potential of jaguar/kncj13 mutants (Inaba et al., 2012), we found no differences in membrane potential between melanophores of wild-type and dali mutants (Supplementary Figure S1).
dali encodes Tetraspanin 3c
To identify the gene responsible for the dali phenotype, we mapped the mutant to chromosome 8 between microsatellites z27391 (30.13 Mb) and z11237 (30.99 Mb) using 257 F2 individuals (Figure 4A). Comparisons of wild-type and mutant open reading frames for all 15 genes within this critical interval revealed a non-synonymous substitution (I18R) in zgc:100919 that segregates with the dali mutant phenotype. zgc:100919 encodes a vertebrate transmembrane 4 superfamily-like protein (tetraspanin; NP_001002748) most closely related to Tetraspanin 3 (Figure 4B; Supplementary Figure S2A). Because teleosts have three tetraspanin 3 genes, and tetraspanin 3a and 3b have been annotated in the Ensembl database already, we designated the dali gene tetraspanin 3c (tspan3c). Tspan3c is predicted to have four transmembrane domains, one intracellular loop and two extracellular loops; the I18R substitution occurs in the first transmembrane domain (Figure 4C; Supplementary Figure S2B).
Figure 4.

dali maps to zgc:100919 encoding Tetraspanin 3c. (A) Meiotic mapping of the dali mutant revealed an 860 kb critical genetic interval containing 15 open reading frames (blue bars), of which only the gene-encoding vertebrate transmembrane 4 superfamily-like (tetraspanin 3c; abbreviated as tspan3c, accession number; NP_001002748) exhibited an ENU-induced lesion (yellow bar) (B) Orthology of zebrafish and other vertebrate Tspan3 proteins. Tspan7, the closest homologous protein to Tspan3, was used as the out group. (C) A schematic of the Tspan3c protein showing the dali mutant I18R substitution in the first transmembrane domain.
To confirm the correspondence of dali and tspan3c, we tested if wild-type Tspan3c can rescue the dali mutant phenotype. We cloned a 4.5 kb fragment upstream of the Tspan3c start codon and used it to drive expression of wild-type Tspan3c cDNA in a stable transgenic line, Tg(tspan3c:tspan3c), constructed in the dali mutant background. Transgenic, homozygous dali mutants exhibited markedly improved boundaries between melanophores and xanthophores in comparison to non-transgenic dali mutants (Figure 1C vs. 1F); persisting stripe breaks in rescued fish, similar to heterozygous dali mutants (Figure 1B), presumably reflect the relative dosage of wild-type and mutant alleles. These results demonstrated that dali encodes Tspan3c.
tspan3c is expressed in melanophores, xanthophores and other tissues
To examine the expression of tspan3c and other tetraspanin 3 genes, we performed RT-PCR on mRNAs isolated from several adult tissues (Figure 5A). tspan3a and tspan3c were expressed in all of the tissues examined, whereas tspan3b was expressed only in a subset of tissues. To assess expression in melanophores and xanthophores, we enriched for these cell types by differential gradient centrifugation of dissociated adult fins and assayed transcript abundance by RT-PCR (Figure 5B). tspan3c mRNA was abundant in both melanophores and xanthophores, whereas tspan3a was only weakly expressed and tspan3b transcripts were not detectable. In parallel, we examined activity of a 4.5 kb tspan3c promoter in wild-type fish transgenic for a Tspan3c-EGFP fusion protein [Tg(tspan3c:tspan3c(WT)-EGFP)]. Frozen sections of adult fish revealed EGFP expression in both melanophores and xanthophores (Figure 5C blue arrows and yellow arrows, respectively), consistent with Tspan3c activities in both of these cell types. We note that Tspan3c-EGFP fusion protein is functional because the fusion protein also rescued dali phenotype (Supplementary Figure S3) as shown in the rescue experiment in Figure 1F.
Figure 5.
tspan3c expression by adult melanophores, xanthophores and whole tissues. (A,B) RT-PCR for zebrafish tetraspanin 3 paralogues for tissues as well as populations of isolated melanophores (M) and xanthophores (X). dct (dopachrome tautomerase) is a marker of melanophores (Kelsh et al., 2000), whereas aox3 (aldehyde oxidase 3) is a marker of xanthophores (Parichy et al., 2000b). (C) EGFP signals driven by the tspan3c promoter were detected in adult melanophores (blue arrows) and adult xanthophores (yellow arrows). Right image shows higher magnification view of boxed region in middle.
We also examined promoter activity using Tg(tspan3c:EGFP) fish, in which the EGFP signal was stronger than that of the Tspan3c-EGFP fusion protein in Tg(tspan3c:tspan3c-EGFP) fish. We observed EGFP expression in xanthophores (Supplementary Figure S4), and this signal was easily distinguishable from xanthophore autofluorescence (Supplemental figure S4; see also Methods). In addition, we detected EGFP expression in iridophores when pigment cells from Tg(tspan3c:EGFP) fish were cultured (Supplementary Figure S5), suggesting the possibility of tspan3c expression in this lineage as well.
I18R mutation causes Tspan3c retention in endoplasmic reticulum and incomplete N-glycosylation
To better understand the consequences of the I18R mutation for Tspan3c function, we compared the localization of wild-type and mutant Tspan3c-EGFP fusion proteins in HeLa cells. Because mutations in transmembrane domains can cause retention of tetraspanins within the endoplasmic reticulum (ER) (Tu et al., 2006), we compared Tspan3c-EGFP localization relative to markers of ER (Figure 6A) and Golgi apparatus (Figure 6B) that are DsRed proteins fused with ER and Golgi retention sequences, respectively (see Methods). Tspan3c(WT)-EGFP was localized predominantly to Golgi apparatus (Figure 6B; 7 of 7 cells) and partially to ER (Figure 6A; 9 of 9 cells) as early as 24 hours after transfection and Golgi localization was enhanced after 48 hours (Figure 6B; 10 of 10 cells). By contrast, Tspan3c(I18R)-EGFP was localized almost entirely to ER at 24 hours after transfection (Figure 6A; 12 of 12 cells) and exhibited pronounced Golgi localization only after 48 hours (Figure 6B; 8 of 9 cells). Although the Golgi marker was weakly detectable in intracellular spaces, perhaps owing to partial mislocalization of the marker protein, our observations nevertheless support the idea that the I18R mutation retards Tspan3c translocation from the ER to the Golgi apparatus. Similar subcellular localizations of Tspan3c (WT or I18R) were detected when we performed the same experiments using mouse B16 melanoma cells (Supplementary Figure S6).
Figure 6.

Tspan3c(I18R) is retained within the ER. Tspan3c(WT or I18R)-EGFP fusion proteins were expressed in HeLa cells and their localization was examined using marker for ER (A) and Golgi apparatus (B) after 24 h and 48 h. Scale bar: 10 μm. Arrowheads indicate marked localization of the Tspan3c protein (see text). Trials were conducted in duplicate.
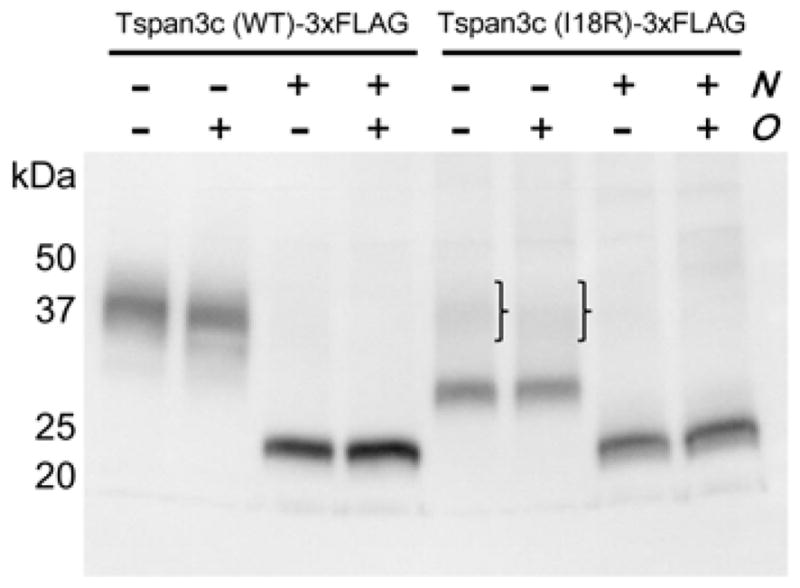
Next, to see if defective trafficking is accompanied by defects in Tspan3c maturation, we analyzed the consequences of I18R mutation for N-linked and O-linked glycosylation (Yamamoto et al., 2005). To this end, we expressed Tspan3c-3×FLAG fusion proteins in HeLa cells, then treated cellular lysates with N-glycosidase, O-glycosidase, or both, and compared protein mobilities by Western blot using an anti-FLAG monoclonal antibody (Figure 7). Tspan3c(WT)-3×FLAG was detected between 30–50 kDa and resolved to a fragment of the predicted, 27 kDa size upon treatment with N-glycosidase, demonstrating N-linked glycosylation of the wild-type protein. By contrast, most Tspan3c(I18R)-3×FLAG protein was detected at ~30 kDa, indicating incomplete N-glycosylation of the mutant form. No change in banding patterns was detected following treatment with O-glycosidase.
Figure 7.

Reduced N-glycosylation of Tspan3c(I18R). Western blot showing Tspan3c(WT or I18R)-3×FLAG tagged proteins expressed in HeLa cells following treatment with N-glycosidase (N), O-glycosidase (O), or both. In comparison to Tspan3c(WT), relatively little N-glycosylation was evident for Tspan3c(I18R) (brackets). Trials were conducted in triplicate.
Discussion
In this study, we found that melanophores of dali mutants have impaired motility and that both melanophores and xanthophores exhibit defects in heterotypic interactions in vitro. We further demonstrated that dali corresponds to tetraspanin 3c, and that dali mutants have a missense substitution that causes ER-retention and incomplete glycosylation of Tspan3c protein. Ours are the first data to implicate a tetraspanin in pigment pattern formation.
Tetraspanin superfamily proteins typically anchor other membrane proteins at cell and organelle membranes, and thereby regulate adhesion, migration, proliferation and cell–cell fusion (Baldwin et al., 2008; Chen et al., 1999; Liu et al., 2007; Shigeta et al., 2003; Spring et al., 2013; Tachibana and Hemler, 1999; Tiwari-Woodruff et al., 2001). In human melanocytes, tetraspanin CD63 participates in endosomal sorting during melanogenesis (van Niel et al., 2011) whereas tetraspanins CD9 and CD151 localize at the tips of dendrites and at sites of homotypic intercellular contacts, and their knockdown enhances motility (Garcia-Lopez et al., 2005). In melanoma cells, CD9 expression is reduced compared to normal melanocytes (Fan et al., 2010), yet TSPAN8 expression is associated with enhanced invasiveness (Berthier-Vergnes et al., 2011). These various functions in melanized and other cells illustrate the diversity of tetraspanin activities.
We can envision several ways in which zebrafish Tspan3c promotes stripe patterning. For example, tetraspanins often interact with integrins, and mouse TSPAN3 forms a protein complex with ITGB1 (integrin β1) that promotes oligodendrocyte motility (Tiwari-Woodruff et al., 2001; Tiwari-Woodruff et al., 2004). Likewise, human CD151 (TSPAN24) promotes motility by modulating integrin internalization by endocytosis, trafficking or both (Liu et al., 2007), and also promotes integrin glycosylation in the Golgi apparatus (Baldwin et al., 2008). Indeed, a role for endocytic regulation of zebrafish Tspan3c and associated proteins is suggested by the presence in the C-terminal cytoplasmic region of a YQPL sequence, corresponding to a canonical YXXϕ motif recognized by the adaptor protein 2 complex during endocytosis (Aguilar et al., 2001; Boehm and Bonifacino, 2001). In contrast to roles for Tetraspanin–Integrin interactions, complexes between Tetraspanins and IgSF (Shoham et al., 2006; Stipp et al., 2003), MT1-MMP (Takino et al., 2003), BLI-3 (Moribe et al., 2012; Moribe et al., 2004), and EGFR (Odintsova et al., 2000) also have been shown. Distinguishing among these and other hypotheses for Tspan3c activity, and identifying interaction partners in vivo, will require further analyses and the generation of new mutants as well as transgenic lines.
As described above, jaguar mutants exhibit the same intermingled arrangement of melanophores and xanthophores as does the dali mutant. Kcnj13 sets the resting membrane potential of melanophores, and membrane depolarization is an important feature of the melanophore response to xanthophore contact. Despite the phenotypic similarity of jaguar and dali mutants both in vivo and in vitro, we found that dali mutant melanophores exhibited normal resting membrane potentials. These findings suggest that Tspan3c may act independently of Kcnj13 in promoting repulsive effects of xanthophores on melanophores. Whether Tspan3c functions in melanophores are similar to its functions in xanthophores remains to be determined. Reciprocal pairing experiments (Figure 3C, 3D, Supplementary Videos S5, S6) raise the possibility that Tspan3c is required in melanophores for promoting directional migration in response to contact by xanthophores, but is required within xanthophores to stimulate melanophores. In this regard, xanthophores make direct contact with melanophores using filopodia, which trigger the melanophore “escape response”. Some tetraspanin family members initiate filopodial (Bassani et al., 2012; Shigeta et al., 2003) and nanopodial (Zukauskas et al., 2011) formation. Besides these cell types, iridophores also have important functions during zebrafish stripe development (Frohnhofer et al., 2013; Patterson and Parichy, 2013). We found that iridophores express a 4.5 kb tspan3c promoter element in vitro, which may reflect tspan3c expression in this lineage in vivo. Our on-going investigations of Tspan3c should provide new insights into its functional requirements in each of these pigment cell classes.
Finally, our study also provides insights into the trafficking and post-translational modification of tetraspanins. In bovine UPK1B (TSPAN20), the integrity of all four transmembrane domains is required for translocation from the ER to the cell surface (Tu et al., 2006), suggesting the necessity for a tightly packed helix bundle in the translocation of this protein. Similarly, the I18R substitution of dali mutant Tspan3c occurs in a transmembrane domain and we observed retention of mutant protein in the ER. Finally, previous studies have shown that tetraspanins are glycosylated in vivo. N-glycosylation can contribute to regulating tetraspanin interactions (Baldwin et al., 2008; Hemler, 2005), and is, in general, important for protein stability, folding, dimerization, and trafficking (Helenius and Aebi, 2001; Isaji et al., 2006; Kohno et al., 2002; Mitra et al., 2006; Xu et al., 2003), as well as ligand-binding (Ono et al., 2000). In fact, Tspan3c has three putative N-glycosylation sites (Supplementary Figure S2) and we found defects in glycosylation of dali mutant (I18R) Tspan3c, suggesting that if mutant Tspan3c is expressed at the cell/organelle membrane, its activity or perdurance may be impaired.
In this study, we determined that Tspan3c contributes to melanophore motility in vitro and also mediates interactions between melanophores and xanthophores. Further elucidation of Tspan3c function in vivo will provide novel insights into adult pigment pattern formation and will enable the assignment of molecular mechanisms to parameters described by Turing models of pattern formation.
Methods
Fish
All experiments in this study were conducted in accordance with guidelines and approved protocols for animal care and use at Osaka University, Japan and the University of Washington, USA. The daliwpr21e1 mutant allele was isolated in a forward genetic, early pressure screen for N-ethyl-N-nitrosourea (ENU) induced mutations in the ABwp genetic background.
Genetic mapping
The dali mutant was crossed with wild-type strains AB, Tübingen, and WIK in separate mapping panels. F1 heterozygous fish were intercrossed and F2 fish were used for genetic mapping with microsatellite markers. Candidate gene sequencing was performed using a 3130 Genetic analyzer (Applied Biosystems).
Collection of pigment cells
Pigment cells were isolated from fins of adult fish for RT-PCR analyses of gene expression (wild-type), in vitro motility and co-culture assays (wild-type, dali mutant), for reporter assay [Tg(tspan3c:EGFP)] and for analyses of membrane potential [hypopigmented goldenb1 (Lamason et al., 2005) and golden; dali double mutants]. Caudal and anal fins were collected from fish anesthetized with methyl methanesulfonate (MMS, Sigma). The fin clips were treated with trypsin solution (2.5 mg/ml trypsin (Worthington), 1.2 mg/ml BSA (Sigma) and 1 mM EDTA (Wako) in PBS) for 1 hour at 28°C. The trypsin solution was then removed, and the tissues were rinsed several times with PBS. Then, fin clips were incubated with collagenase solution (1 mg/ml collagenase I (Worthington), 0.1 mg/ml DNase I (Worthington), 0.1 mg/ml STI (Worthington), 1.2 mg/ml BSA, 100 μM epinephrine (Sigma) in PBS) for 1 hour at 28°C. For RT-PCR and in vitro culture experiments, pigment cells were purified by Percoll gradient centrifugation after filtration with 25 μm mesh (see below). For membrane potential assays and EGFP detection in iridophores, pigment cells were collected only by simple centrifugation without Percoll (see below).
Analyses of pigment cell movement and interaction in vitro
Filtered pigment cell suspensions were centrifuged, 30× g for 5 minutes at room temperature, and cell pellets were re-suspended with L15 medium (Sigma) containing 1% fetal bovine serum (FBS; Invitrogen). Pigment cells were then picked using glass capillaries under an Olympus IX81 microscope and placed on a 35 mm culture dish coated with collagen IV (BD Biosciences). To investigate the interactions between melanophores and xanthophores, individual cells of each type were placed adjacent to one another. After overnight incubation in L15 medium at 28°C, the culture medium was exchanged with fresh L15 medium containing 10% FBS and the pigment cells were then used in live imaging. Movies were recorded using a DP73 digital camera (Olympus) and Metamorph software (Molecular Devices) interfaced to an IX81 microscope. Data for pigment cells that survived more than 48 hours after the medium change were used for further analysis (Yamanaka and Kondo, submitted). To evaluate the motility, the tracks of melanophore centroids were plotted every one hour from 12 hours to 36 hours after the medium change, using ImageJ software (http://rsb.info.nih.gov/ij/). The rectilinear migration length was defined as the net distance between the 12-hour and the 36-hour time points. To compare the repulsive activity of melanophores against xanthophores, the different cell types were placed within 0–50 μm of one another and cell centroids were recorded every 4 hours after melanophores were first contacted by xanthophores. At each time point, the melanophore position was set at the origin and the xanthophore was set to the left of the melanophores on the x-axis (Figure 3E). After 4 hours, the distance of melanophore migration was plotted. To measure both repulsive and attractive behavior of melanophore against xanthophore, we used only x-axis value of melanophore migration for the evaluation. The repulsive activity was evaluated as the average distance of melanophores migration in 4 hours.
Transgenic fish
To confirm the correspondence of tspan3c and dali, we rescued the dali phenotype using the pTol2-tspan3c:tspan3c transposon plasmid. A 4.5 kb fragment upstream from the translation initiation codon of tspan3c and a complete open reading frame of tspan3c gene were amplified then cloned into the pT2AL200R150G plasmid (Urasaki et al., 2006). Plasmid (10 ng/μl) and transposase mRNA (25 ng/μl) were co-injected into fertilized eggs of dali homozygous fish at the single-cell stage. The effect of the transgene on skin pattern formation was determined at the F1 generation of the transgenic line. Integration of the transgene into the fish genome was verified by PCR amplification. To analyze activity of the tspan3c promoter, EGFP was inserted into the C-terminus of the tspan3c fragment in pTol2-tspan3c:tspan3c(WT or I18R), generating pTol2-tspan3c:tspan3c(WT or I18R)-EGFP reporter plasmid in which the linker fragment Gly-Gly-Gly-Gly-Gly-Gly-Leu was introduced between the tspan3c and EGFP fragments. pTol2-tspan3c:EGFP reporter plasmid was also produced to analyze promoter activity. These plasmids were injected into zebrafish eggs by the same method as above.
RT-PCR analysis of tspan3c expression
After anesthetizing fish with MMS, total RNA was obtained using the RNeasy Protect Mini Kit (Qiagen), which was applied to each organ (eye, brain, heart, skin, caudal fin, testis, and ovary) of zebrafish. cDNAs were synthesized using the SuperScript III CellsDirect cDNA Synthesis System (Invitrogen). Then, 4.4 ng of cDNA (RNA equivalent) obtained from each organ was used in PCR, to detect tspan3a-c expression. PCR amplifications were performed for 30 cycles for tspan3a-c, 27 cycles for β-actin at 95°C for 30 seconds, at 60°C for 30 seconds, and 72°C for 30 seconds.
To examine tspan3c expression in melanophores and xanthophores, each pigment cell type was purified (see above) then cDNAs prepared for RT-PCR. To assay for cross-contamination of melanophores and xanthophores, the expression of dct (a melanophore marker) (Kelsh et al., 2000) and aox3 (a xanthophore marker) (Parichy et al., 2000b) were also examined. PCR amplifications were performed for 32 cycles at 95°C for 30 seconds, at 60°C for 30 seconds, and at 72°C for 30 seconds. Primer sets were designed to span introns: 5′-ATGGGTCAGTGCGGGATTAC -3′ and 5′-CAAATACCAGCATAAGAATGATGAC -3′ for tspan3a, 5′-ATGGGACAATGTGGCGTGAT -3′ and 5′-GACCAGAAGCAGCACTGCAGA -3′ for tspan3b, 5′-GTGTTCGGCATCATCTACAGG -3′ and 5′-GTTGTCGATGGTGCCAGTGAG -3′ for tspan3c, 5′-ATCAGCCCGCGTTCACGGTT-3′ and 5′-ACACCGAGGTGTCCAGCTCTCC-3′ for dct, 5′-AGGGCATTGGAGAACCCCCAGT-3′ and 5′-ACACGTTGATGGCCCACGGT-3′ for aox3, and 5′-CGGTTTTGCTGGAGATGATG-3′ and 5′-CGTGCTCAATGGGGTATTTG-3′ for β-actin.
Tspan3c protein in HeLa cells and B16 melanoma cells
HeLa cells and B16 melanoma cells were maintained in DMEM medium (Sigma) that contained 10% FBS (Invitrogen). To generate pCMV-tspan3c(WT or I18R)-EGFP plasmids, cDNA fragment of tspan3c with an EGFP cassette were subcloned from the pTol2-tspan3c:tspan3c(WT or I18R)-EGFP plasmid, respectively. Marker plasmids for the ER and Golgi apparatus, pCS2-ER-DsRed2 and pCS2-DsRed-Monomer-Golgi were generated using pDsRed2-ER and pDsRed-Monomer-Golgi plasmids (Clontech), which were originally prepared for other purposes. These plasmids were introduced into HeLa cells and B16 melanoma cells using the GeneJuice Transfection Reagent (Merck Millipore). Protein localizations were observed 24 or 48 hours after transfection by using the IX71 microscope and FLUOVIEW FV300 (Olympus).
Western blotting
tspan3c(WT or I18R) was cloned into the pIRES2-AcGFP plasmid (Clontech), in which the 3×FLAG cording fragment was added to produce a Tspan3c-3×FLAG tagged protein. Then, 48 hours after transfection with the plasmid, transfectant cells were rinsed with PBS and lysed with chilled RIPA buffer [50 mM HEPES, pH 7.4, 150 mM NaCl, 2 mM EDTA, 1% TRITON X-100, 0.5% Sodium deoxycholate, 0.1% SDS, and 1× Complete Protease Inhibitor Cocktail Tablets (Roche)]. Cell lysates were centrifuged (17,000× g for 10 minutes at 4°C) and then treated with N-glycosidase (PNGaseF, NEB) and/or O-glycosidase mix (O-Glycosidase & Neuraminidase Bundle, NEB). Protein samples were resolved by SDS-PAGE, followed by Western blot analysis using Monoclonal Anti -FLAG M2 antibody (Sigma).
Analysis of membrane potential in melanophores
Membrane potentials were compared between wild-type and dali mutant melanophores using DiBAC4(3) (Inaba et al., 2012). Because melanin granules in melanophores prevent fluorescence detection, we crossed dali and golden mutants to generate dali; golden double homozygous mutants, in which melanophores lack melanin. Pigment cells were partially purified from the fin clips of the golden (positive control) and dali; golden double mutants (see above). Following centrifugation, the cell pellets were re-suspended with L15 medium and cultured on a 35 mm glass base dish. After overnight incubation at 28°C, the culture medium was changed to fresh L15 medium that contained 10% FBS and 200 nM DiBAC4(3) (Wako). After 30 minutes of incubation, the cells were photographed by using the IX71 microscope and FLUOVIEW FV300 (Olympus). The Mean Gray Value was analyzed by using the ImageJ as mean fluorescence intensity (MFI).
Phylogenetic analysis
A maximum-likelihood phylogeny for Tspan3-related proteins was constructed using MEGA software (Tamura et al., 2011).
Observation of EGFP fluorescence in pigment cells
EGFP signals in pigment cells in vivo, in vitro and on frozen section were analyzed using the BZ-8000 microscope (KEYENCE) with OP-66835 BZ filter GFP. For the in vitro observation, pigment cells were collected and cultured as the same way for the analysis of membrane potential in melanophores (see above). After overnight incubation at 28°C, the culture medium was changed to fresh L15 medium that contained 10% FBS and 100 μM epinephrine, and the cells were incubated for 1 hour.
Supplementary Material
Significance.
How animal pigment patterns form and evolve is an intriguing question. We are tackling this problem using the beautiful stripes of the zebrafish. We have shown that cell–cell interactions between pigment cells are important for stripe formation, yet the underlying molecular mechanisms have been elusive. In this study, we examined a pigment pattern mutant, dali, which exhibits intermingled, rather than segregated, melanophores and xanthophores. We identified dali as encoding Tetraspanin 3c, which anchors other proteins at the cell surface, in organelle membranes, or both. Our finding will improve our understanding of the molecular bases of skin pigment pattern formation.
Acknowledgments
We thank Prof. K. Kawakami at the National Institute of Genetics for providing the Tol2 plasmid and Prof. T. Kunisada at Gifu University for providing mouse B16 melanoma cell line. We also thank Ms. Jessica M. Turner for technical assistance and Drs. Dae Seok Eom and Hiroaki Yamanaka for helpful discussions. Supported by NIH R01 GM062182 and NIH R01 GM096906 to D.M.P., KAKENHI (23770247, 25111714) to M.W., and KAKENHI (22127003) and JST, CREST to S. K.
References
- Aguilar RC, Boehm M, Gorshkova I, Crouch RJ, Tomita K, Saito T, Ohno H, Bonifacino JS. Signal-binding specificity of the mu4 subunit of the adaptor protein complex AP-4. The Journal of biological chemistry. 2001;276:13145–52. doi: 10.1074/jbc.M010591200. [DOI] [PubMed] [Google Scholar]
- Baldwin G, Novitskaya V, Sadej R, Pochec E, Litynska A, Hartmann C, Williams J, Ashman L, Eble JA, Berditchevski F. Tetraspanin CD151 regulates glycosylation of (alpha)3(beta)1 integrin. The Journal of biological chemistry. 2008;283:35445–54. doi: 10.1074/jbc.M806394200. [DOI] [PubMed] [Google Scholar]
- Bassani S, Cingolani LA, Valnegri P, Folci A, Zapata J, Gianfelice A, Sala C, Goda Y, Passafaro M. The X-linked intellectual disability protein TSPAN7 regulates excitatory synapse development and AMPAR trafficking. Neuron. 2012;73:1143–58. doi: 10.1016/j.neuron.2012.01.021. [DOI] [PMC free article] [PubMed] [Google Scholar]
- Berthier-Vergnes O, Kharbili ME, De La Fouchardiere A, Pointecouteau T, Verrando P, Wierinckx A, Lachuer J, Le Naour F, Lamartine J. Gene expression profiles of human melanoma cells with different invasive potential reveal TSPAN8 as a novel mediator of invasion. British journal of cancer. 2011;104:155–65. doi: 10.1038/sj.bjc.6605994. [DOI] [PMC free article] [PubMed] [Google Scholar]
- Boehm M, Bonifacino JS. Adaptins: the final recount. Molecular biology of the cell. 2001;12:2907–20. doi: 10.1091/mbc.12.10.2907. [DOI] [PMC free article] [PubMed] [Google Scholar]
- Budi EH, Patterson LB, Parichy DM. Embryonic requirements for ErbB signaling in neural crest development and adult pigment pattern formation. Development. 2008;135:2603–14. doi: 10.1242/dev.019299. [DOI] [PMC free article] [PubMed] [Google Scholar]
- Chen MS, Tung KS, Coonrod SA, Takahashi Y, Bigler D, Chang A, Yamashita Y, Kincade PW, Herr JC, White JM. Role of the integrin-associated protein CD9 in binding between sperm ADAM 2 and the egg integrin alpha6beta1: implications for murine fertilization. Proceedings of the National Academy of Sciences of the United States of America. 1999;96:11830–5. doi: 10.1073/pnas.96.21.11830. [DOI] [PMC free article] [PubMed] [Google Scholar]
- Dooley CM, Schwarz H, Mueller KP, Mongera A, Konantz M, Neuhauss SC, Nusslein-Volhard C, Geisler R. Slc45a2 and V-ATPase are regulators of melanosomal pH homeostasis in zebrafish, providing a mechanism for human pigment evolution and disease. Pigment cell & melanoma research. 2013;26:205–17. doi: 10.1111/pcmr.12053. [DOI] [PubMed] [Google Scholar]
- Eom DS, Inoue S, Patterson LB, Gordon TN, Slingwine R, Kondo S, Watanabe M, Parichy DM. Melanophore migration and survival during zebrafish adult pigment stripe development require the immunoglobulin superfamily adhesion molecule Igsf11. PLoS genetics. 2012;8:e1002899. doi: 10.1371/journal.pgen.1002899. [DOI] [PMC free article] [PubMed] [Google Scholar]
- Fan J, Zhu GZ, Niles RM. Expression and function of CD9 in melanoma cells. Molecular carcinogenesis. 2010;49:85–93. doi: 10.1002/mc.20580. [DOI] [PMC free article] [PubMed] [Google Scholar]
- Frohnhofer HG, Krauss J, Maischein HM, Nusslein-Volhard C. Iridophores and their interactions with other chromatophores are required for stripe formation in zebrafish. Development. 2013;140:2997–3007. doi: 10.1242/dev.096719. [DOI] [PMC free article] [PubMed] [Google Scholar]
- Garcia-Lopez MA, Barreiro O, Garcia-Diez A, Sanchez-Madrid F, Penas PF. Role of tetraspanins CD9 and CD151 in primary melanocyte motility. The Journal of investigative dermatology. 2005;125:1001–9. doi: 10.1111/j.0022-202X.2005.23882.x. [DOI] [PubMed] [Google Scholar]
- Helenius A, Aebi M. Intracellular functions of N-linked glycans. Science. 2001;291:2364–9. doi: 10.1126/science.291.5512.2364. [DOI] [PubMed] [Google Scholar]
- Hemler ME. Tetraspanin proteins mediate cellular penetration, invasion, and fusion events and define a novel type of membrane microdomain. Annual review of cell and developmental biology. 2003;19:397–422. doi: 10.1146/annurev.cellbio.19.111301.153609. [DOI] [PubMed] [Google Scholar]
- Hemler ME. Tetraspanin functions and associated microdomains. Nature reviews Molecular cell biology. 2005;6:801–11. doi: 10.1038/nrm1736. [DOI] [PubMed] [Google Scholar]
- Inaba M, Yamanaka H, Kondo S. Pigment pattern formation by contact-dependent depolarization. Science. 2012;335:677. doi: 10.1126/science.1212821. [DOI] [PubMed] [Google Scholar]
- Isaji T, Sato Y, Zhao Y, Miyoshi E, Wada Y, Taniguchi N, Gu J. N-glycosylation of the beta-propeller domain of the integrin alpha5 subunit is essential for alpha5beta1 heterodimerization, expression on the cell surface, and its biological function. The Journal of biological chemistry. 2006;281:33258–67. doi: 10.1074/jbc.M607771200. [DOI] [PubMed] [Google Scholar]
- Iwashita M, Watanabe M, Ishii M, Chen T, Johnson SL, Kurachi Y, Okada N, Kondo S. Pigment pattern in jaguar/obelix zebrafish is caused by a Kir7.1 mutation: implications for the regulation of melanosome movement. PLoS genetics. 2006;2:e197. doi: 10.1371/journal.pgen.0020197. [DOI] [PMC free article] [PubMed] [Google Scholar]
- Johnson SL, Africa D, Walker C, Weston JA. Genetic control of adult pigment stripe development in zebrafish. Developmental biology. 1995;167:27–33. doi: 10.1006/dbio.1995.1004. [DOI] [PubMed] [Google Scholar]
- Jung HS, Francis-West PH, Widelitz RB, Jiang TX, Ting-Berreth S, Tickle C, Wolpert L, Chuong CM. Local inhibitory action of BMPs and their relationships with activators in feather formation: implications for periodic patterning. Developmental biology. 1998;196:11–23. doi: 10.1006/dbio.1998.8850. [DOI] [PubMed] [Google Scholar]
- Kelsh RN, Schmid B, Eisen JS. Genetic analysis of melanophore development in zebrafish embryos. Developmental biology. 2000;225:277–93. doi: 10.1006/dbio.2000.9840. [DOI] [PubMed] [Google Scholar]
- Kobayashi T, Vischer UM, Rosnoblet C, Lebrand C, Lindsay M, Parton RG, Kruithof EK, Gruenberg J. The tetraspanin CD63/lamp3 cycles between endocytic and secretory compartments in human endothelial cells. Molecular biology of the cell. 2000;11:1829–43. doi: 10.1091/mbc.11.5.1829. [DOI] [PMC free article] [PubMed] [Google Scholar]
- Kohno T, Wada A, Igarashi Y. N-glycans of sphingosine 1-phosphate receptor Edg-1 regulate ligand-induced receptor internalization. FASEB journal: official publication of the Federation of American Societies for Experimental Biology. 2002;16:983–92. doi: 10.1096/fj.01-0809com. [DOI] [PubMed] [Google Scholar]
- Kondo S, Asai R. A Reaction-Diffusion Wave on the Skin of the Marine Angelfish Pomacanthus. Nature. 1995;376:765–768. doi: 10.1038/376765a0. [DOI] [PubMed] [Google Scholar]
- Kondo S, Shirota H. Theoretical analysis of mechanisms that generate the pigmentation pattern of animals. Seminars in cell & developmental biology. 2009;20:82–9. doi: 10.1016/j.semcdb.2008.10.008. [DOI] [PubMed] [Google Scholar]
- Krauss J, Astrinides P, Frohnhofer HG, Walderich B, Nusslein-Volhard C. transparent, a gene affecting stripe formation in Zebrafish, encodes the mitochondrial protein Mpv17 that is required for iridophore survival. Biology open. 2013;2:703–10. doi: 10.1242/bio.20135132. [DOI] [PMC free article] [PubMed] [Google Scholar]
- Lamason RL, Mohideen MA, Mest JR, Wong AC, Norton HL, Aros MC, Jurynec MJ, Mao X, Humphreville VR, Humbert JE, et al. SLC24A5, a putative cation exchanger, affects pigmentation in zebrafish and humans. Science. 2005;310:1782–6. doi: 10.1126/science.1116238. [DOI] [PubMed] [Google Scholar]
- Le Guyader S, Maier J, Jesuthasan S. Esrom, an ortholog of PAM (protein associated with c-myc), regulates pteridine synthesis in the zebrafish. Developmental biology. 2005;277:378–86. doi: 10.1016/j.ydbio.2004.09.029. [DOI] [PubMed] [Google Scholar]
- Lister JA, Robertson CP, Lepage T, Johnson SL, Raible DW. nacre encodes a zebrafish microphthalmia-related protein that regulates neural-crest-derived pigment cell fate. Development. 1999;126:3757–67. doi: 10.1242/dev.126.17.3757. [DOI] [PubMed] [Google Scholar]
- Liu L, He B, Liu WM, Zhou D, Cox JV, Zhang XA. Tetraspanin CD151 promotes cell migration by regulating integrin trafficking. The Journal of biological chemistry. 2007;282:31631–42. doi: 10.1074/jbc.M701165200. [DOI] [PubMed] [Google Scholar]
- Lopes SS, Yang X, Muller J, Carney TJ, Mcadow AR, Rauch GJ, Jacoby AS, Hurst LD, Delfino-Machin M, Haffter P, et al. Leukocyte tyrosine kinase functions in pigment cell development. PLoS genetics. 2008;4:e1000026. doi: 10.1371/journal.pgen.1000026. [DOI] [PMC free article] [PubMed] [Google Scholar]
- Maderspacher F, Nusslein-Volhard C. Formation of the adult pigment pattern in zebrafish requires leopard and obelix dependent cell interactions. Development. 2003;130:3447–57. doi: 10.1242/dev.00519. [DOI] [PubMed] [Google Scholar]
- Minchin JE, Hughes SM. Sequential actions of Pax3 and Pax7 drive xanthophore development in zebrafish neural crest. Developmental biology. 2008;317:508–22. doi: 10.1016/j.ydbio.2008.02.058. [DOI] [PMC free article] [PubMed] [Google Scholar]
- Mitra N, Sinha S, Ramya TN, Surolia A. N-linked oligosaccharides as outfitters for glycoprotein folding, form and function. Trends in biochemical sciences. 2006;31:156–63. doi: 10.1016/j.tibs.2006.01.003. [DOI] [PubMed] [Google Scholar]
- Miura T, Hartmann D, Kinboshi M, Komada M, Ishibashi M, Shiota K. The cyst-branch difference in developing chick lung results from a different morphogen diffusion coefficient. Mechanisms of development. 2009;126:160–72. doi: 10.1016/j.mod.2008.11.006. [DOI] [PubMed] [Google Scholar]
- Miura T, Shiota K. TGFbeta2 acts as an “activator” molecule in reaction-diffusion model and is involved in cell sorting phenomenon in mouse limb micromass culture. Developmental dynamics: an official publication of the American Association of Anatomists. 2000;217:241–9. doi: 10.1002/(SICI)1097-0177(200003)217:3<241::AID-DVDY2>3.0.CO;2-K. [DOI] [PubMed] [Google Scholar]
- Miyazawa S, Okamoto M, Kondo S. Blending of animal colour patterns by hybridization. Nature communications. 2010;1:66. doi: 10.1038/ncomms1071. [DOI] [PMC free article] [PubMed] [Google Scholar]
- Moribe H, Konakawa R, Koga D, Ushiki T, Nakamura K, Mekada E. Tetraspanin is required for generation of reactive oxygen species by the dual oxidase system in Caenorhabditis elegans. PLoS genetics. 2012;8:e1002957. doi: 10.1371/journal.pgen.1002957. [DOI] [PMC free article] [PubMed] [Google Scholar]
- Moribe H, Yochem J, Yamada H, Tabuse Y, Fujimoto T, Mekada E. Tetraspanin protein (TSP-15) is required for epidermal integrity in Caenorhabditis elegans. Journal of cell science. 2004;117:5209–20. doi: 10.1242/jcs.01403. [DOI] [PubMed] [Google Scholar]
- Nakamasu A, Takahashi G, Kanbe A, Kondo S. Interactions between zebrafish pigment cells responsible for the generation of Turing patterns. Proceedings of the National Academy of Sciences of the United States of America. 2009;106:8429–34. doi: 10.1073/pnas.0808622106. [DOI] [PMC free article] [PubMed] [Google Scholar]
- Nakamura T, Mine N, Nakaguchi E, Mochizuki A, Yamamoto M, Yashiro K, Meno C, Hamada H. Generation of robust left-right asymmetry in the mouse embryo requires a self-enhancement and lateral-inhibition system. Developmental cell. 2006;11:495–504. doi: 10.1016/j.devcel.2006.08.002. [DOI] [PubMed] [Google Scholar]
- Odintsova E, Sugiura T, Berditchevski F. Attenuation of EGF receptor signaling by a metastasis suppressor, the tetraspanin CD82/KAI-1. Current biology: CB. 2000;10:1009–12. doi: 10.1016/s0960-9822(00)00652-7. [DOI] [PubMed] [Google Scholar]
- Ono M, Handa K, Withers DA, Hakomori S. Glycosylation effect on membrane domain (GEM) involved in cell adhesion and motility: a preliminary note on functional alpha3, alpha5-CD82 glycosylation complex in ldlD 14 cells. Biochemical and biophysical research communications. 2000;279:744–50. doi: 10.1006/bbrc.2000.4030. [DOI] [PubMed] [Google Scholar]
- Parichy DM. Animal pigment pattern: an integrative model system for studying the development, evolution, and regeneration of form. Seminars in cell & developmental biology. 2009;20:63–4. doi: 10.1016/j.semcdb.2008.12.010. [DOI] [PMC free article] [PubMed] [Google Scholar]
- Parichy DM, Mellgren EM, Rawls JF, Lopes SS, Kelsh RN, Johnson SL. Mutational analysis of endothelin receptor b1 (rose) during neural crest and pigment pattern development in the zebrafish Danio rerio. Developmental biology. 2000a;227:294–306. doi: 10.1006/dbio.2000.9899. [DOI] [PubMed] [Google Scholar]
- Parichy DM, Ransom DG, Paw B, Zon LI, Johnson SL. An orthologue of the kit-related gene fms is required for development of neural crest-derived xanthophores and a subpopulation of adult melanocytes in the zebrafish, Danio rerio. Development. 2000b;127:3031–44. doi: 10.1242/dev.127.14.3031. [DOI] [PubMed] [Google Scholar]
- Parichy DM, Rawls JF, Pratt SJ, Whitfield TT, Johnson SL. Zebrafish sparse corresponds to an orthologue of c-kit and is required for the morphogenesis of a subpopulation of melanocytes, but is not essential for hematopoiesis or primordial germ cell development. Development. 1999;126:3425–36. doi: 10.1242/dev.126.15.3425. [DOI] [PubMed] [Google Scholar]
- Parichy DM, Turner JM. Temporal and cellular requirements for Fms signaling during zebrafish adult pigment pattern development. Development. 2003a;130:817–33. doi: 10.1242/dev.00307. [DOI] [PubMed] [Google Scholar]
- Parichy DM, Turner JM. Zebrafish puma mutant decouples pigment pattern and somatic metamorphosis. Developmental biology. 2003b;256:242–57. doi: 10.1016/s0012-1606(03)00015-0. [DOI] [PubMed] [Google Scholar]
- Patterson LB, Parichy DM. Interactions with iridophores and the tissue environment required for patterning melanophores and xanthophores during zebrafish adult pigment stripe formation. PLoS genetics. 2013;9:e1003561. doi: 10.1371/journal.pgen.1003561. [DOI] [PMC free article] [PubMed] [Google Scholar]
- Quigley IK, Manuel JL, Roberts RA, Nuckels RJ, Herrington ER, Macdonald EL, Parichy DM. Evolutionary diversification of pigment pattern in Danio fishes: differential fms dependence and stripe loss in D. albolineatus. Development. 2005;132:89–104. doi: 10.1242/dev.01547. [DOI] [PubMed] [Google Scholar]
- Sheth R, Marcon L, Bastida MF, Junco M, Quintana L, Dahn R, Kmita M, Sharpe J, Ros MA. Hox genes regulate digit patterning by controlling the wavelength of a Turing-type mechanism. Science. 2012;338:1476–80. doi: 10.1126/science.1226804. [DOI] [PMC free article] [PubMed] [Google Scholar]
- Shigeta M, Sanzen N, Ozawa M, Gu J, Hasegawa H, Sekiguchi K. CD151 regulates epithelial cell-cell adhesion through PKC- and Cdc42-dependent actin cytoskeletal reorganization. The Journal of cell biology. 2003;163:165–76. doi: 10.1083/jcb.200301075. [DOI] [PMC free article] [PubMed] [Google Scholar]
- Shoham T, Rajapaksa R, Kuo CC, Haimovich J, Levy S. Building of the tetraspanin web: distinct structural domains of CD81 function in different cellular compartments. Molecular and cellular biology. 2006;26:1373–85. doi: 10.1128/MCB.26.4.1373-1385.2006. [DOI] [PMC free article] [PubMed] [Google Scholar]
- Spring FA, Griffiths RE, Mankelow TJ, Agnew C, Parsons SF, Chasis JA, Anstee DJ. Tetraspanins CD81 and CD82 facilitate alpha4beta1-mediated adhesion of human erythroblasts to vascular cell adhesion molecule-1. PloS one. 2013;8:e62654. doi: 10.1371/journal.pone.0062654. [DOI] [PMC free article] [PubMed] [Google Scholar]
- Stipp CS, Kolesnikova TV, Hemler ME. EWI-2 regulates alpha3beta1 integrin-dependent cell functions on laminin-5. The Journal of cell biology. 2003;163:1167–77. doi: 10.1083/jcb.200309113. [DOI] [PMC free article] [PubMed] [Google Scholar]
- Tachibana I, Hemler ME. Role of transmembrane 4 superfamily (TM4SF) proteins CD9 and CD81 in muscle cell fusion and myotube maintenance. The Journal of cell biology. 1999;146:893–904. doi: 10.1083/jcb.146.4.893. [DOI] [PMC free article] [PubMed] [Google Scholar]
- Takino T, Miyamori H, Kawaguchi N, Uekita T, Seiki M, Sato H. Tetraspanin CD63 promotes targeting and lysosomal proteolysis of membrane-type 1 matrix metalloproteinase. Biochemical and biophysical research communications. 2003;304:160–6. doi: 10.1016/s0006-291x(03)00544-8. [DOI] [PubMed] [Google Scholar]
- Tamura K, Peterson D, Peterson N, Stecher G, Nei M, Kumar S. MEGA5: molecular evolutionary genetics analysis using maximum likelihood, evolutionary distance, and maximum parsimony methods. Molecular biology and evolution. 2011;28:2731–9. doi: 10.1093/molbev/msr121. [DOI] [PMC free article] [PubMed] [Google Scholar]
- Tiwari-Woodruff SK, Buznikov AG, Vu TQ, Micevych PE, Chen K, Kornblum HI, Bronstein JM. OSP/claudin-11 forms a complex with a novel member of the tetraspanin super family and beta1 integrin and regulates proliferation and migration of oligodendrocytes. The Journal of cell biology. 2001;153:295–305. doi: 10.1083/jcb.153.2.295. [DOI] [PMC free article] [PubMed] [Google Scholar]
- Tiwari-Woodruff SK, Kaplan R, Kornblum HI, Bronstein JM. Developmental expression of OAP-1/Tspan-3, a member of the tetraspanin superfamily. Journal of neuroscience research. 2004;77:166–73. doi: 10.1002/jnr.20141. [DOI] [PubMed] [Google Scholar]
- Tu L, Kong XP, Sun TT, Kreibich G. Integrity of all four transmembrane domains of the tetraspanin uroplakin Ib is required for its exit from the ER. Journal of cell science. 2006;119:5077–86. doi: 10.1242/jcs.03285. [DOI] [PubMed] [Google Scholar]
- Turing AM. The Chemical Basis of Morphogenesis. Philos T Roy Soc B. 1952;237:37–72. [Google Scholar]
- Urasaki A, Morvan G, Kawakami K. Functional dissection of the Tol2 transposable element identified the minimal cis-sequence and a highly repetitive sequence in the subterminal region essential for transposition. Genetics. 2006;174:639–649. doi: 10.1534/genetics.106.060244. [DOI] [PMC free article] [PubMed] [Google Scholar]
- Van Niel G, Charrin S, Simoes S, Romao M, Rochin L, Saftig P, Marks MS, Rubinstein E, Raposo G. The tetraspanin CD63 regulates ESCRT-independent and -dependent endosomal sorting during melanogenesis. Developmental cell. 2011;21:708–21. doi: 10.1016/j.devcel.2011.08.019. [DOI] [PMC free article] [PubMed] [Google Scholar]
- Watanabe M, Iwashita M, Ishii M, Kurachi Y, Kawakami A, Kondo S, Okada N. Spot pattern of leopard Danio is caused by mutation in the zebrafish connexin41.8 gene. EMBO reports. 2006;7:893–7. doi: 10.1038/sj.embor.7400757. [DOI] [PMC free article] [PubMed] [Google Scholar]
- Watanabe M, Kondo S. Changing clothes easily: connexin41.8 regulates skin pattern variation. Pigment cell & melanoma research. 2012;25:326–30. doi: 10.1111/j.1755-148X.2012.00984.x. [DOI] [PubMed] [Google Scholar]
- Xu H, Lee SJ, Suzuki E, Dugan KD, Stoddard A, Li HS, Chodosh LA, Montell C. A lysosomal tetraspanin associated with retinal degeneration identified via a genome-wide screen. The EMBO journal. 2004;23:811–22. doi: 10.1038/sj.emboj.7600112. [DOI] [PMC free article] [PubMed] [Google Scholar]
- Xu J, He J, Castleberry AM, Balasubramanian S, Lau AG, Hall RA. Heterodimerization of alpha 2A- and beta 1-adrenergic receptors. The Journal of biological chemistry. 2003;278:10770–7. doi: 10.1074/jbc.M207968200. [DOI] [PubMed] [Google Scholar]
- Yamaguchi M, Yoshimoto E, Kondo S. Pattern regulation in the stripe of zebrafish suggests an underlying dynamic and autonomous mechanism. Proceedings of the National Academy of Sciences of the United States of America. 2007;104:4790–3. doi: 10.1073/pnas.0607790104. [DOI] [PMC free article] [PubMed] [Google Scholar]
- Yamamoto A, Nagano T, Takehara S, Hibi M, Aizawa S. Shisa promotes head formation through the inhibition of receptor protein maturation for the caudalizing factors, Wnt and FGF. Cell. 2005;120:223–35. doi: 10.1016/j.cell.2004.11.051. [DOI] [PubMed] [Google Scholar]
- Ziegler I. The pteridine pathway in zebrafish: regulation and specification during the determination of neural crest cell-fate. Pigment cell research/sponsored by the European Society for Pigment Cell Research and the International Pigment Cell Society. 2003;16:172–82. doi: 10.1034/j.1600-0749.2003.00044.x. [DOI] [PubMed] [Google Scholar]
- Zoller M. Tetraspanins: push and pull in suppressing and promoting metastasis. Nature reviews Cancer. 2009;9:40–55. doi: 10.1038/nrc2543. [DOI] [PubMed] [Google Scholar]
- Zukauskas A, Merley A, Li D, Ang LH, Sciuto TE, Salman S, Dvorak AM, Dvorak HF, Jaminet SC. TM4SF1: a tetraspanin-like protein necessary for nanopodia formation and endothelial cell migration. Angiogenesis. 2011;14:345–54. doi: 10.1007/s10456-011-9218-0. [DOI] [PMC free article] [PubMed] [Google Scholar]
Associated Data
This section collects any data citations, data availability statements, or supplementary materials included in this article.