Abstract
A visible negative-index metamaterial was fabricated by adopting a template-assisted and self-assembled electrochemical deposition method. Originating from the inherent characteristic of bottom-up fabrication, it has been demonstrated by the effective medium theory that the metamaterial resonance could realize a negative index at visible wavelengths if the degree of asymmetry is kept in a moderate range. This was experimentally substantiated by fabricating an asymmetric Ag–polyvinyl alcohol (PVA)–Ag multilayer nanostructure with two apertured silver films on the opposite sides of PVA film. The extraction of constitutive parameters shows negative index in the wavelength range from 535 to 565 nm, with a minimum value close to −0.5. Simultaneously, an optically active medium Rhodamine B was incorporated into the PVA layer, which readily changed the transmission peak through control experiments. Finally, the enhanced transmission was realized through a flat sample.
Negative-index mematerials (NIMs) are artificially engineered nanostructured materials that exhibit negative refractive index, which cannot be attained in naturally occurring materials. Ever since their discovery in 20011, NIMs have attracted significant interests owing to their extraordinary electromagnetic properties2,3,4,5. Over the past decade, studies have actualized various types of NIMs with the resonant frequencies ranging from gigahertz to higher frequencies. From the standpoint of real-time applications, one of the most fascinating and significant goals is to achieve negative refraction at visible wavelengths. According to the effective medium theory, the size of the interior structural unit of NIMs should be much smaller than the operating wavelength6. However, it is highly difficult to manufacture NIMs with very short resonant wavelengths. Until now, artificially engineered NIMs have been experimentally demonstrated at the near-infrared and red-light wavelengths, wherein the fishnet structure has been widely studied as a typical design7,8,9, ever since its first appearance in 2005. The negative refraction in fishnet NIM has been established at wavelengths of the order of 1 μm10, 780 nm11, and more recently, close to red-light wavelength of 700 nm12. Besides, a recent study has demonstrated a special plasmonic waveguide metamaterial that is capable of realizing negative refraction and flat lensing at ultraviolet light wavelengths13. Conventionally, NIMs are being fabricated by using top-down etch technology, such as electron beam lithography and focused ion beam milling14,15. However, the abovementioned methods are intricate, expensive, and unsuitable for large-area fabrication, posing a great challenge to achieve smaller resonant structures. Thus, the realization of NIMs at visible wavelengths still remains to be unrealistic.
Lately, researchers have developed various bottom-up fabrication methods, such as self-aligned membrane projection lithography16, self-organization17, thermal electric-field poling technique18, and block copolymer self-assembly19 for the fabrication of metamaterials. In our previous work reported elsewhere, we demonstrated the feasibility of yet another bottom-up approach, namely, electrochemical deposition method for the fabrication of near-infrared NIMs20,21. In particular, this method is specifically suitable for the fabrication of NIMs with smaller-sized structural units, which otherwise are unattainable by conventional etch fabrication methods. Although the direct use of electrochemical deposition technique may result in the formation of disordered nanostructured units, NIMs with periodic structures can be realized when combined with template-assisted self-assembly process10,21. In this study, we demonstrate the fabrication of visible NIM by template-assisted and self-assembled electrochemical deposition, producing a three-layered structure consisting of two apertured metal films, asymmetrically on the opposite sides of a dielectric layer. The asymmetry of the multilayer structure originates from the inherent characteristic of the bottom-up fabrication process. Its negative-index behavior at visible wavelengths can be validated both through numerical simulation and experimental data analysis. In order to improve the optical properties of the asymmetric multilayer structure, an optically active medium, Rhodamine B (RhB), is incorporated in the dielectric layer. Control experiments show that the samples doped with RhB have higher transmission magnitudes and better effects of transmission enhancement than the samples without RhB.
Results
Analysis of numerical simulations for the present model
Numerical simulations were performed using the commercial package COMSOL Multiphysics. In principle, silver does not behave as a perfect conductor at higher frequencies, and hence its dielectric function should be characterized by Drude model22 with a plasma frequency of ωp = 1.37 × 10¹⁶ s−1 and a collision frequency of ωc = 8.5 × 10¹³ s−1. The standard algorithm for retrieving effective constitutive parameters of the Ag–polyvinyl alcohol (PVA)–Ag structure was applied23. The refractive index (n) and impedance (z) were first retrieved from the scattering coefficients, and then permeability (μ) and permittivity (ε) were obtained according to the following equations:  and
and  . Figure 1 shows all the geometrical dimensions of the model proposed in this study and the polarization configuration of the electromagnetic wave. The plane wave is at normal incidence with the electric field polarized in y-direction. The rectangular area surrounded by yellow curve is the structural unit. The holes in the silver films were designed to be polygonal, instead of spherical shape, as the mutual extrusion of these dense holes tends to distort their spherical shape during fabrication. Silver films of thickness (t) 30 nm are separated by a 40-nm-thick PVA layer. The radius of the holes (r) is 70 nm and the width of the wall between the neighboring holes (w) is 95 nm. In order to describe the degree of disalignment, the upper silver film is assumed to move simultaneously along the x-direction by Δx and along the y-direction by Δy (assuming Δx = Δy in our simulations) with respect to the lower silver film.
Figure 1. Schematic illustration of an array of three-layer asymmetrical nanostructures and the polarization configuration of an electromagnetic wave.
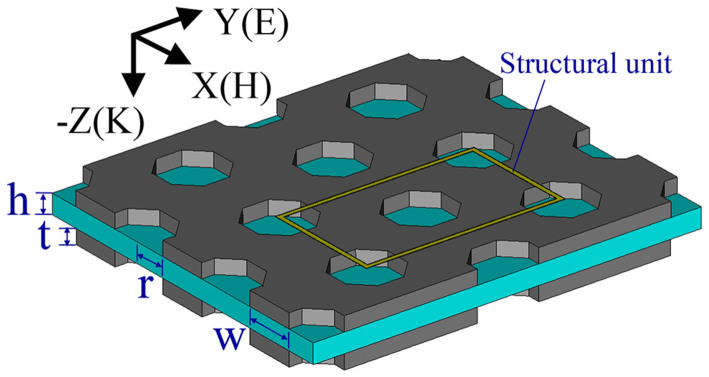
The geometrical parameters are w = 95 nm, r = 70 nm, t = 30 nm, and h = 40 nm, and the electromagnetic wave is at normal incidence with the electric field along the y-direction. The rectangular part surrounded with yellow line is the structural unit.
Electromagnetic parameters retrieved from simulations
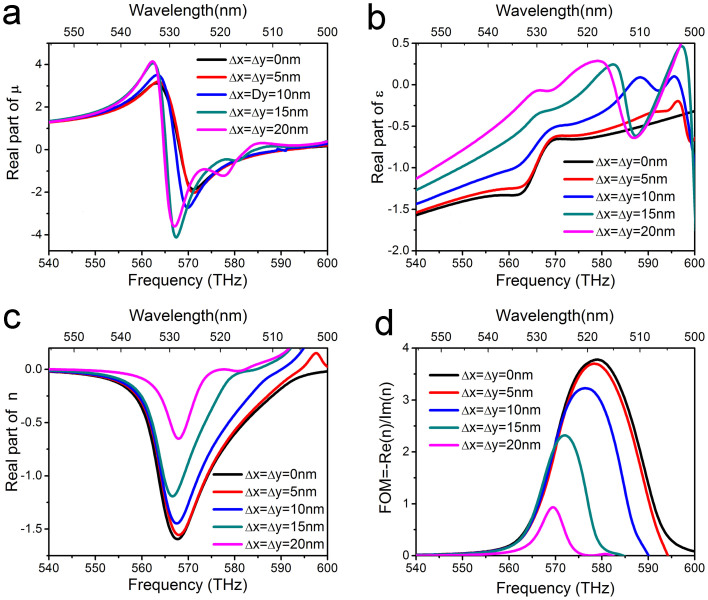
For convenience, we numerically analyze the electromagnetic response of the asymmetrical structural unit while increasing its disalignment degree. The effective μ, ε, and n values thus obtained are plotted in Figures 2a, 2b, and 2c, respectively. The figure of merit (FOM), defined as −Re(n)/Im(n), characterizes the inherent loss (Figure 2d). As evidenced from Figure 2, the negative refractive index at visible wavelengths can be still maintained even when the disalignment degree Δx is kept at 20 nm (1/7 size of the hole diameter). However, it could be realized that the value of FOM decreases greatly with increase in Δx, indicating that the inherent losses become more serious with the growth of Δx. This can be explained on the basis of the fact that with increase in Δx, more and more portions of the holes are covered with the silver film on the other side of the PVA layer. Consequently, the resonance between the two silver films becomes weak. The following two important aspects can be concluded from the curves shown in Figure 2: (i) the asymmetrical structure can achieve negative refraction at visible frequencies if Δx is controlled within a moderate range, and (ii) the large inherent losses weaken the performance of the resonant structure.
Figure 2. Effective constituent parameters with varying degrees of disalignment are retrieved from the simulated S parameters, such as the real parts of (a) permeability, (b) permittivity, (c) refractive index, and (d) the value of FOM, defined as -Re(n)/Im(n).
Scanning electron microscopic images of the fabricated samples
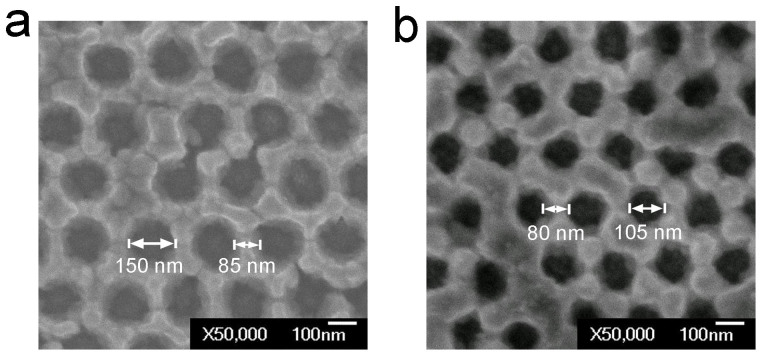
Figures 3a and 3b show the scanning electron microscopic images of the two groups of samples with different sizes operating at the red- and green-light wavelengths, respectively. As displayed in Figure 3a, the key structural parameters such as the hole diameter is about 150 nm and the width of the wall between the neighboring holes is about 85 nm, while those in Figure 3b are around 105 nm and 80 nm, respectively. In this study, RhB as a dopant material was incorporated into the PVA dielectric layer in order to meliorate the middle PVA layer, and its effects was investigated through control experiments. Each group includes two types of samples, namely, those with and without RhB. Transmission experiments were performed using a UV-4100 spectrophotometer.
Figure 3. Top-view electron micrographic images of the fabricated samples operating at wavelengths corresponding to (a) red light and (b) green light.
Transmission measurements
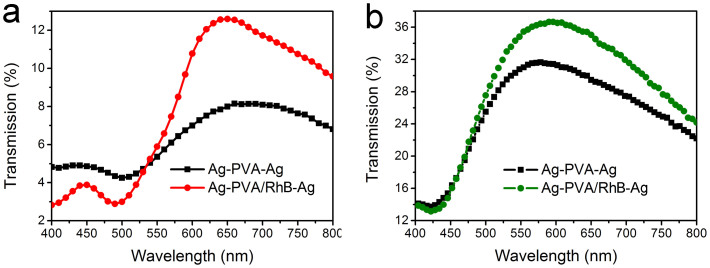
Figure 4a plots the transmission spectra of one group of the samples operating at red-light wavelength. Herein, the black curve represents the sample without RhB, while the red curve corresponds to the sample with RhB. The maximal increase in transmission is the difference between the two transmission peaks. Upon inclusion of RhB, the peak value is boosted from 8.2% at λ = 660 nm to 12.6% at λ = 650 nm. Figure 4b shows the transmission spectra of the other group of samples with working wavelengths in the green-light range. Here, the black and green curves represent samples without and with RhB, respectively. The corresponding transmission peaks occurred at λ = 570 nm and λ = 590 nm, with the peak value increasing from 31.6% to 36.7%. As is seen, the transmission peaks of the Ag-PVA/RhB-Ag samples are higher than that of the Ag-PVA-Ag samples. It has been discussed in simulations that the Ag-PVA-Ag structure with better alignment had higher transmission. Therefore, it can be believed that the incorporation of RhB into PVA changed the property of the PVA layer and influenced the arrangement of the holes, which would facilitate better alignment between the two silver films.
Figure 4. Measured transmission spectra of samples at (a) red-light and (b) green-light wavelengths.
The black curves represent the samples without RhB, while the red and green curves correspond to the samples with RhB.
Electromagnetic parameters retrieved from the experimental data
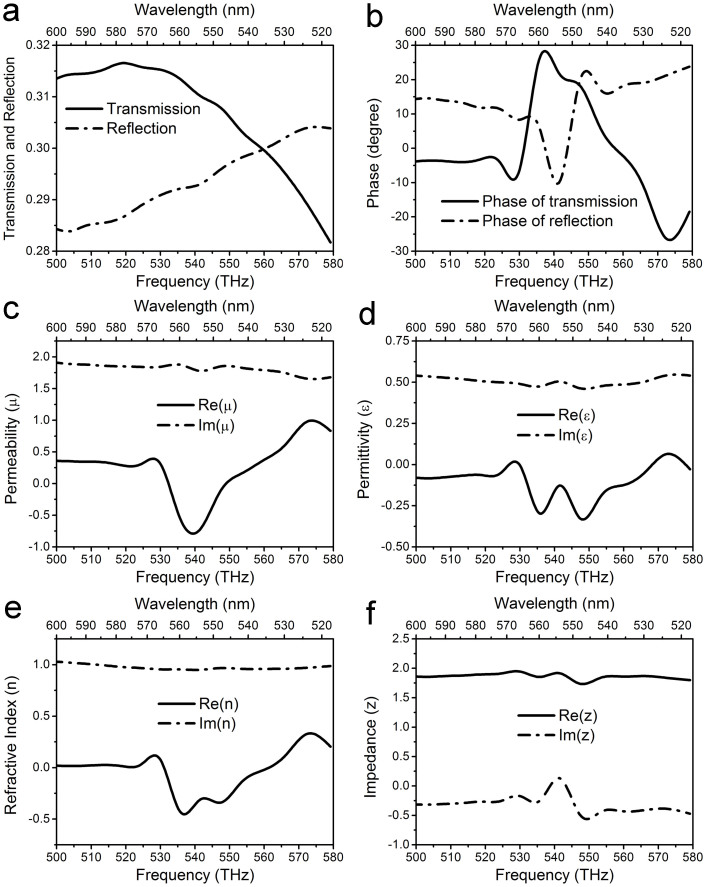
The negative-index properties of the asymmetrical metal-dielectric-metal nanostructure have been experimentally verified as follows. In case of the green-light resonant sample without RhB, the amplitudes and phases of transmission and reflection are needed for retrieving its electromagnetic parameters such as refractive index, impedance, permeability, and permittivity. The phase measurements in both transmission and reflection were performed using a similar method with Michelson interferometer, the details of which have been elaborated in Ref. 24. The measured results are shown in Figure 5. The amplitudes and phases of the transmission (solid lines) and reflection (dashed lines) coefficients are presented in Figures 5a and 5b, respectively. The low transmission observed in Figure 5a could be attributed to the large inherent losses, while the high reflection stems from the impedance mismatch with air (because the impedance in Figure 5f is not as Z → 1 + 0i). As seen in Figure 5b, a phase mutation of transmission emerges at wavelength around 565 nm wavelength (or 530 THz frequency), which could be clearly correlated with the appearance of resonance. The retrieved permeability, permittivity, refractive index, and impedance are displayed respectively in Figures 5c, 5d, 5e, and 5f, wherein the solid lines represent the real parts and the dashed lines represent the imaginary parts. It can be observed that the negative index of refraction occurs in the wavelength range from 535 nm to 565 nm (or in the vicinity of 540 THz frequencies) with a minimum value close to −0.5, validating the predicted NIM properties of the asymmetrical metal-dielectric-metal nanostructure. However, it could be realized that there exists a discrepancy for the negative-index region between experiments and simulations. This issue can be explained that the aim of numerical simulations is only to demonstrate the feasibility of fabricating asymmetrical metal-dielectric-metal visible metamaterials by self-assembled electrochemical deposition, and provide the theoretical grounds for the experiments. On the other hand, the different sizes of fabricated samples might only result in different negative-index wavelengths, but not affect the physical essence of resonance. In principle, negative index in the entire visible wavelength range can be realized by tailoring the geometry of the nanostructure.
Figure 5. Refractive index, impedance, permeability, and permittivity were extracted from the complex transmission and reflection coefficients.
Amplitude (a) and phase (b) of transmission (solid lines) and reflection (dashed lines). Permeability (c), permittivity (d), refractive index (e), and impedance (f), solid curves denote the real parts and the dashed curves denote the imaginary parts.
Experiments of transmission enhancement were realized through flat samples
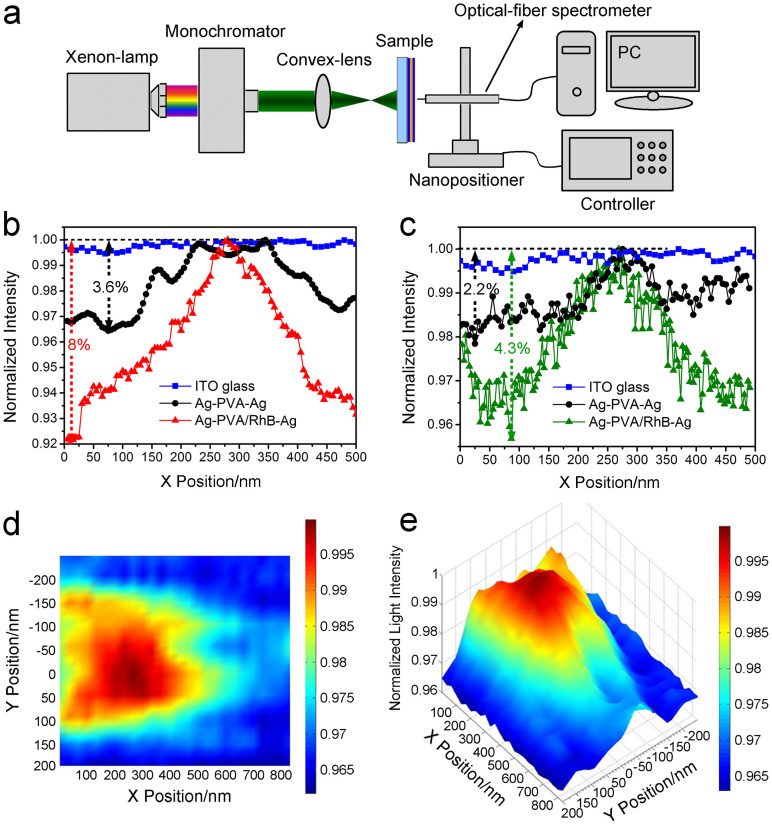
Furthermore, the enhanced transmission was realized through flat samples25,26, as shown in Figure 6. The typical experimental setup is illustrated in Figure 6a. When a beam of polychromatic light is scattered from a xenon-lamp (LHX150, Zolix) and passes through a special monochromator, it is transformed into monochromatic light with the same wavelength as the resonant wavelength of the measured sample. A beam of scattered light is obtained after a convex-lens and passes through a flat sample. Finally, an enhanced transmission would occur at a distance away from the sample surface, which could be detected by using an optical-fiber spectrometer fixed on a nano-positioner (TSM25-2A, Zolix). Figure 6b employs the same sample as used in Figure 4a, while Figure 6c adopts the same sample as applied in Figure 4b. In Figure 6b, the wavelengths of the monochromic light is chosen as λ = 650 nm. It can be seen that the light intensity is nearly close to a straight line for the ITO glass, but a peak emerges for the flat samples. Moreover, the sample with RhB has a more evident peak than the sample without RhB at the same position. In Figure 6c, the wavelength of the monochromic light is selected as λ = 550 nm. Likewise, the ITO glass maintains a nearly unvaried light intensity, whereas the sample with RhB exhibits better effects of focus peak. The combined results in Figures 6b and 6c have unambiguously demonstrated the transmission enhancement property of the asymmetric Ag-PVA-Ag nanostructure at visible frequencies. After the incorporation of RhB in the PVA layer of the samples, the effects of transmission enhancement become more obvious. Here, the concept of transmission enhancement is defined as the relative height of the appeared peak (the difference between the maximal and the minimal values), which is marked with dashed lines in Figures 6b and 6c. After the incorporation of RhB, the relative height of peak is increased from 3.6% (black dashed line) to 8.0% (red dashed line) for the red-light resonant samples (Figure 6b), while that for the green-light resonant samples (Figure 6c) is enhanced from 2.2% (black dashed line) to 4.3% (green dashed line). Therefore, the relative height increases nearly by twice. In order to further make the results intelligible, the two- and three-dimensional images of Figure 6c are shown in Figures 6d and 6e, respectively. It can be clearly observed that there exists an enhanced transmission peak around 300 nm along the X position. This could be attributed to that the excitation of surface plasmonic currents transferred the energy of incident light from metal surface to the holes and then magnified the transmission27,28.
Figure 6. Experiments for transmission enhancement.
(a) The experimental setup. (b) The blue, black and red curves respectively correspond to the ITO glass, the red-light resonant samples without and with RhB. (c) The blue, black and green curves correspond to the ITO glass, the green-light resonant samples without and with RhB, respectively. The horizontal axis represents the positions of the beam of monochromic light when it passes through the flat sample and leaves its right-hand-side surface (zero point is set at this surface). The vertical axis represents the measured normalized intensity of the output light beam. (d) and (e) respectively show the two- and three-dimensional images of the transmission enhancement for the green-light resonant samples with RhB.
Discussion
As discussed above, an asymmetrical metal-dielectric-metal nanostructured metamaterial has been fabricated by template-assisted and self-assembled electrochemical deposition. The negative-index property of the structure at visible wavelengths could be maintained when the degree of asymmetry is kept less than 1/7 size of the fishnet-hole diameter, which has been theoretically verified on the basis of the effective medium theory. Subsequent experimental studies indicate that the extraction of constitutive parameters shows negative index in the wavelength range of 535 nm to 565 nm, with a minimum value close to −0.5. This unambiguously validates the negative-index properties of the samples. Furthermore, incorporating an optical active medium RhB into the PVA layer readily changes the transmission peaks. This was verified by preparing two groups of red- and green-light resonant samples, with each group including control samples with and without RhB. Upon incorporating of RhB, the transmission peak of red-light resonant samples increases from 8.2% to 12.6%, while that of green-light resonant samples shifts from 31.6% to 36.7%. Finally the experiments of transmission enhancement are realized through flat samples. The light intensity is nearly close to a straight line for the ITO glass, but a transmission peak emerges for the samples. Furthermore, the relative height of transmission peak is enhanced from 3.6% to 8.0% for the red-light resonant samples after the incorporation of RhB, while that is enhanced from 2.2% to 4.3% in case of the green-light resonant samples. In summary, this study demonstrates a significant breakthrough in the fabrication of visible NIMs. Besides, the technique adopted in this study can facilitate large-scale and low-cost manufacturing visible NIMs.
Methods
Fabrication procedure
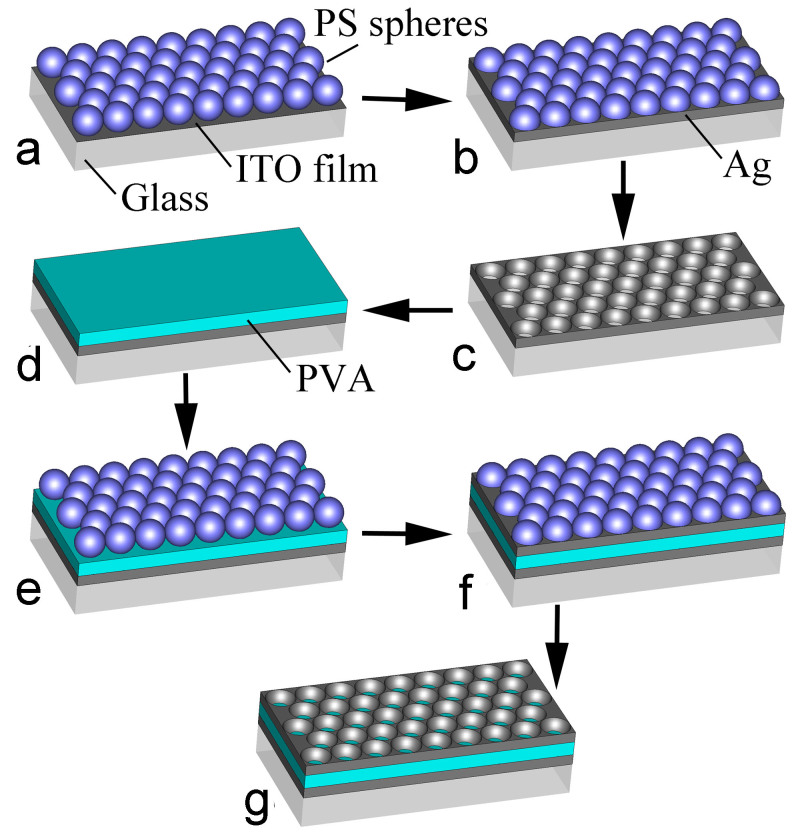
All the samples were fabricated onto indium tin oxide (ITO) conductive glass substrate via template-assisted self-assembled electrochemical deposition, as illustrated in Figure 7. In brief, the fabrication steps may be described as follows: (i) self-assembled nanometer-scale monolayer polystyrene (PS) spheres were initially prepared and arranged periodically on the ITO glass substrate, this was subsequently used as a template after solidification at 90°C in a dry box; (ii) a layer of silver was electrochemically deposited into the apertures among these PS spheres. The electrochemical deposition was performed using the applied direct current voltage of 8 V for 5 sec; (iii) all the PS spheres were dissolved with chloroform and the remaining chloroform was dissolved again with alcohol to form the first perforated silver film on the glass substrate; (iv) the liquid PVA solution was spin-coated onto the silver film. Although the PVA would penetrate into the fishnet holes and fill the voids, it did not affect the inherent resonance characteristics of the fishnet metamaterial. Following that, the sample was placed in a dry box again for 30 minutes. PVA was transferred from liquid to solid; (v) the second layer of perforated silver film was electrochemically deposited onto the solidified PVA film by applying a direct current voltage of 12 V for 10 sec. Afterward, the step (iii) was repeated. This sequential deposition process resulted in the formation of a three-layered Ag-PVA-Ag sandwich nanostructure.
Figure 7. Schematic of the fabrication process.
(a) Nanometer-scale PS spheres were periodically arranged on the ITO glass substrate. (b) Silver layer was electrochemically deposited into the apertures among these PS spheres. (c) The first perforated silver film was obtained by removing the PS spheres using chloroform and alcohol. (d) PVA solution was spin-coated onto the silver film and solidified in a dry box. (e) The second layer of PS spheres was periodically arranged on the solidified PVA film. (f) The second layer of perforated silver film was deposited. (g) In a manner similar to (c), the three-layered Ag-PVA-Ag sandwich nanostructure was finally fabricated by dissolving all the PS spheres.
Reliability of fabrication
The disalignment between the two metal layers could be attributed to the inherent characteristic of the bottom-up fabrication process. The first layer of silver film was electrochemically deposited on the conductive ITO glass, and then a layer of insulating PVA layer was coated onto the silver film. Finally, the second layer of silver film was deposited onto the PVA film. Therefore, the conditions adopted for depositing the two silver films are obviously different. It was very difficult to align the two metal layers. According to theoretical analysis, the size of disalignment between the two metal layers must be less than 20 nm (1/7 size of the hole diameter). However, the samples fabricated in the initial experiments did not meet this requirement. Upon performing several attempts to improvise the fabrication process, this issue was finally settled by increasing the voltage (12 V) and time (10 sec) for the deposition of the second silver film. This method established in this study is highly reliable, because it could be repeated time after time and the fabricated samples with a negative index could be verified with the retrieval experiments.
Author Contributions
X.Z. conceived the idea of fabricating the asymmetric metamaterial with the electrochemical deposition method. B.G. designed the metamaterial model and performed numerical analysis. X.Z. and B.G. co-wrote the manuscript. Z.P., S.L. and Y.Z. fabricated the sample and completed all the experiments. X.W. and C.L. prepared all the figures. All the authors reviewed the article.
Acknowledgments
This work was supported by the National Nature Science Foundation of China under Grant No. 11174234, 51272215,the National Key Scientific Program of China (under project No. 2012CB921503).
References
- Shelby R. A., Smith D. R. & Schultz S. Experimental verification of a negative index of refraction. Science 292, 77–79 (2001). [DOI] [PubMed] [Google Scholar]
- Seddon N. & Bearpark T. Observation of the inverse Doppler effect. Science 302, 1537–1540 (2003). [DOI] [PubMed] [Google Scholar]
- Shadrivov L. V., Zharov A. A. & Kivshar Y. S. Giant Goos-Hänchen effect at the reflection from left-handed metamaterials. Appl. Phys. Lett. 83, 2713–2715 (2003). [Google Scholar]
- Lagarkov A. N. & Kissel V. N. Near-perfect imaging in a focusing system based on a left-handed-material plate. Phys. Rev. Lett. 92, 077401 (2004). [DOI] [PubMed] [Google Scholar]
- Soukoulis C. M. & Wegener M. Past achievements and future challenges in the development of three-dimensional photonic metamaterials. Nature Photon. 154, 1–8 (2011). [Google Scholar]
- Koschny T., Kafesaki M., Economou E. N. & Soukoulis C. M. Effective medium theory of left-handed materials. Phys. Rev. Lett. 93, 107402 (2004). [DOI] [PubMed] [Google Scholar]
- Valentine J. et al. Three-dimensional optical metamaterial with a negative refractive index. Nature 455, 376–379 (2008). [DOI] [PubMed] [Google Scholar]
- Paul T., Menzel C., Rockstuhl C. & Lederer F. Advanced optical metamaterials. Adv. Mater. 22, 2354–2357 (2010). [DOI] [PubMed] [Google Scholar]
- Yang J., Sauvan C., Liu H. T. & Lalanne P. Theory of fishnet negative-index optical metamaterials. Phys. Rev. Lett. 107, 043903 (2011). [DOI] [PubMed] [Google Scholar]
- Lodewijks K. et al. Self-assembled hexagonal double fishnets as negative index materials. Appl. Phys. Lett. 98, 091101 (2011). [Google Scholar]
- Dolling G., Wegener M., Soukoulis C. M. & Linden S. Negative-index metamaterial at 780 nm wavelength. Opt. Lett. 32, 53–55 (2007). [DOI] [PubMed] [Google Scholar]
- García-Meca C. et al. Low-loss multilayered metamaterial exhibiting a negative index of refraction at visible wavelengths. Phys. Rev. Lett. 106, 067402 (2011). [DOI] [PubMed] [Google Scholar]
- Xu T., Agrawal A., Abashin M., Chau K. J. & Lezec H. J. All-angle negative refraction and active flat lensing of ultraviolet light. Nature 497, 470–474 (2013). [DOI] [PubMed] [Google Scholar]
- Boltasseva A. & Shalaev V. M. Fabrication of optical negative-index metamaterials: recent advances and outlook. Metamaterials 2, 1–17 (2008). [Google Scholar]
- Hossain M. M. & Gu M. Fabrication methods of 3D periodic metallic nano/microstructures for photonics applications. Laser Photonics Rev. 8, 1–17 (2013). [Google Scholar]
- Burckel D. B. et al. Fabrication of 3D metamaterial resonators using self-aligned membrane projection lithography. Adv. Mater. 22, 3171–3175 (2010). [DOI] [PubMed] [Google Scholar]
- Pawlak D. A. et al. How far are we from making metamaterials by self-organization? The microstructure of highly anisotropic particles with an SRR-like geometry. Adv. Funct. Mater. 20, 1116–1124 (2010). [Google Scholar]
- Beresna M. et al. Poling-assisted fabrication of plasmonic nanocomposite devices in glass. Adv. Mater. 22, 4368–4372 (2010). [DOI] [PubMed] [Google Scholar]
- Vignolini S. et al. A 3D optical metamaterial made by self-assembly. Adv. Mater. 24, OP23–OP27 (2012). [DOI] [PubMed] [Google Scholar]
- Liu B. Q., Zhao X. P., Zhu W. R., Luo W. & Cheng X. C. Multiple pass-band optical left-handed metamaterials based on random dendritic cells. Adv. Funct. Mater. 18, 3523–3528 (2008). [Google Scholar]
- Liu H., Zhao X. P., Yang Y., Li Q. W. & Lv J. Fabrication of infrared left-handed metamaterials via double template-assisted electrochemical deposition. Adv. Mater. 20, 2050–2054 (2008). [Google Scholar]
- Dolling G., Wegener M., Soukoulis C. M. & Linden S. Design-related losses of double-fishnet negative-index photonic metamaterials. Opt. Express 15, 11536–11541 (2007). [DOI] [PubMed] [Google Scholar]
- Smith D. R., Vier D. C., Koschny Th. & Soukoulis C. M. Electromagnetic parameter retrieval from inhomogeneous metamaterials. Phys. Rev. E. 71, 036617 (2005). [DOI] [PubMed] [Google Scholar]
- Drachev V. P. et al. Experimental verification of an optical negative-index material. Laser Phys. Lett. 3, 49–55 (2006). [Google Scholar]
- Ebbese T. W., Lezec H. J., Ghaemi H. F., Thio T. & Wolff P. A. Extraordinary optical transimission through sub-wavelength hole arrays. Nature 391, 667–669(1998). [Google Scholar]
- Garcia-Vidal F. J., Martin-Moreno L., Ebbese T. W. & Kuipers L. Light passing through subwavelength apertures. Reviews of Modern Physics 82, 729–787 (2010). [Google Scholar]
- Liu H. & Lalanne P. Microscopic theory of the extraordinary optical transmission. Nature 452, 728–731(2008). [DOI] [PubMed] [Google Scholar]
- Fang X. et al. Surface-plasmon-polariton assisted diffraction in periodic subwavelength holes of metal films with reduced interplane coupling. Phys. Rev. Lett. 99, 066805 (2007). [DOI] [PubMed] [Google Scholar]


