The emergence of solid-state NMR (SSNMR) techniques over the last decade has greatly expanded the range of accessible biomolecules amenable to structural study.1-2 These methods were developed and first applied to a variety of microcrystalline model proteins including BPTI,3 SH3,4-5 ubiquitin,6-7 kaliotoxin,8 and GB1.9-11 These studies demonstrated that individual 13C, 15N and 1H sites throughout the entire protein could be uniquely resolved and assigned for purposes of high-resolution structure determination. Whereas traditional solid-state NMR approaches required site-specific isotopic labeling, the new developments enable entire proteins to be examined by resolving signals in multiple dimensions. These capabilities also permit the measurement of dynamic parameters through correlation spectroscopy, which increases the throughput, sensitivity, reliability and reproducibility of such measurements.
A major advantage of SSNMR is that a large range of sample conditions and types can be examined, including many that are not accessible to solution NMR methods, such as membrane proteins and fibrils in addition to microcrystals. Recent examples include fibrils of the HET-s prion,12 high molecular weight oligomers of αB crystallin,13 the tetrameric assembly of the M2 peptide with bound amantadine drug in physiologically relevant bilayers,14 the trimeric membrane protein YadA,15 the photoreceptor proteorhodopsin,16 fibrils of the core domain of transthyretin,17 and beta-amyloid plaques derived from the brains of Alzheimer's disease patients.18 Such studies have opened up new avenues for exploration of fundamental biophysics and biochemistry, and yielded insights into clinically relevant events in membranes and aggregated states not accessible to solution NMR or X-ray crystallography. Moreover, SSNMR experiments are applicable over a larger range of temperatures than can be accessed by solution NMR19 and thereby enable a continuum of experimental conditions from physiological temperatures to the cryogenic temperatures at which most crystal structures are solved. Another advantage of NMR methods in general is that they are non-perturbing and do not require covalent modification of the protein. Thus, the dynamic information procured from such experiments has the potential to accurately represent the native protein behavior.
This review focuses on developments over the last five years, regarding methods and applications of dynamics studies by solid-state NMR over timescales ranging from nanoseconds to days.
Chemical Exchange in the Slow Limit
Minutes to Days
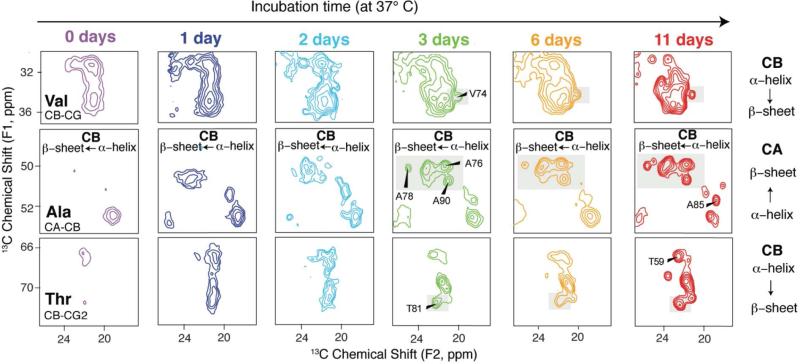
When rates of reaction are slow in comparison to the time required for NMR data collection, a series of spectra can be measured and exploit the unique advantages of SSNMR to collect data on functional enzymes turning over substrate to product within the NMR rotor. One elegant of example of such an approach is the observation of diacylglycerol kinase activity in lipid bilayers, in which Ullrich et al.20 obtained time-resolved 31P magic-angle spinning (MAS) spectra to monitor the rate of phosphorylation of diacylglycerol by ATP. The signals for reactants and products were observed for a variety of lipids and ATP analogs in 1D 31P spectra every one to ten minutes, following reactions occurring over several hours to two days. The results yielded insights into the mechanism of phosphoryl transfer, as well as cooperativity of subunits, all in the context of true lipid bilayers.20 Similar or longer timescales can be probed using methodologies for quenching reactions and trapping the intermediates for long-term data collection. This is a particularly powerful approach for the study of amyloidogenesis, in which the products of fibrillation are insoluble and non-crystalline and therefore not accessible to other high-resolution methods. As demonstrated by Chimon et al. toxic intermediates in the fibrillation pathway of β-amyloid21-22 could be trapped by freezing and then studied by a combination of electron microscopy and SSNMR, revealing that the intermediate is spherical with a diameter of 15-35 nm and primarily β-sheet secondary structure. Following this approach, Comellas et al. examined the detailed progression of α-synuclein from monomer to helical, membrane-bound intermediate to mature β-sheet structured fibril (Figure 1).23 In this case the sample incubation was conducted at 37 °C, and its progression quenched by centrifuging and washing the samples at defined time points, and then collecting the SSNMR data at lower temperature. In this study, the authors confirmed in control experiments that the spectra did not significantly change at time points much longer than required for data collection, proving that high-resolution spectra can be acquired even under conditions where the reaction kinetics are entirely quenched.
Figure 1.
Transition from α-helix to β-sheet evidenced by the changes in chemical shifts of α-synuclein incubated in the presence of phospholipid. Expanded regions of 13C–13C 2D spectra of AS incubated in the presence of phospholipid for 0, 1, 2, 3, 6, and 11 days. Secondary chemical shifts of individual resonances are diagnostic of conformation. Reproduced from G. Comellas, L. R. Lemkau, D. H. Zhou, J. M. George, C. M. Rienstra, J Am Chem Soc 2012, 134. 5090-9, DOI: 10.1021/ja209019s. Copyright 2012 American Chemical Society.
Milliseconds to Seconds
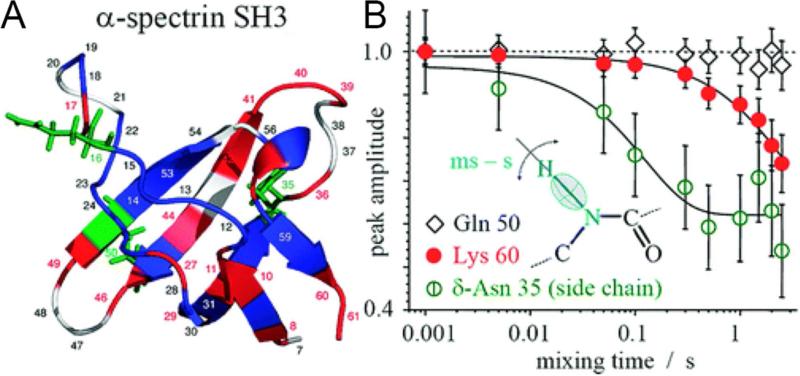
To address timescales at which kinetics are faster than the spectral acquisition time, techniques have been developed to monitor and quantify the magnitude and rate of equilibrium motions. In particular, the CODEX (centerband-only detection of exchange) method involves chemical shift anisotropy (CSA) or dipolar recoupling before and after a mixing period of timescale ~100 ms to several seconds. The recoupling is performed with MAS rotor-synchronization to ensure the refocusing of magnetization in the absence of motion; sites that are immobile and therefore do not change their orientation during the mixing period will be fully rephased. However, in the presence of motion, the magnetization is not entirely rephased after the mixing period because of the change in orientation that interferes with MAS averaging processes. Thus, resonances that are mobile and reorient during the mixing period have diminished signal intensity. CODEX can detect motions on the timescale up to the T1 relaxation time. This method was originally applied to 13C in synthetic polymers,24 and then extended to study protein backbone motions, utilizing the amide 15N CSA25 as well as side chain dynamics using dipolar recoupling rather than CSA recoupling.26 Krushelnitsky et al. utilized this approach to measure slow reorientation of backbone and sidechain amide sites in the microcrystalline protein SH3, resolving the signals in 1H-15N 2D chemical shift correlation spectra and observing changes in peak intensity as a function of the dipolar CODEX time. This reported on motional timescales from milliseconds to almost ten seconds (Figure 2).
Figure 2.
Mobility in SH3. A) Structure of the α-spectrin SH3 domain with color-coded residue mobility: blue indicates immobile residues, and red (backbone) and green (side chains) indicate mobile residues. Residues that are unassigned or not seen in the spectrum are white. B) Examples of τm dependences for residues undergoing (Lys 60 and δ-Asn 35) and not undergoing (Gln 50) slow motions. The lines are exponential fits. Reproduced from A. Krushelnitsky, E. deAzevedo, R. Linser, B. Reif, K. Saalwächter, D. Reichert, Journal of the American Chemical Society 2009, 131. 12097-12099, DOI: 10.1021/ja9038888. Copyright 2009 American Chemical Society.
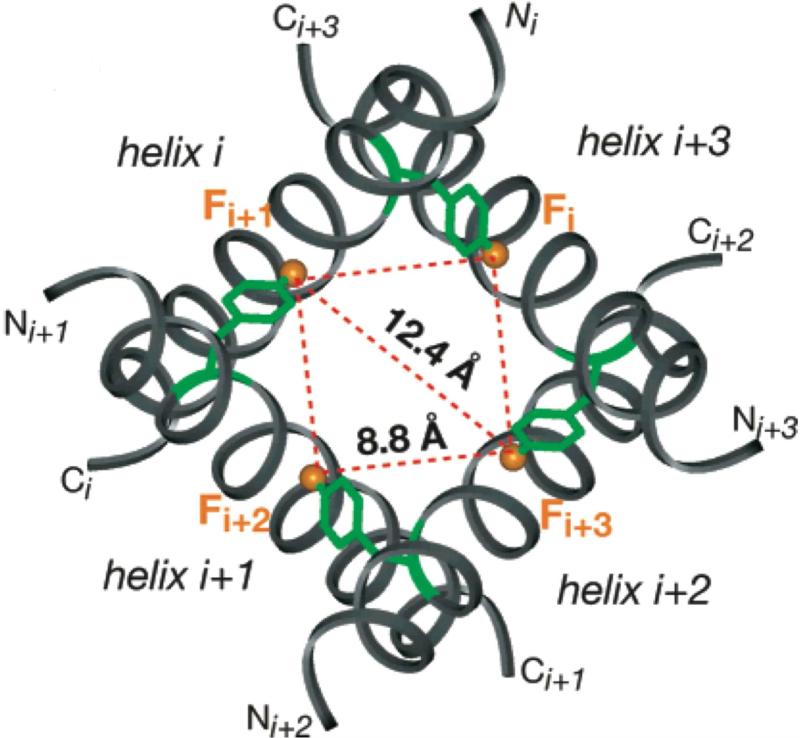
A modification of the CODEX experiment enables determination of the oligomer number in symmetric assemblies of peptides, by measuring the equilibrium decay of magnetization among chemically equivalent but orientationally distinct nuclei.27 In this case, the change in signal intensity depends on the rate of magnetization transfer among the nuclei, rather than the molecular motion. Using 19F labels, this approach is applicable to distances ranging from ~5 to 15 Å, and can be interpreted quantitatively in terms of the molecular geometry and rate of polarization exchange, as shown by Luo and Hong.28 In this study, the oligomeric number and the intermolecular distances were determined for the transmembrane peptide from influenza A membrane protein M2 in 1,2-dimyristoyl-sn-glycero-3-phosphatidylcholine bilayers (Figure 3).
Figure 3.
Top view of the NMR-based influenza A M2 transmembrane peptide tetramer model with a nearest neighbor 19F-19F distance of 8.8 Å at Phe30 between adjacent helices. The Phe ring of helix i + 1 protrudes from its backbone and lies close to the neighboring helix i. Reproduced from W. Luo, M. Hong, Journal of the American Chemical Society 2006, 128. 7242-51. Copyright 2006 American Chemical Society.
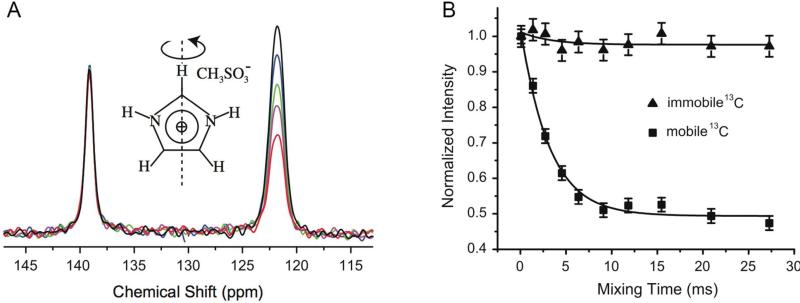
Li and McDermott have extended the CODEX method to somewhat faster timescales, on the order of tens of milliseconds, by virtue of 1H-15N or 1H-13C dipolar recoupling in combination with 1H-1H homonuclear decoupling. This approach also enables measurements in fully protonated samples.29 Because the 1H-15N and 1H-13C dipolar couplings are on the order of ~10 and ~20 kHz respectively, the CODEX dephasing effect occurs on the sub-millisecond timescale. Li and McDermott applied this new experiment to probe motions in the imidazolium ring of imidazole methyl sulfonate, observing motions on the 1-5 ms timescale, as shown in Figure 4. Motions on the order of the dephasing time (sub-millisecond) are too fast to be studied by CODEX because reorientations during the dephasing period interfere with decoupling and recoupling.
Figure 4.
A) 13C–1H R-CODEX spectra with different mixing times (black: 0.09 ms, blue: 1.36 ms, green: 2.73 ms, magenta: 4.55 ms, red: 27.27 ms). The peak near 139 ppm is the apical carbon in the imidazolium ring. Because this bond vector is insensitive to reorientation, there is no signal intensity loss even at longer mixing times. The peak near 122 ppm is due to the two basal carbons. The two basal carbons’ peaks are merged and unresolved. Signal intensity is lost during mixing because motions reorient the dipolar vector. B) Peak intensity vs. mixing time for apical and basal carbons. The black lines are single exponential fits with an exchange rate kex of 0.32 ± 0.03 kHz. Squares show signal intensity loss for the basal carbon signal indicating rearrangements at this position, but little intensity loss for the apical carbon insensitive to motion. Reprinted with permission from W. Li, A. McDermott, Journal of magnetic resonance (San Diego, Calif : 1997) 2012, 222. 74-80, DOI: 10.1016/j.jmr.2012.05.019. Copyright 2012 Elsevier.
Sub-Millisecond Motions
Carr–Purcell–Meiboom–Gill (CPMG)30-31 relaxation dispersion methods are now well developed for study of millisecond motions for proteins in solution, particularly those involved in enzyme catalysis.32-38 In particular, this technique has been used to quantify the rates, populations, and chemical shift changes resulting from motions relevant for protein function. This approach is invaluable for examination of conformational exchange of relevance to protein folding, ligand binding, and catalysis. Thorough reviews of solution NMR CPMG experiments and applications exist.39-42
To extend these concepts to solid proteins, Schanda and co-workers implemented fast MAS combined with high levels of deuteration to achieve long coherence lifetimes, and applied the CPMG pulses to 15N, prior to 1H detection.43 This enabled the detection of millisecond timescale motions in a crystalline ubiquitin sample in regions of the protein where motions are known to be on a faster timescale in solution, indicating that the crystal contacts likely have impeded the conformational exchange. This technique detects motions as fast as 3,000 s−1, where the upper limit is determined by the requirement of separating the timescales of the CPMG pulses from the dipolar averaging from MAS. For example, in the case where the MAS rate is 50 kHz (τr = 20 Tsec), the fastest rate of π pulses used in this study was 900 Hz.
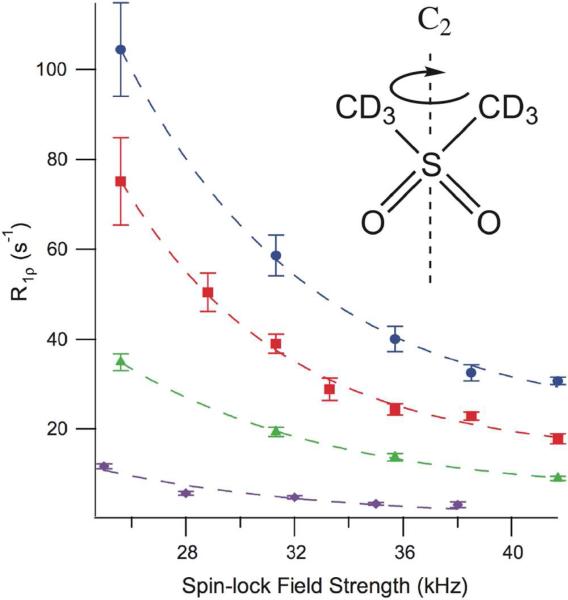
To gain access to faster timescales (10 to 100 Tsec), rotating frame relaxation dispersion measurements have been quantified in the solid state. Quinn and McDermott were able to measure reorientations in d6-DMS by measuring the R1rho as a function of spin lock field from ~20 to 50 kHz. 44 Exchange rates ranging from ~300 to 7500 s−1 were measured over an extended range of temperature, and Arrhenius activation parameters on the order of 70 kJ/mol could be determined (Figure 5).44
Figure 5.
Motions in d6-DMS. Dispersion curves collected at 4 different temperatures, purple diamonds 37 °C, green triangles 57 °C, red squares 67 °C, and blue circles 77 °C for d6-DMS. The greater dependence of R1ρ on spin-lock power at higher temperature indicates a faster exchange rate for the two-site hop. The larger error at low spin-lock field strengths is due to residual multi-exponential behavior near the rotary resonance condition. Reproduced from C. M. Quinn, A. E. McDermott, Journal of Magnetic Resonance 2012, 222. 1-7, DOI: 10.1016/j.jmr.2012.05.014. Copyright 2012 American Chemical Society.
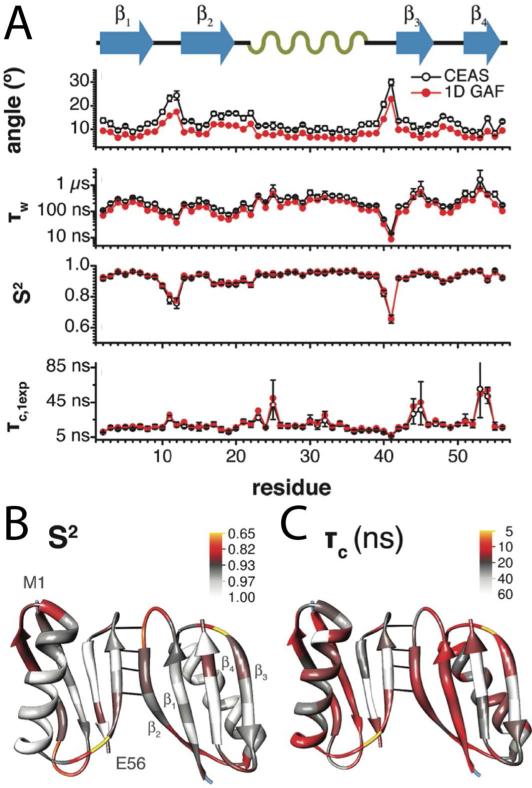
As with the CPMG methods, R1ρ approaches have been extended to proteins in the solid state by combining fast MAS and deuteration in order to suppress the effects of motionally independent relaxation.45 Lewandowski and coworkers used this technique to study 15N relaxation in GB1 at 1 GHz magnetic field. By combining R1 and R1ρ relaxation the authors were able to measure order parameters at each amide to quantify motions, assuming a diffusion-on-a-cone model (Figure 6). The diffusion time constant is determined with high accuracy, and the global correlation times and order parameters indicate regions of increased mobility. Ten curves also show a dependence of R1ρ on the spin-lock field, indicating that these residues are experience dynamics on the <0.1 ms timescale.
Figure 6.
Motions in GB1. A) Quantitative analysis of 15N R1 and R1ρ using diffusion on a cone (CEAS) and 1D GAF EAS models including fluctuation angles, diffusion times (τw), order parameters (S2), and correlation times (τc,1exp). Lower order parameters indicate sites with more dynamics. Projection of B) order parameters (S2) and C) correlation times (τc,1exp) onto GB1. Mobile regions are colored red to yellow on both figures. Reproduced from J. z. R. Lewandowski, H. J. Sass, S. Grzesiek, M. Blackledge, L. Emsley, Journal of the American Chemical Society 2011. DOI: 10.1021/ja206815h. Copyright 2011 American Chemical Society.
Sub-Microsecond Motions
Separated local field (SLF) experiments such as DIPSHIFT enable the determination of jump rates or correlation times in the range 104 to 106 s−1 by quantitatively fitting the dipolar dephasing trajectories under the assumption of specific models of molecular motion.46 Reichert and co-workers applied DIPSHIFT experiments to imidazole methyl sulphonate, trimethylsulfoxonium iodide, and polymer 2-methoxy-5-(2’-ethylhexyloxy)-1,4-phenylenevinylene. The authors were able to measure an activation energy for imidazole flips in imidazole methyl sulphonate of 70 ± 5 kJ/mol. The motionally averaged dipolar coupling can be measured by a variety of methods in the solid state to determine the order parameter for molecular segments of interest. The addition of a heteronuclear recoupling and homonuclear decoupling method, such as T-MREV47 or phase-modulated Lee−Goldberg,48 to a 13C−13C 2D chemical shift spectrum creates a three dimensional experiment in which the third, dipolar 1H−13C dimension reports on the side chain order parameter.
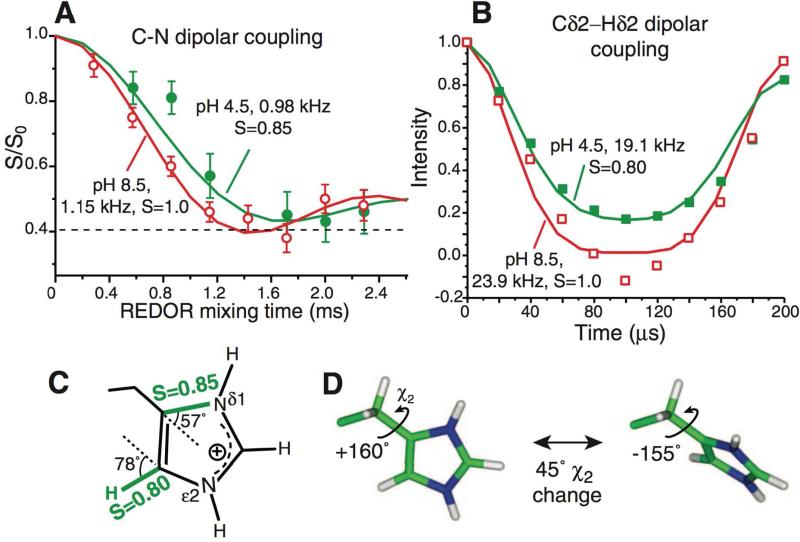
Hu and coworkers used these techniques to study influenza M2 in lipid bilayers.50 Order parameter measurements were used to determine the rate of histidine ring flips necessary for proton transport. The authors concluded that lowering the pH causes protonation at the Nδ1 position, allowing the pore to widen and the imidazole rings to flip. The measured order parameters confirm that at lower pH these residues are more dynamic (Figure 7). By measuring the dynamics at temperatures as low as 243 K the authors were able to put a lower bound on the energy barrier of > 59 kJ/mol.
Figure 7.
Motions in influenza M2 proton channels. Histidine sidechains reorient at low pH but remain static at high pH at physiological temperature. A) 303 K 13C-15N dipolar couplings. At pH 8.5, a 1:1 combination of Cγ-Nδ1 and Cε1-Nδ1 couplings reaches the rigid limit. At pH 4.5, the dominant Cγ-Nδ1 coupling is motionally averaged. B) Cδ2-Hδ2 coupling at 308K is motionally averaged at pH 4.5 but in the rigid limit at pH 8.5. C) Measured order parameters at pH 4.5. D) Two-site jump of imidazolium at low pH. A 45° reorientation around the Cβ-Cγ bond fits the observed order parameters. Reprinted with permission from F. Hu, W. Luo, M. Hong, Science 2010, 330. 505-508, DOI: 10.1126/science.1191714. Copyright 2010 The American Association for the Advancement of Science (AAAS).
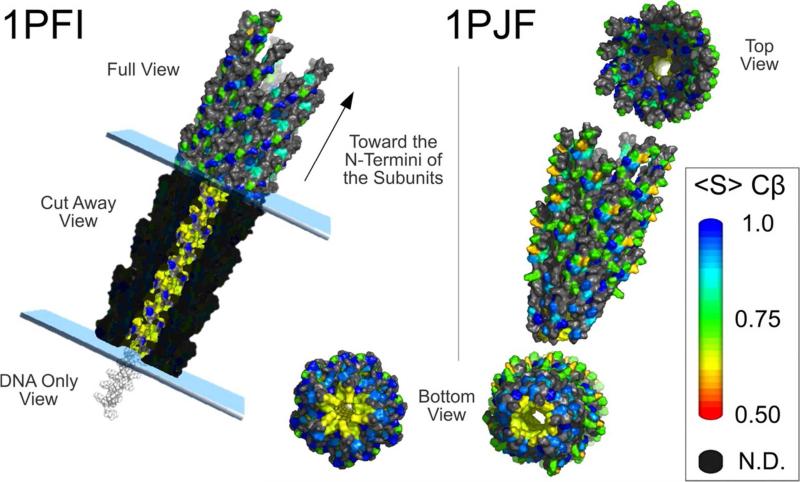
Lorieau and coworkers measured dipolar order parameters for 25 Cα, 22 Cβ, 10 Cγ, and 1 Cδ unique sites in the capsid of filamentous phage Pf1.51 Results indicate that while the backbone remains mostly static, the side chains exhibit a range of dynamics. Mapping these dynamics onto models of the phage structure show that mobile residues are at sites exposed to solvent as well as in the interior core where they could interact with the bacteriophage DNA (Figure 8).
Figure 8.
Views of Pf1 bacteriophage capsid structure models colored by Cβ side-chain order parameters. The two alternate structure models are displayed; the 1PFI model and the 1PJF model are for the low- and high-temperature forms, respectively. 1PJF was based primarily on NMR results, whereas 1PFI was the only model that includes DNA. The amino acid dynamics obtained in this study are for high-temperature conditions. Both models show a mixture of dynamic (green and yellow) and static (blue) sites mapping to the outer surface of the virion exposed to solvent. The exploded views show progressively more static sites from the outside of the virion into the buried protein–protein interface between overlapping subunits. Of particular importance, the cutaway view of the 1PFI image shows that side chains near the DNA are dynamic (yellow), despite the dense packing in this region. In both images the capsid has been pulled apart and tilted to show other views of the unexpectedly dynamic side chains of the C termini in the core region (green, yellow, and orange). The remarkably dynamic side chains include the side chains of Arg-44 and Lys-45. Reprinted with permission from J. L. Lorieau, L. A. Day, A. E. McDermott, Proceedings of the National Academy of Sciences of the United States of America 2008, 105. 10366-10371, DOI: 10.1073/pnas.0800405105. Copyright 2008 Proceedings of the National Academy of Sciences of the United States of America.
Nanosecond timescale motions can be distinguished from microsecond timescale by means of comparing NMR observables with MD simulations on the 100 to 200 ns timescale.52 From MD trajectories, the NMR chemical shifts, dipolar couplings and relaxation rates can be computed. Discrepancies may arise in cases where motional events are not captured by the MD simulation, consistent with ~500 ns to microsecond timescale motions.
Conclusions and Outlook
Here we have summarized recent advances in methodologies for examining dynamics in solid biomolecules. To date, these methods have been primarily applied to microcrystalline proteins and model organic compounds, but there are also prominent examples of applications to intact viral particles and oligomeric membrane peptide assemblies of biomedical relevance. With more powerful high-field solid-state NMR spectrometers and improved probe technologies, and corresponding improvements in sensitivity and resolution, the range of applications is being extended to larger, more biologically significant systems. The scope is sure to expand further with the availability of a new generation of NMR instrumentation and sample preparation technologies. For example, proton detection methods have enabled the implementation of CPMG and R1ρ measurements, and higher magnetic fields and MAS rates have enhanced the resolution and sensitivity for larger proteins.
The dynamics experiments covered in this review highlight the sensitivity to a broad range of motional timescales that can be measured with atomic resolution in biomolecules. The ability to quantify site-specific motions in proteins and biological assemblies that are not easily studied by any other technique makes SSNMR a powerful tool for understanding biological function. Continuing advances will further increase the utility of these techniques to quantify protein motions.
Biography
Chad M. Rienstra was born and raised in western Michigan and received his B.A. degree in chemistry from Macalester College (St. Paul, MN) in 1993. He completed his Ph.D. studies at the Massachusetts Institute of Technology in 1999, where he was a Howard Hughes Medical Institute Predoctoral Fellow with Robert G. Griffin. He was a National Institute of Health Postdoctoral Fellow in the laboratory of Ann E. McDermott at Columbia University. In 2002, he moved to the University of Illinois at Urbana–Champaign, where he is currently Professor of Chemistry. His research interests are in the development and application of magic-angle spinning solid-state NMR methods and instrumentation for protein structure determination, particularly involving non-crystalline aggregates, membrane proteins, and pharmaceutical formulations.
Eric D. Watt was raised in the upper peninsula of Michigan and received his B.S. in chemistry and biochemistry from the University of Michigan (Ann Arbor, MI) in 2005. He studied with Patrick J. Loria at Yale University, earning his Ph.D. in biophysical chemistry in 2012. He is currently an American Heart Association Postdoctoral Fellow at the University of Illinois at Urbana–Champaign, where he uses solution and magic-angle spinning solid-state NMR methods to study protein structure and dynamics.
REFERENCES
- 1.Comellas G, Rienstra CM. Annual review of biophysics. 2013;42:515–36. doi: 10.1146/annurev-biophys-083012-130356. DOI: 10.1146/annurev-biophys-083012-130356. [DOI] [PubMed] [Google Scholar]
- 2.Tang M, Comellas G, Rienstra CM. Acc Chem Res. 2013;46:2080–8. doi: 10.1021/ar4000168. DOI: 10.1021/ar4000168. [DOI] [PubMed] [Google Scholar]
- 3.McDermott A, Polenova T, Bockmann A, Zilm KW, Paulson EK, Martin RW, Montelione GT. Journal of Biomolecular NMR. 2000;16:209–19. doi: 10.1023/a:1008391625633. [DOI] [PubMed] [Google Scholar]
- 4.Pauli J, Baldus M, van Rossum B, de Groot H, Oschkinat H. ChemBioChem. 2001;2:101–110. doi: 10.1002/1439-7633(20010401)2:4<272::AID-CBIC272>3.0.CO;2-2. [DOI] [PubMed] [Google Scholar]
- 5.Castellani F, van Rossum B, Diehl A, Schubert M, Rehbein K, Oschkinat H. Nature. 2002;420:98–102. doi: 10.1038/nature01070. [DOI] [PubMed] [Google Scholar]
- 6.Igumenova TI, McDermott AE, Zilm KW, Martin RW, Paulson EK, Wand AJ. Journal of the American Chemical Society. 2004;126:6720–6727. doi: 10.1021/ja030547o. [DOI] [PubMed] [Google Scholar]
- 7.Igumenova TI, Wand AJ, McDermott AE. J. Am. Chem. Soc. 2004;126:5323–5331. doi: 10.1021/ja030546w. [DOI] [PubMed] [Google Scholar]
- 8.Lange A, Becker S, Seidel K, Giller K, Pongs O, Baldus M. Angew. Chem.-Int. Edit. 2005;44:2089–2092. doi: 10.1002/anie.200462516. [DOI] [PubMed] [Google Scholar]
- 9.Franks WT, Zhou DH, Wylie BJ, Money BG, Graesser DT, Frericks HL, Sahota G, Rienstra CM. Journal of the American Chemical Society. 2005;127:12291–12305. doi: 10.1021/ja044497e. DOI: 10.1021/ja044497e. [DOI] [PubMed] [Google Scholar]
- 10.Franks WT, Wylie BJ, Schmidt HLF, Nieuwkoop AJ, Mayrhofer RM, Shah GJ, Graesser DT, Rienstra CM. Proceedings of the National Academy of Sciences of the United States of America. 2008;105:4621–4626. doi: 10.1073/pnas.0712393105. [DOI] [PMC free article] [PubMed] [Google Scholar]
- 11.Wylie BJ, Sperling LJ, Nieuwkoop AJ, Franks WT, Oldfield E, Rienstra CM. Proc Natl Acad Sci U S A. 2011;108:16974–9. doi: 10.1073/pnas.1103728108. DOI: 10.1073/pnas.1103728108. [DOI] [PMC free article] [PubMed] [Google Scholar]
- 12.Wasmer C, Lange A, Van Melckebeke H, Siemer AB, Riek R, Meier BH. Science. 2008;319:1523–1526. doi: 10.1126/science.1151839. [DOI] [PubMed] [Google Scholar]
- 13.Jehle S, Rajagopal P, Bardiaux B, Markovic S, Kuhne R, Stout JR, Higman VA, Klevit RE, van Rossum BJ, Oschkinat H. Nat Struct Mol Biol. 1891;201017:1037–U1. doi: 10.1038/nsmb.1891. DOI: Doi 10.1038/Nsmb. [DOI] [PMC free article] [PubMed] [Google Scholar]
- 14.Cady SD, Schmidt-Rohr K, Wang J, Soto CS, Degrado WF, Hong M. Nature. 2010;463:689–92. doi: 10.1038/nature08722. DOI: 10.1038/nature08722. [DOI] [PMC free article] [PubMed] [Google Scholar]
- 15.Shahid SA, Bardiaux B, Franks WT, Krabben L, Habeck M, van Rossum BJ, Linke D. Nat Methods. 2012;9:1212–7. doi: 10.1038/nmeth.2248. DOI: 10.1038/nmeth.2248. [DOI] [PubMed] [Google Scholar]
- 16.Wang S, Munro RA, Shi L, Kawamura I, Okitsu T, Wada A, Kim SY, Jung KH, Brown LS, Ladizhansky V. Nat Methods. 2013;10:1007–12. doi: 10.1038/nmeth.2635. DOI: 10.1038/nmeth.2635. [DOI] [PubMed] [Google Scholar]
- 17.Fitzpatrick AW, Debelouchina GT, Bayro MJ, Clare DK, Caporini MA, Bajaj VS, Jaroniec CP, Wang L, Ladizhansky V, Muller SA, MacPhee CE, Waudby CA, Mott HR, De Simone A, Knowles TP, Saibil HR, Vendruscolo M, Orlova EV, Griffin RG, Dobson CM. Proc Natl Acad Sci U S A. 2013;110:5468–73. doi: 10.1073/pnas.1219476110. DOI: 10.1073/pnas.1219476110. [DOI] [PMC free article] [PubMed] [Google Scholar]
- 18.Lu JX, Qiang W, Yau WM, Schwieters CD, Meredith SC, Tycko R. Cell. 2013154:1257–68. doi: 10.1016/j.cell.2013.08.035. DOI: 10.1016/j.cell.2013.08.035. [DOI] [PMC free article] [PubMed] [Google Scholar]
- 19.Tycko R. Acc Chem Res. 201346:1923–32. doi: 10.1021/ar300358z. DOI: 10.1021/ar300358z. [DOI] [PMC free article] [PubMed] [Google Scholar]
- 20.Ullrich SJ, Hellmich UA, Ullrich S, Glaubitz C. Nature chemical biology. 2011;7:263–70. doi: 10.1038/nchembio.543. DOI: 10.1038/nchembio.543. [DOI] [PubMed] [Google Scholar]
- 21.Chimon S, Ishii Y. J Am Chem Soc. 2005;127:13472–3. doi: 10.1021/ja054039l. DOI: 10.1021/ja054039l. [DOI] [PubMed] [Google Scholar]
- 22.Chimon S, Shaibat MA, Jones CR, Calero DC, Aizezi B, Ishii Y. Nat Struct Mol Biol. 2007;14:1157–64. doi: 10.1038/nsmb1345. DOI: 10.1038/nsmb1345. [DOI] [PubMed] [Google Scholar]
- 23.Comellas G, Lemkau LR, Zhou DH, George JM, Rienstra CM. J Am Chem Soc. 2012;134:5090–9. doi: 10.1021/ja209019s. DOI: 10.1021/ja209019s. [DOI] [PMC free article] [PubMed] [Google Scholar]
- 24.deAzevedo ER, Hu WG, Bonagamba TJ, Schmidt-Rohr K. Journal of the American Chemical Society. 1999;121:8411–8412. [Google Scholar]
- 25.deAzevedo ER, Hu WG, Bonagamba TJ, Schmidt-Rohr K. J Chem Phys. 2000;112:8988–9001. [Google Scholar]
- 26.Krushelnitsky A, deAzevedo E, Linser R, Reif B, Saalwächter K, Reichert D. Journal of the American Chemical Society. 2009;131:12097–12099. doi: 10.1021/ja9038888. DOI: 10.1021/ja9038888. [DOI] [PubMed] [Google Scholar]
- 27.Buffy JJ, Waring AJ, Hong M. J Am Chem Soc. 2005;127:4477–83. doi: 10.1021/ja043621r. DOI: 10.1021/ja043621r. [DOI] [PubMed] [Google Scholar]
- 28.Luo W, Hong M. Journal of the American Chemical Society. 2006;128:7242–51. doi: 10.1021/ja0603406. [DOI] [PubMed] [Google Scholar]
- 29.Li W, McDermott A. Journal of magnetic resonance (San Diego, Calif : 1997) 2012;222:74–80. doi: 10.1016/j.jmr.2012.05.019. DOI: 10.1016/j.jmr.2012.05.019. [DOI] [PMC free article] [PubMed] [Google Scholar]
- 30.Carr H, Purcell E. Physical Review. 1954;94:630–638. DOI: 10.1103/PhysRev.94.630. [Google Scholar]
- 31.Meiboom S, Gill D. Review of scientific instruments. 1958;29:688–691. [Google Scholar]
- 32.Baldwin AJ, Religa TL, Hansen DF, Bouvignies G, Kay LE. Journal of the American Chemical Society. 2010;132:10992–10995. doi: 10.1021/ja104578n. DOI: 10.1021/ja104578n. [DOI] [PubMed] [Google Scholar]
- 33.Beach H, Cole R, Gill ML, Loria JP. Journal of the American Chemical Society. 2005;127:9167–9176. doi: 10.1021/ja0514949. DOI: 10.1021/ja0514949. [DOI] [PubMed] [Google Scholar]
- 34.Loria JP, Rance M, Palmer A. Journal of the American Chemical Society. 1999;121:2331–2332. [Google Scholar]
- 35.Hansen DF, Vallurupalli P, Kay LE. J Phys Chem B. 2008;112:5898–904. doi: 10.1021/jp074793o. DOI: 10.1021/jp074793o. [DOI] [PubMed] [Google Scholar]
- 36.Mulder FA, Mittermaier A, Hon B, Dahlquist FW, Kay LE. Nat Struct Biol. 2001;8:932–935. doi: 10.1038/nsb1101-932. DOI: 10.1038/nsb1101-932. [DOI] [PubMed] [Google Scholar]
- 37.Watt ED, Shimada H, Kovrigin EL, Loria JP. Proceedings of the National Academy of Sciences of the United States of America. 2007;104:11981–11986. doi: 10.1073/pnas.0702551104. DOI: 10.1073/pnas.0702551104. [DOI] [PMC free article] [PubMed] [Google Scholar]
- 38.Boehr DD, McElheny D, Dyson HJ, Wright PE. Science. 2006;313:1638–1642. doi: 10.1126/science.1130258. DOI: 10.1126/science.1130258. [DOI] [PubMed] [Google Scholar]
- 39.Loria JP, Berlow RB, Watt ED. Accounts of chemical research. 2008;41:214–221. doi: 10.1021/ar700132n. DOI: 10.1021/ar700132n. [DOI] [PubMed] [Google Scholar]
- 40.Palmer AG. Chemical reviews. 2004;104:3623–3640. doi: 10.1021/cr030413t. DOI: 10.1021/cr030413t. [DOI] [PubMed] [Google Scholar]
- 41.Kempf JG, Loria JP. Methods in molecular biology (Clifton, NJ) 2004;278:185–231. doi: 10.1385/1-59259-809-9:185. DOI: 10.1385/1-59259-809-9:185. [DOI] [PubMed] [Google Scholar]
- 42.Baldwin AJ, Kay LE. Nature chemical biology. 2009;5:808–814. doi: 10.1038/nchembio.238. DOI: 10.1038/nchembio.238. [DOI] [PubMed] [Google Scholar]
- 43.Tollinger M, Sivertsen AC, Meier BH, Ernst M, Schanda P. Journal of the American Chemical Society. 2012;134:14800–7. doi: 10.1021/ja303591y. DOI: 10.1021/ja303591y. [DOI] [PMC free article] [PubMed] [Google Scholar]
- 44.Quinn CM, McDermott AE. Journal of Magnetic Resonance. 2012222:1–7. doi: 10.1016/j.jmr.2012.05.014. DOI: 10.1016/j.jmr.2012.05.014. [DOI] [PMC free article] [PubMed] [Google Scholar]
- 45.Lewandowski J. z. R., Sass HJ, Grzesiek S, Blackledge M, Emsley L. Journal of the American Chemical Society. 2011;133:16762–5. doi: 10.1021/ja206815h. DOI: 10.1021/ja206815h. [DOI] [PubMed] [Google Scholar]
- 46.deAzevedo ER, Saalwächter K, Pascui O, de Souza AA, Bonagamba TJ, Reichert D. The Journal of Chemical Physics. 2008;128:104505. doi: 10.1063/1.2831798. DOI: 10.1063/1.2831798. [DOI] [PubMed] [Google Scholar]
- 47.Hohwy M, Jaroniec CP, Reif B, Rienstra CM, Griffin RG. Journal of the American Chemical Society. 2000;122:3218–3219. doi: 10.1021/ja020802p. DOI: 10.1021/ja9913737. [DOI] [PubMed] [Google Scholar]
- 48.Vinogradov E, Madhu PK, Vega S. J Chem Phys. 2001;115:8983–9000. [Google Scholar]
- 49.Lorieau JL, McDermott AE. Journal of the American Chemical Society. 2006;128:11505–11512. doi: 10.1021/ja062443u. DOI: 10.1021/ja062443u. [DOI] [PubMed] [Google Scholar]
- 50.Hu F, Luo W, Hong M. Science. 2010;330:505–508. doi: 10.1126/science.1191714. DOI: 10.1126/science.1191714. [DOI] [PMC free article] [PubMed] [Google Scholar]
- 51.Lorieau JL, Day LA, McDermott AE. Proceedings of the National Academy of Sciences of the United States of America. 2008;105:10366–10371. doi: 10.1073/pnas.0800405105. DOI: 10.1073/pnas.0800405105. [DOI] [PMC free article] [PubMed] [Google Scholar]
- 52.Mollica L, Baias M, Lewandowski J. z. R., Wylie BJ, Sperling LJ, Rienstra CM, Emsley L, Blackledge M. The Journal of Physical Chemistry Letters. 2012;3:3657–3662. doi: 10.1021/jz3016233. DOI: 10.1021/jz3016233. [DOI] [PubMed] [Google Scholar]


