

In this paper, the authors analyze how the secondary structure of primary microRNAs (pri-miRNAs) affects their processing by the Microprocessor. They show that pri-miRNAs with central mismatches in the upper stem are more sensitive to changes in Drosha level. They conclude that the secondary structure of pri-miRNA affects Drosha processing efficiency when Drosha is limiting. This raises the possibility that differentiating cells may use this as a means of miRNA regulation.
Keywords: DGCR8, Drosha, Microprocessor, secondary structure, microRNA
Abstract
microRNAs (miRNAs) are crucial for cellular development and homeostasis. In order to better understand regulation of miRNA biosynthesis, we studied cleavage of primary miRNAs by Drosha. While Drosha knockdown triggers an expected decrease of many mature miRNAs in human embryonic stem cells (hESC), a subset of miRNAs are not reduced. Statistical analysis of miRNA secondary structure and fold change of expression in response to Drosha knockdown showed that absence of mismatches in the central region of the hairpin, 5 and 9–12 nt from the Drosha cutting site conferred decreased sensitivity to Drosha knockdown. This suggests that, when limiting, Drosha processes miRNAs without mismatches more efficiently than mismatched miRNAs. This is important because Drosha expression changes over cellular development and the fold change of expression for miRNAs with mismatches in the central region correlates with Drosha levels. To examine the biochemical relationship directly, we overexpressed structural variants of miRNA-145, miRNA-137, miRNA-9, and miRNA-200b in HeLa cells with and without Drosha knockdown; for these miRNAs, elimination of mismatches in the central region increased, and addition of mismatches decreased their expression in an in vitro assay and in cells with low Drosha expression. Change in Drosha expression can be a biologically relevant mechanism by which eukaryotic cells control miRNA profiles. This phenomenon may explain the impact of point mutations outside the seed region of certain miRNAs.
INTRODUCTION
MicroRNAs (miRNA) are a group of short, noncoding RNAs that bind target mRNAs by incomplete complementarity to either inhibit the translation or reduce the stability of target mRNAs (Kim and Nam 2006). miRNAs are involved with the onset of various diseases, immunoregulation, angiogenesis, neural growth, and stem cell renewal and maintenance (Bartel 2004; Hatfield et al. 2005; Stark et al. 2005; Cullen 2006; Mattick and Makunin 2006; Shcherbata et al. 2006; Kuehbacher et al. 2007; Stadler and Ruohola-Baker 2008; Anokye-Danso et al. 2011). Currently 1872 human microRNAs have been identified and many of these are evolutionarily conserved (Griffiths-Jones et al. 2006).
miRNA biogenesis is regulated on multiple levels (Kuppusamy et al. 2013). Individual miRNA expression levels vary between tissues (Lagos-Quintana et al. 2001), and while transcription of primary miRNAs (pri-miRNAs) is regulated by transcription factors, e.g. c-Myc (O'Donnell et al. 2005), this variability is found even within polycistronic miRNAs transcribed as a single unit (Davis and Hata 2009). pri-miRNAs are cleaved by the Microprocessor, which principally consists of Drosha and DGCR8 (Lee et al. 2003; Gregory et al. 2004). Canonically, Drosha and DGCR8 bind pri-miRNAs, and Drosha cleaves pri-miRNAs 11 bp from the base of the stem and liberates a structure known as the precursor microRNA (pre-miRNA), which is subsequently exported to the cytoplasm and processed into mature miRNA (Zeng et al. 2005). The cleavage by the Microprocessor complex is regulated by several components that are part of the Microprocessor, such as the DEAD-box helicases p68 and p72, which have been proposed to stabilize the Microprocessor complex (Fukuda et al. 2007). The Microprocessor can include additional proteins in a signal-dependent fashion, such as SMAD proteins, which have been found to selectively up-regulate certain miRNAs, e.g., miR-21 (Davis et al. 2008). Furthermore, autoregulation and Ago involvement has been observed at the let-7 Drosha processing step (Zisoulis et al. 2012). A group of miRNAs named mirtrons are processed by the spliceosome (Ruby et al. 2007), making them independent of the canonical miRNA biogenesis pathway where the pri-miRNA is cleaved by the Microprocessor.
In this study we describe Drosha expression levels as a mechanism to selectively regulate a group of miRNAs with a particular secondary structure. The fold change of expression of miRNAs with mismatches located 5 and 9–12 nt from the Drosha cutting site is greater than with more rigid miRNAs, when Drosha levels are low. This can be observed in cells with shRNA knockdown of Drosha (DroshaKD), in tissues with different Drosha levels and in in vitro assays, and suggests a mechanism where the cell can selectively alter the levels of mismatched miRNAs through changes in Drosha expression.
RESULTS
Differences in change of miRNA expression due to Drosha knockdown in hESC (H1) correlate with differences in predicted pri-miRNA secondary structures
Previous research in the laboratory used H1 human embryonic stem cells with DroshaKD to study the response to a general decrease of miRNAs in stem cells (Bar et al. 2008; Qi et al. 2009; Stadler et al. 2010). As expected, qPCR of 220 microRNAs in Drosha KD hESCs showed a general decrease of miRNA expression. However, a group of miRNAs was still processed efficiently, despite the threefold reduction of Drosha expression (Fig. 1). It seems logical that mirtrons (which bypass Drosha processing) would be unaffected by Drosha knockdown; however, few mirtrons are known (Berezikov et al. 2007) and none of the known mirtrons are in the 220 miRNAs assayed by qPCR. mirtrons are generally located within small introns, but no statistically significant correlation could be verified between genomic location and fold change of miRNA expression (P = 0.27); the mean fold change was 2.8 for intergenic miRNAs and 2.4 for the intronic miRNAs (Fig. 2).
FIGURE 1.

Fold change of miRNA expression between Drosha knockdown and control H1 hESC for 220 miRNAs assayed by qPCR. Arrow marks median (0.495).
FIGURE 2.
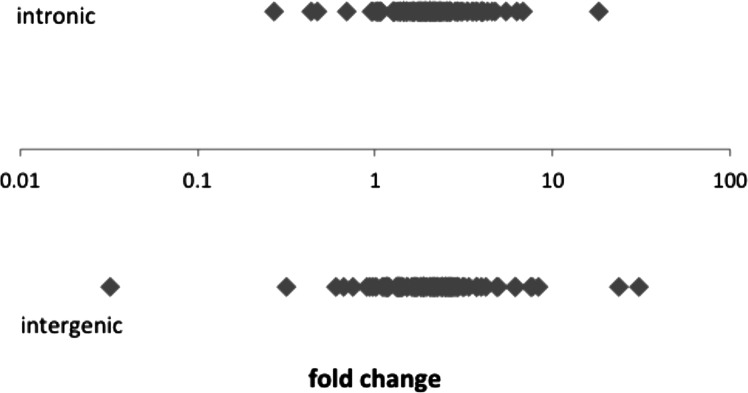
Fold change of expression for miRNAs between Drosha knockdown and control H1 hESC for 220 miRNAs assayed by qPCR and grouped by genomic origin (intergenic/intronic).
Given that bulges in the stem of RNA hairpins seem to prevent processing by the miRNA pathway in general, and that others have shown Drosha to differentially process miRNAs based on structural features (Han et al. 2006; Ritchie et al. 2007; Feng et al. 2011), it seems logical that differences in the number of mismatches in miRNA hairpins would alter their interaction with the Microprocessor, and could explain the variation of fold change in response to Drosha knockdown. In order to compare the three-dimensional shape of the pri-miRNAs in our data set, we developed a novel method of assigning positions within the miRNA hairpin in order to give a better representation of the mismatch locations relative to each other and the Drosha cutting site in three-dimensional space (Fig. 3A). Position assignment and mismatch counting was performed by defining the location of each mismatch in terms of distance from the Drosha cutting site using predicted secondary structure, counting asymmetric mismatches as the length of the shorter strand; this is different from previously described methods to calculate mismatch positions in pri-miRNAs, where asymmetry was not taken into account (Han et al. 2006).
FIGURE 3.

Counting of mismatches in miRNAs in H1 cells with DroshaKD and control cells. (A) Positions regarded as mismatched are marked by numerals in light gray. (B) Mismatches summed for positions counted from the Drosha cutting site for a set of 202 miRNAs split in two equal groups based on fold change in the Drosha knockdown. (C) P-values were calculated using Pearson's χ2 test with Yates’ continuity correction, giving log P-values less than −2 for positions 5, 10, 11, and 12 for the full data set split in half (dark gray) and for the quartiles at the extreme ends with sample size extrapolated to that of the full data set.
The secondary structures for the 220 miRNAs from the H1 data set were calculated using the ViennaRNA package (Hofacker et al. 1994), and exact locations of cutting sites were found through miRBase. The data set contained 220 miRNAs, and we selected 202 by sorting out any miRNAs with ambiguous secondary structure predictions. The data set was split in half based on fold change (Fig. 1, arrow), and the sums of mismatches at each nucleotide position were compared between the two groups. The summation revealed that miRNAs with a high fold change when Drosha levels were reduced had more mismatches in position(s) 5 and 10–12 than miRNAs with low fold change, and that these differences were statistically significant (Fig. 3B,C). A knockdown of Dicer did not result in the same trend (Supplemental Fig. 1). In addition, P-values were calculated for the quartiles at the extreme ends of the DroshaKD data set, with a sample size extrapolated to that of the total data set (Fig. 3C). For subsequent experiments and analysis position 9 was also included since it follows the same trend as positions 10–12. This takes into account any lack of specificity in our method of assigning positions.
Correlation of Drosha expression and miRNA secondary structure profile in mature tissues
Having shown that pri-miRNA processing by Drosha is affected by the pri-miRNA secondary structure in cell culture we also investigated whether this mechanism is used in vivo as a mechanism to selectively regulate groups of miRNAs based on secondary structure. Since Drosha expression alters the expression of miRNAs with bulges in the central region more than miRNAs without (Fig. 3), and because of the crucial role of miRNAs for cellular biology, we were interested in determining whether or not Drosha expression levels vary across cell type or according to developmental stage in mammals. To find naturally occurring examples of Drosha variation, we used the Gene Expression Omnibus (GEO) to find microarray data of relevant gene expression in mature and differentiating mouse tissues.
From the GEO expression data sets GDS3052 and GDS3142, we extracted and analyzed expression data for Drosha and common housekeeping genes in multiple mouse tissues. In both data sets the expression of Drosha is dramatically lower in the liver and submaxillary/salivary gland (four- to 10-fold) than in brain tissues when normalized to EEF2 (Fig. 4A,B). To test whether the difference in Drosha expression was dependent on the housekeeping gene used for normalization, we analyzed the fold change of expression between liver and brain tissues for five housekeeping genes; EEF2, RPL13A, SDHA, TBP, and UBC. The data revealed that the expression change for Drosha is greater than variation among known housekeeping genes (Fig. 4C,D), showing that Drosha is differentially expressed regardless of the housekeeping gene used for normalization.
FIGURE 4.

Differential expression of Drosha in mouse tissues. (A,B) Expression levels in Drosha in mouse tissues, normalized to EEF2; GEO(GDS3052) (A), GEO (GDS3142) (B). (C,D) Fold change of Drosha expression in liver, compared with the average expression of EEF2, RPL13A, SDHA, TBP, and UBC; GDS3052 (C), GDS3142 (D). (E) qPCR analysis of Drosha mRNA levels in mouse brain and liver. (F) Quantification of Drosha protein levels show a 9.6-fold increase in brain compared with liver tissue (P < 0.05). (G) Western blot of Drosha protein in mouse brain and liver normalized to total protein (Coomassie Blue). (H) Average expression of miRNAs with different numbers of mismatches in the 5, 9–12 region in mouse liver and brain (Takada et al. 2006).
We validated the differential expression of Drosha in mouse brain and liver by qPCR, normalized to UBC and verified that Drosha expression was 5.6-fold higher in the brain than in the liver (Fig. 4E) (n = 3, P < 0.01). Furthermore, Western blotting revealed 9.6- or 3.2-fold higher Drosha protein expression in brain than in liver when normalized to total protein or to β-actin expression, respectively (Coomassie Blue staining or to β-actin Western) (Fig. 4F,G; Supplemental Fig. 2).
Having validated that Drosha levels are higher in brain than in liver, we were interested in analyzing whether miRNA expression varied according to the number of mismatches in the 9–12-nt region of the miRNAs in the two tissues. We analyzed miRNA expression data from mouse brain and liver (Takada et al. 2006) and found that miRNAs with mismatches in positions 5 and 9–12 are enriched in brain but not in liver and that the difference was larger the more mismatches that were present (Fig. 4H), supporting the hypothesis that miRNAs with central mismatches are not processed efficiently when Drosha is limiting. This trend for miRNA expression did not correlate with mismatches in the other positions (Supplemental Fig. 3).
Coordination of Drosha and miRNA expression by microRNA secondary structure during T-cell development and neuronal differentiation
Since Drosha levels vary between mature tissue types and expression levels of miRNAs with mismatches in the central region are high relative to rigid miRNAs when Drosha levels are high, we wanted to test whether this mechanism is used to dynamically alter the miRNA expression profiles during cell development. In order to establish this relationship we first analyzed Drosha expression levels during T-cell differentiation and found a threefold decrease in Drosha expression from double-negative T-cells (DN3) to CD4+ cells (Fig. 5A; Chong et al. 2010). In neuronal lineage, we compared Drosha and Eef2 expression during the proliferation of mouse neural progenitors (GDS3442) and showed a significant decrease (P < 0.01) in Drosha expression as the cells proliferate and mature in embryonic mouse brains (Fig. 5B).
FIGURE 5.

Drosha levels and miRNA profiles during T-cell differentiation. (A) Drosha levels in T-cells measured by qPCR, normalized to β-actin (Chong et al. 2010). (B) Drosha levels in developing mouse brain (GDS3442), normalized to EEF2. (C) Ratio (CD4SP/DN3) of average expression for each miRNA group based on number of mismatches in the 5, 9–12 region.
We further tested whether the miRNA groups correlate with the Drosha levels and found that the lower Drosha expression in CD4+ compared with DN3 cells correlates with lower expression of miRNAs with five mismatches in the region 5, 9–12 nt from the Drosha cutting site and the ratio of expression between DN3 and CD4+ for miRNAs grouped by the number of mismatches in positions 5 and 9–12 shows that the difference in Drosha expression between DN3 and CD4+ cells correlates with a decrease in miRNA expression based on number of mismatches (Fig. 5C). In DN3 cells Drosha levels are relatively high, and mismatched miRNAs are highly expressed; in CD4+ cells Drosha levels are low, and predominantly rigid miRNAs are produced. This agrees with previous results that when Drosha levels are low the levels of mature miRNAs generated from mismatched hairpins go down disproportionately compared with rigid miRNAs (Figs. 3B,C, 4C,D). Mismatch counting of the complete hairpin, to control for the difference being local to the 5, 9–12 region, did not result in a similar trend (Supplemental Fig. 4).
We also analyzed Drosha levels in hESC derived neuronal differentiation process. RNAseq data from early neuronal differentiation of H1 hESC shows an increase in Drosha, with a greater change occuring over day 0 to day 6 than over day 6 to day 12 (Fig. 6A). Canonical and noncanonical components of the miRNA biogenesis pathway have a significantly greater change in expression between days 0 and 6 than between days 6 and 12 of the neural differentiation protocol (Supplemental Fig. 5). miRNA microarray data from the same period, day 0 to day 6, when Drosha levels increase, shows that the miRNAs with positive fold change have significantly more mismatches in the region(s) 5, 9–12 than miRNAs with negative fold change (Fig. 6B). Between days 6 and 12, when changes in Drosha expression are less, no significant difference in number of mismatches can be found between miRNAs grouped by fold change (Fig. 6C). This shows that when Drosha levels increase in early neuronal differentiation the expression of miRNAs generated from hairpins with mismatches in the 5, 9–12 region go up relative to more rigid hairpins, and when Drosha levels stabilize mismatched miRNAs no longer behave differently from rigid ones (Fig. 6B,C). Whether increasing or decreasing during cell development, changes in Drosha levels affect groups of miRNAs based on their secondary structure. To control for the difference being local to the 5, 9–12 region, mismatches were counted in the remaining positions for a subset of 166 miRNAs, where no similar trend was observed (Supplemental Fig. 6).
FIGURE 6.

Changes in gene expression levels during neuronal differentiation. (A) Drosha expression in neuronal differentiation of H1 hESC into Pax6+ neural cells (RNAseq). (B) Number of mismatches in miRNAs with high and low fold change through days 0–6 (multiArray). (C) Number of mismatches in miRNAs with high and low fold change through days 6–12 (multiArray).
Biochemical validation of the relationship between pri-miRNA secondary structure, miRNA expression, and Drosha expression in vivo
Given the spatial and developmental heterogeneity of Drosha expression and its correlation with miRNA expression based on secondary structure (Figs. 3–6), we hypothesized that mismatches in a miRNA hairpin ∼9–12 nt from the Drosha cutting site would confer increased sensitivity to low levels of Drosha. Conversely, the absence of mismatches would confer decreased sensitivity to Drosha expression. In order to test our hypothesis, we compared the relative overexpression of four miRNAs in two HeLa cell lines; one with a stable Drosha knockdown, the other transduced with a control virus (Control). Drosha protein levels were significantly reduced in the KD line (fivefold reduction; Supplemental Fig. 7) resulting in down-regulation of endogenous miRNAs (Supplemental Fig. 8). miR-145 and miR-200b were selected for overexpression in these cells due to the clear presence of mismatches 9–12 nt from the Drosha cutting site (Fig. 7, left panels), making them ideal candidates to represent miRNAs at one end of the spectrum with regard to secondary structure. For the same reason, miR-137 and miR-9-1 were selected due to the clear absence of mismatches 9–12 nt from the Drosha cutting site (Fig. 7, right panels). Modifications of the 9–12-nt region were designed to either insert or remove mismatches without disrupting the rest of the hairpin, while preserving the primary sequence of the mature miRNA, changing each miRNA from one extreme structure to the other while allowing for detection by traditional methods (Fig. 7, all four panels). Since alteration of the secondary structure close to the Drosha cutting site has previously been shown to completely disrupt processing and may affect strand selection during RISC loading, we did not modify this region (Zeng and Cullen 2003; Noland et al. 2011) We measured fold change of miRNA overexpression (KD/ctrl; referred to as “relative overexpression”) by qPCR to determine whether or not mismatches in the central region determine sensitivity to Drosha in vivo.
FIGURE 7.

Predicted structures of wild-type and modified hairpins of hsa-mir-145, hsa-mir-137, hsa-mir-9-1, and hsa-mir-200b, demonstrating canonical “mismatched” and “rigid” miRNA hairpins. Entropy curves of the nucleotide sequence, starting at the 5′ end, indicate stability changes being local to the changed regions.
For miR-145, mutation from a mismatched to a rigid stem increased relative overexpression by 1.52-fold, P < 0.01 (Fig. 8A). For miR-137, mutation from a rigid stem to a mismatched stem decreased relative over expression by 3.84-fold, P < 0.05 (Fig. 8B). For miR-200b, mutation from a mismatched to a rigid stem increased relative overexpression by 3.76-fold, P = 0.05 (Fig. 8C). For miR-9-1, mutation to create mismatches in the 9–12 nt region decreased relative overexpression by 4.66-fold (Fig. 8D). These data show that the addition or removal of mismatches did affect the level of miRNA overexpression in DroshaKD compared with control, with more mismatches generating a lower ratio than the corresponding miRNA without mismatches 9–12 nt from the Drosha cutting site.
FIGURE 8.

Fold change of overexpression levels of wild-type and mutated versions of miR-145 (A), miR-137 (B), miR-200b (C), and miR-9 (D) between Drosha knockdown and control HeLa cells, assayed by TaqMan probes and normalized to RNU66. (n = 3.) Transfection efficiency was accounted for by SYBRgreen qPCR of the bleomycin resistance gene in the vector, normalized to GAPDH and subtracted from the ▵Ct values from the TaqMan assays. Final normalization was made to the fold change of overexpression for each wt construct. Statistical significance was calculated using a Student's t-test, resulting in P-values of <0.01 (mir-145), <0.05 (mir-137), =0.05 (mir-200b).
In vitro processing of modified miRNAs
Having shown the differential processing of rigid and mismatched miRNAs in vivo, we proceeded by testing this relationship in vitro. Linearized plasmids containing wild-type (wt) and modified versions of mir-137 (203 nt) and mir-200b (430 nt) were in vitro transcribed and radiolabeled, followed by Drosha processing for 10, 30, and 90 min using nuclear extract from 293T cells. The resulting RNA was purified and visualized on a 10% urea-polyacrylamide gel (Fig. 9A). Intensities of the bands corresponding to the pre-miRNA were quantified and normalized to the intensities of the regions containing pri-miRNA. Negative controls using only protein buffer and no lysate showed no detection in the bands used to quantify pre-miRNAs. Calculation of expression ratios of normalized 10-min and 90-min samples showed a consistently higher ratio for rigid miRNAs than for their mismatched counterparts (Fig. 9B). While the fold changes are smaller in in vitro assay compared with in vivo experiments (cf. Fig. 8B,C and Fig. 9), the trend is the same, consistently showing that mismatched miRNAs have a higher sensitivity to reduced Drosha activity.
FIGURE 9.

In vitro processing of miRNAs using nuclear extract. (A) In vitro-transcribed miRNAs, processed by 293T cell nuclear extract and visualized on a 10% urea-polyacrylamide gel. Bands corresponding to processed pre-miRNAs are marked in gray box, and areas containing pri-miRNAs used for normalization are labeled with black box. (B) 10/90-min ratios of quantified pre-miRNA levels normalized to each respective pri-miRNA levels as indicated in A.
DISCUSSION
Here we show that when Drosha levels change, the change in expression levels of miRNAs with mismatches in the hairpin, 9–12 nt from the Drosha cutting site is greater than the change in expression levels of miRNAs that lack mismatches in the same region. We have found this correlation in mature mouse tissues and during development. We also successfully altered the sensitivity to changes in Drosha expression for four different miRNAs by changing their secondary structure. The results from the in vitro assay showed the same trend as the in vivo experiments. Overall, these data suggest that secondary structure of miRNA affects miRNA's processing efficiency when Drosha is limiting and that differentiating cells may use this as a means of miRNA regulation.
Previous work on standardizing the miRNA secondary structure and cataloging mismatch locations has used the approach of assigning mismatch positions for each strand of the hairpin separately (Han et al. 2006). In order to improve the representation of mismatch locations in three-dimensional space, we further developed the mismatch mapping technique by taking both strands into consideration simultaneously in the analysis. This counting method resulted in a very consistent measurement of 21 nt between the Drosha and Dicer cutting sites, which is consistent with previous reports indicating that Dicer processing of pre-miRNAs with asymmetric mismatches seems to explain the heterogeneity of length observed among mature miRNAs, and is also consistent with the idea that Dicer processing utilizes “molecular rulers” which are size invariant (Starega-Roslan et al. 2010), which indicates that our counting method provides a good representation of the shape of the miRNA.
A relationship between secondary structure and pri-miRNA processing is well established, but no previous studies have focused specifically on the 9–12-nt region within the pre-miRNA portion of the pri-miRNA and processing. pri-miRNAs are generally shorter, have fewer bulges and internal loops, and overall less mismatched bases within the stem region than non-miRNA-generating RNA transcripts, implying that secondary structure prediction is a reliable predictor of Drosha and Dicer processing (Ritchie et al. 2007). Furthermore, the secondary structure of pri-miRNAs controls the specificity and efficiency of Drosha processing, in vitro and in vivo, suggesting that Drosha substrate specificity may act as a mechanism for global regulation of miRNA expression profiles (Feng et al. 2011). On the other hand, it has also been shown that polymorphisms in pri-miRNA secondary structure do not affect processing (Diederichs and Haber 2006), but only one of the examined single nucleotide polymorphisms (SNPs) was within the pre-miRNA portion of the pri-miRNA structure. In a wider search of human miRNA genes, it was determined that SNPs did affect the processing and function of miRNAs and most of these SNPs were found between the Dicer and Drosha cutting sites (Sun et al. 2009). The results presented herein could explain the significance of SNPs outside the seed region, but within the pre-miRNA structure, of some cancer and disease-related miRNAs, such as the mutation in the stem of hsa-mir-125a (Duan et al. 2007), or in miR-181b-2, miR-208, miR-520e (Wu et al. 2008).
The miRNA biogenesis is regulated on multiple levels. The transcription of primary miRNAs (pri-miRNA) is regulated by common transcription factors, e.g., c-Myc (Abdelmohsen et al. 2012), and some miRNAs are also found to be subject to methylation (Brueckner et al. 2007). miRNAs are transcribed in the nucleus by RNA polymerase II or polymerase III (Borchert et al. 2006; Kim and Nam 2006) as part of the pri-miRNA, whose length is highly variable, ranging from ∼200 up to several thousand nucleotides (Du and Zamore 2005; Cullen 2006). Drosha and DGCR8 bind the pri-miRNA, and Drosha cleaves pri-miRNAs at the base of the stem–loop and liberates a structure known as the precursor microRNA (pre-miRNA), which is ∼60–70 nt in length and forms a frequently mismatched hairpin structure with a 2-nt 3′ overhang (Basyuk et al. 2003; Lee et al. 2003; Ritchie et al. 2007). The DGCR8 mRNA has stem–loop structures that can be cleaved by the Microprocessor, accordingly giving the Microprocessor a self-regulating mechanism (Han et al. 2009). The pre-miRNA is transported from the nucleus to the cytoplasm by Exportin-5 and is subsequently cleaved by the enzyme Dicer with its cofactor trans-activator RNA (tar)-binding protein (TRBP) (Chendrimada et al. 2005), with a notable exception in mir-451, which bypasses Dicer cleavage and is processed by Ago instead (Cheloufi et al. 2010). Dicer cleavage is further regulated by Lin28, which binds to pre-miRNAs from the let-7 family (Nam et al. 2011). Dicer acts by binding the 3′-overhang and cleaves the pri-miRNA ∼22 nt from the Drosha cutting site to remove the terminal loop, resulting in an imperfect ∼22 nt called miRNA:miRNA* (Hutvagner et al. 2001; Bernstein and Allis 2005; Feng et al. 2012). The miRNA enters the RNA-induced silencing complex (RISC), and the miRNA* is degraded, in a process where strand selection is variable (Bartel 2004; Du and Zamore 2005; Cullen 2006; Kim and Nam 2006). Although several mechanisms have been identified by which expression levels of select miRNAs are affected, and though Drosha is known to regulate overall miRNA expression, it has never previously been shown that the cell selectively can change miRNA expression profiles by altering levels of Drosha expression.
We show that Drosha levels vary between tissues and throughout cellular development, and that miRNAs without mismatches in the 9–12 nt region are over-represented in cells with low levels of Drosha, while highly mismatched miRNAs are highly expressed in cells with high levels of Drosha, and that this behavior can be altered by changing the miRNA secondary structure. This supports our hypothesis that the cell selectively regulates rigid and mismatched miRNAs by altering Drosha expression. We propose that this mechanism may contribute to the phenotypic relevance of specific levels of Drosha expression in development and terminal differentiation. In addition to other examples of post-transcriptional regulation, this can explain why some polycistronic miRNAs that are driven by the same promoter have very different expression levels, and the impact of SNPs, as stated above. This mechanism may be utilized while designing artificial miRNAs to increase stability, control expression levels throughout differentiation, or fine-tune miRNA expression in different tissue types.
MATERIALS AND METHODS
Counting method
Position 1 was assigned to the first nucleotide pair after the Drosha cutting site. The nucleotides that would form the single stranded overhang after Drosha processing were assigned negative positions (−1, −2, etc.) and if the cutting site was known for only one strand the overhang was assumed to be 2 nt. Positions were then assigned for each nucleotide pair in ascending order moving toward the Dicer cleavage site. The average hairpin contains several mismatches, which occasionally contain more nucleotides in one strand than in the other. Whenever such a length discrepancy occurred, the shorter strand was used to assign the mismatch position, using the later position whenever an asymmetric mismatch was located between two positions. Each position where the nucleotides were bound to each other was assigned the score 0, while positions with at least 1 nt mismatched were given the score 1.
Genomic location
Data from miRBase was used to determine whether each miRNA was intronic or intergenic. The fold change values in the two groups are visualized in Figure 2. Significance was calculated using a t-test. Information regarding whether each miRNA was intronic or intergenic was retrieved from miRBase, fold-change distribution was analyzed for each of the two groups, and differences in distribution were calculated using a t-test.
miRNA machinery and structure in neuronal differentiation
H1 cells were differentiated into neurons using 90% confluent cells on Matrigel. The differentiation was performed using a modified version of the dual SMAD inhibition protocol (Chambers et al. 2009), with the TGF-β inhibitor SB431542 (5 μM), ALK inhibitor LDN193189 (50 nM), and cyclopamine (1 μM) in CDM Basal media, which was changed daily for 12 d. At time points 0, 6, and 12 d starting from the first addition of inhibitors, cells were harvested. mRNA and miRNA were purified using the RNeasy Plus Mini Kit and the miRNeasy Mini Kit, respectively, according to manufacturer's instructions (Qiagen). Expression levels were measured using RNAseq (Expression Analysis Inc.) and single-color miRNA microarrays (LC Sciences), respectively. RNAseq expression data were then count- and length-normalized to transcripts per million (TPM) after exclusion of mitochondrial genes, and miRNA expression data were Lowess-normalized for cross-chip comparisons. CDM: DMEM/F12 supplemented with 1x N2 (GIBCO), 1x B27 (GIBCO), 2 mM l-glutamine, 0.11 mM 2-mercaptoethanol, 1 mM nonessential amino acids, and 0.5 mg/mL BSA (faction V) (Yao et al. 2006).
H1 cell culture
H1 human embryonic stem cell lines were cultured on a feeder layer (MEFs) in Dulbecco's modified Eagle's medium (DMEM)/Ham's F-12 medium containing GlutaMax supplemented with 20% serum replacer (SR), 1 mM sodium pyruvate, 0.1 mM nonessential amino acids, 50 units/mL penicillin, 50 μg/mL streptomycin, 0.1 mM β-mercapto-ethanol (Sigma-Aldrich), and 2 ng/mL basic fibroblast growth factor (Qi et al. 2009). Knockdowns of Drosha and Dicer were generated by infection with lentiviral vectors containing shRNA constructs against Drosha and Dicer, respectively. Control cells were infected with control viruses. After passaging the next day, infected cells were treated with blasticidin (0.5 μg/μL) for selection until discrete clusters of cells appeared. If cells showed less stability with respect to Drosha knockdown, cells were repeatedly selected with antibiotics (Qi et al. 2009). For the neuronal differentiation experiment H1 cells were cultured feeder-free on Matrigel (BD Biosciences) with mTeSR1 (Stemcell Technologies).
Generation of HeLa line with Drosha knockdown
HeLa cells were transduced with a pL6-Tet lentiviral vector containing shRNA against Drosha (Qi et al. 2009) (Titer 1.79 × 10⁸, MOI of 1:10; 10 µg/mL blasticidin selection for 4 d). Generation of the control cells was done with a pLKO.1 control lentivirus, (MOI 1:10; 10 µg/mL puromycin selection for 4 d).
Drosha qPCR analysis
Drosha and DGCR8 levels were measured in DroshaKD and Control HeLa cells using the SYBR-GREEN Q-PCR kit. Drosha Ct values were normalized to GAPDH (▵Ct: Drosha–GAPDH). The ▵▵Ct values were calculated by subtracting the Drosha ▵Ct values in the Control cells from those values in the KD cells. Fold change was calculated using the (2(−▵▵Ct)) method.
Total RNA extraction and quantitative RT-PCR analysis
Brain and liver tissues were dissected from WT mice (n = 3). Tissues were homogenized using mortar and pestle in a liquid-nitrogen bath. RNA was extracted from cells adherent on plates or from tissue homogenate using Trizol reagent (Invitrogen) and cDNA was synthesized with the Omniscript RT kit (Qiagen). β-actin or UBC was used as endogenous control for normalization. Quantitative PCR reactions were performed in triplicate using the SyberGreen (Applied Biosystems) with the 7300 real time PCR system (Applied Biosystems). Primers used in our study are listed in Supplemental Table 1. Normalized Drosha levels in the brain were compared with those in the liver and the fold change was calculated using the 2(−▵▵Ct) methods.
qPCR of miRNAs was conducted using TaqMan miRNA assays (Applied Biosystems). miRNA expression was measured in both DroshaKD and Control HeLa cells. Raw Ct values for miRNAs were first normalized to RNU66 (endogenous snoRNA, internal control). Bleomycin values were normalized to GAPDH. To normalize to transfection efficiency, the normalized miRNA values were renormalized to the normalized Bleomycin values (normalized miRNA ▵Ct–normalized Bleomycin ▵Ct). This new normalized value from control cells was subtracted from the corresponding value in the knockdown cells to generate the ▵▵Ct values. Fold change with respect to the control cells was calculated using the 2(−▵▵Ct) method.
Protein extraction and Western blot
With the exception of mouse tissues, protein extraction and Western blot analysis followed procedures that were described previously (Zhou et al. 2011). Briefly, cells were washed with Dulbecco's PBS (Sigma Aldrich) and directly lysed on a culture dish using M-PER Mammalian Protein Extraction Reagent (Thermo Scientific, IL; 0.5 mL per 35-mm plate) and protease inhibitor cocktail (Complete Mini, Roche Applied Science). A total of 20 µg of protein extracts were loaded, separated by 4%–20% SDS-PAGE using Mini-PROTEAN TGX Precast Gels (Bio-Rad), and transferred to polyvinylidene difluoride transfer membranes (Thermo Scientific). Membranes were blocked with 5% nonfat dry milk for at least 60 min at room temperature, and incubated overnight at 4°C with primary antibody. Blots were incubated for 1 h with horseradish peroxidase-conjugated Blotting Grade Affinity Purified secondary antibodies (Bio-Rad) and were visualized by enhanced chemiluminescence (Millipore Corp). Protein expression levels in the gel were quantified by densitometry implemented in Image-J (National Institutes of Health, Bethesda http://rsb.info.nih.gov/ij/, 1997–2013). Antibodies used in this study are: rabbit anti-Drosha antibody (Cell Signaling Technology) diluted at 1:1000, mouse anti-β-actin antibody (Santa Cruz Biotechnology) diluted at 1:5000, goat anti-rabbit antibody (Bio-Rad Laboratories) diluted at 1:10000, and goat anti-mouse antibody (Bio-Rad Laboratories). For mouse tissues, the protocol above was followed for protein extraction, gel loading, and the quantification of Drosha expression. As a control, either Western using actin Ab or Coomassie Brilliant Blue R (Sigma Aldrich) staining was used. Entire-cell protein expression was quantified using Image-J.
Transfections
The mutations were performed on the passenger strand, leaving the mature strand unchanged in order to be able to detect both the mutated and nonmutated miRNAs using the same TaqMan assay. The pri-miRNA inserts were amplified from genomic DNA by PCR, including the hairpin and ∼200 nt flanks on each side. The inserts were ligated into a modified pcDNA3.1+ plasmid with the neomycin selection marker replaced with a bleomycin resistance gene. Mutated versions of the constructs, with altered mismatches in the 9–12 region, were ordered from Genscript. The miRNA constructs were transiently transfected into HeLa cells using Lipofectamine2000. RNA was extracted after 48 h using Trizol.
Analysis of Drosha and miRNA expression in mouse tissues
For GDS3052 and GDS3142: These are two microarray analyses done in mouse using an Affymetrix Mouse Genome 430 2.0 chip. Drosha expression values were extracted from the data sets and were normalized to a gene that in both studies showed minimal variation between tissues; Eef2 (eukaryotic translation elongation factor 2). Drosha expression was represented as percent of Eef2 in the tissues.
For Takada et al. (2006): The miRNAs expressed in each tissue were first sorted according to number of clones (highest number of clones being highest expression and lowest number of clones being lowest expression). The miRNAs were then divided into groups based on the number of mismatches in the 5, 9–12 region (x-axis) and within each group the average expression level (y-axis) was calculated by geometric mean.
In vitro processing of miRNAs
Plasmids for wild-type (wt) and modified versions of mir-137 and mir-200b were linearized, gel purified, and in vitro transcribed using the Riboprobe (Promega) protocol and labeled with [α32P]CTP. Transcripts were purified using the RNAeasy mini kit (Qiagen) and then allowed to fold by addition of KAc, heating to 95°C for 5 min and then kept on ice until the processing reaction. Processing was performed by mixing folded pri-microRNA transcripts in 20-µL reactions with 8 µg 293T cell nuclear extract (ProteinOne, Catalog Ref. P0003-01; nuclear extract has been confirmed to support pri-miRNA processing, Y Chen, F Yang, T Pavelitz, J Mandic, JC Vuletich, G Varani, in prep.), 6.4 mM Mg(Ac)2, 1 mM ATP, 20 mM Creatine phosphate, 20 mM Tris, 100 mM KAc, 0.5 mM DTT, 0.2 mM PMSF, 20 units RiboLock RNase inhibitor (ThermoScientific), and 1 µg tRNA for 10, 30, and 90 min at 37°C followed by Trizol extraction and run on a 10% polyacrylamide-urea gel for 3 h at 390V. Gel exposures were quantified using ImageJ64 software where intensities of bands corresponding to pre-miRNAs were normalized to regions containing pri-miRNA transcripts.
Statistical analysis
Throughout the study, P values for expression levels were calculated using Student's t-test. (*) P < 0.05; (**) P < 0.01. Bars show SEM for at least three separate experiments.
P-values for differences in mismatch trends were calculated in R using a χ2 test with Yates’ continuity correction.
DATA DEPOSITION
Sequencing data used for the neuronal analysis have been deposited to the Gene Expression Omnibus (GEO) under accession no. GSE56107.
SUPPLEMENTAL MATERIAL
Supplemental material is available for this article.
ACKNOWLEDGMENTS
We thank the members of the Ruohola-Baker laboratory for helpful discussions throughout this work. We thank Yanling Wang at the Allen Institue for Brain Science for technical help. For the neuronal differentiation H1 cells were received from James A. Thomson at the University of Wisconsin and WiCell Research Institute. This work was supported by Schultze award for H.S. and grants from the National Institutes of Health R01GM097372, R01GM083867 and 1P01GM081619 to H.R.B.
REFERENCES
- Abdelmohsen K, Srikantan S, Kang MJ, Gorospe M 2012. Regulation of senescence by microRNA biogenesis factors. Ageing Res Rev 11: 491–500 [DOI] [PMC free article] [PubMed] [Google Scholar]
- Anokye-Danso F, Trivedi CM, Juhr D, Gupta M, Cui Z, Tian Y, Zhang Y, Yang W, Gruber PJ, Epstein JA, et al. 2011. Highly efficient miRNA-mediated reprogramming of mouse and human somatic cells to pluripotency. Cell Stem Cell 8: 376–388 [DOI] [PMC free article] [PubMed] [Google Scholar]
- Bar M, Wyman SK, Fritz BR, Qi J, Garg KS, Parkin RK, Kroh EM, Bendoraite A, Mitchell PS, Nelson AM, et al. 2008. MicroRNA discovery and profiling in human embryonic stem cells by deep sequencing of small RNA libraries. Stem Cells 26: 2496–2505 [DOI] [PMC free article] [PubMed] [Google Scholar]
- Bartel DP 2004. MicroRNAs: genomics, biogenesis, mechanism, and function. Cell 116: 281–297 [DOI] [PubMed] [Google Scholar]
- Basyuk E, Suavet F, Doglio A, Bordonne R, Bertrand E 2003. Human let-7 stem–loop precursors harbor features of RNase III cleavage products. Nucleic Acids Res 31: 6593–6597 [DOI] [PMC free article] [PubMed] [Google Scholar]
- Berezikov E, Chung WJ, Willis J, Cuppen E, Lai EC 2007. Mammalian mirtron genes. Mol Cell 28: 328–336 [DOI] [PMC free article] [PubMed] [Google Scholar]
- Bernstein E, Allis CD 2005. RNA meets chromatin. Genes Dev 19: 1635–1655 [DOI] [PubMed] [Google Scholar]
- Borchert GM, Lanier W, Davidson BL 2006. RNA polymerase III transcribes human microRNAs. Nat Struct Mol Biol 13: 1097–1101 [DOI] [PubMed] [Google Scholar]
- Brueckner B, Stresemann C, Kuner R, Mund C, Musch T, Meister M, Sultmann H, Lyko F 2007. The human let-7a-3 locus contains an epigenetically regulated microRNA gene with oncogenic function. Cancer Res 67: 1419–1423 [DOI] [PubMed] [Google Scholar]
- Chambers SM, Fasano CA, Papapetrou EP, Tomishima M, Sadelain M, Studer L 2009. Highly efficient neural conversion of human ES and iPS cells by dual inhibition of SMAD signaling. Nat Biotechnol 27: 275–280 [DOI] [PMC free article] [PubMed] [Google Scholar]
- Cheloufi S, Dos Santos CO, Chong MM, Hannon GJ 2010. A Dicer-independent miRNA biogenesis pathway that requires Ago catalysis. Nature 465: 584–589 [DOI] [PMC free article] [PubMed] [Google Scholar]
- Chendrimada TP, Gregory RI, Kumaraswamy E, Norman J, Cooch N, Nishikura K, Shiekhattar R 2005. TRBP recruits the Dicer complex to Ago2 for microRNA processing and gene silencing. Nature 436: 740–744 [DOI] [PMC free article] [PubMed] [Google Scholar]
- Chong MM, Zhang G, Cheloufi S, Neubert TA, Hannon GJ, Littman DR 2010. Canonical and alternate functions of the microRNA biogenesis machinery. Genes Dev 24: 1951–1960 [DOI] [PMC free article] [PubMed] [Google Scholar]
- Cullen BR 2006. Viruses and microRNAs. Nat Genet 38 Suppl: S25–S30 [DOI] [PubMed] [Google Scholar]
- Davis BN, Hata A 2009. Regulation of microRNA biogenesis: a miRiad of mechanisms. Cell Commun Signal 7: 18. [DOI] [PMC free article] [PubMed] [Google Scholar]
- Davis BN, Hilyard AC, Lagna G, Hata A 2008. SMAD proteins control DROSHA-mediated microRNA maturation. Nature 454: 56–61 [DOI] [PMC free article] [PubMed] [Google Scholar]
- Diederichs S, Haber DA 2006. Sequence variations of microRNAs in human cancer: alterations in predicted secondary structure do not affect processing. Cancer Res 66: 6097–6104 [DOI] [PubMed] [Google Scholar]
- Du T, Zamore PD 2005. microPrimer: the biogenesis and function of microRNA. Development 132: 4645–4652 [DOI] [PubMed] [Google Scholar]
- Duan R, Pak C, Jin P 2007. Single nucleotide polymorphism associated with mature miR-125a alters the processing of pri-miRNA. Hum Mol Genet 16: 1124–1131 [DOI] [PubMed] [Google Scholar]
- Feng Y, Zhang X, Song Q, Li T, Zeng Y 2011. Drosha processing controls the specificity and efficiency of global microRNA expression. Biochim Biophys Acta 1809: 700–707 [DOI] [PMC free article] [PubMed] [Google Scholar]
- Feng Y, Zhang X, Graves P, Zeng Y 2012. A comprehensive analysis of precursor microRNA cleavage by human Dicer. RNA 18: 2083–2092 [DOI] [PMC free article] [PubMed] [Google Scholar]
- Fukuda T, Yamagata K, Fujiyama S, Matsumoto T, Koshida I, Yoshimura K, Mihara M, Naitou M, Endoh H, Nakamura T, et al. 2007. DEAD-box RNA helicase subunits of the Drosha complex are required for processing of rRNA and a subset of microRNAs. Nat Cell Biol 9: 604–611 [DOI] [PubMed] [Google Scholar]
- Gregory RI, Yan KP, Amuthan G, Chendrimada T, Doratotaj B, Cooch N, Shiekhattar R 2004. The Microprocessor complex mediates the genesis of microRNAs. Nature 432: 235–240 [DOI] [PubMed] [Google Scholar]
- Griffiths-Jones S, Grocock RJ, van Dongen S, Bateman A, Enright AJ 2006. miRBase: microRNA sequences, targets and gene nomenclature. Nucleic Acids Res 34(Database issue): D140–D144 [DOI] [PMC free article] [PubMed] [Google Scholar]
- Han J, Lee Y, Yeom KH, Nam JW, Heo I, Rhee JK, Sohn SY, Cho Y, Zhang BT, Kim VN 2006. Molecular basis for the recognition of primary microRNAs by the Drosha-DGCR8 complex. Cell 125: 887–901 [DOI] [PubMed] [Google Scholar]
- Han J, Pedersen JS, Kwon SC, Belair CD, Kim YK, Yeom KH, Yang WY, Haussler D, Blelloch R, Kim VN 2009. Posttranscriptional crossregulation between Drosha and DGCR8. Cell 136: 75–84 [DOI] [PMC free article] [PubMed] [Google Scholar]
- Hatfield SD, Shcherbata HR, Fischer KA, Nakahara K, Carthew RW, Ruohola-Baker H 2005. Stem cell division is regulated by the microRNA pathway. Nature 435: 974–978 [DOI] [PubMed] [Google Scholar]
- Hofacker IL, Fontana W, Stadler PF, Bonhoeffer LS, Tacker M, Schuster P 1994. Fast folding and comparison of RNA secondary structures. Monatsh Chem 125: 167–188 [Google Scholar]
- Hutvagner G, McLachlan J, Pasquinelli AE, Balint E, Tuschl T, Zamore PD 2001. A cellular function for the RNA-interference enzyme Dicer in the maturation of the let-7 small temporal RNA. Science 293: 834–838 [DOI] [PubMed] [Google Scholar]
- Kim VN, Nam JW 2006. Genomics of microRNA. Trends Genet 22: 165–173 [DOI] [PubMed] [Google Scholar]
- Kuehbacher A, Urbich C, Zeiher AM, Dimmeler S 2007. Role of Dicer and Drosha for endothelial microRNA expression and angiogenesis. Circ Res 101: 59–68 [DOI] [PubMed] [Google Scholar]
- Kuppusamy KT, Sperber H, Ruohola-Baker H 2013. MicroRNA regulation and role in stem cell maintenance, cardiac differentiation and hypertrophy. Curr Mol Med 13: 757–764 [DOI] [PMC free article] [PubMed] [Google Scholar]
- Lagos-Quintana M, Rauhut R, Lendeckel W, Tuschl T 2001. Identification of novel genes coding for small expressed RNAs. Science 294: 853–858 [DOI] [PubMed] [Google Scholar]
- Lee Y, Ahn C, Han J, Choi H, Kim J, Yim J, Lee J, Provost P, Radmark O, Kim S, et al. 2003. The nuclear RNase III Drosha initiates microRNA processing. Nature 425: 415–419 [DOI] [PubMed] [Google Scholar]
- Mattick JS, Makunin IV 2006. Non-coding RNA. Hum Mol Genet 15 Spec No 1: R17–R29 [DOI] [PubMed] [Google Scholar]
- Nam Y, Chen C, Gregory RI, Chou JJ, Sliz P 2011. Molecular basis for interaction of let-7 microRNAs with Lin28. Cell 147: 1080–1091 [DOI] [PMC free article] [PubMed] [Google Scholar]
- Noland CL, Ma E, Doudna JA 2011. siRNA repositioning for guide strand selection by human Dicer complexes. Mol Cell 43: 110–121 [DOI] [PMC free article] [PubMed] [Google Scholar]
- O'Donnell KA, Wentzel EA, Zeller KI, Dang CV, Mendell JT 2005. c-Myc-regulated microRNAs modulate E2F1 expression. Nature 435: 839–843 [DOI] [PubMed] [Google Scholar]
- Qi J, Yu JY, Shcherbata HR, Mathieu J, Wang AJ, Seal S, Zhou W, Stadler BM, Bourgin D, Wang L, et al. 2009. microRNAs regulate human embryonic stem cell division. Cell Cycle 8: 3729–3741 [DOI] [PMC free article] [PubMed] [Google Scholar]
- Ritchie W, Legendre M, Gautheret D 2007. RNA stem–loops: to be or not to be cleaved by RNAse III. RNA 13: 457–462 [DOI] [PMC free article] [PubMed] [Google Scholar]
- Ruby JG, Jan CH, Bartel DP 2007. Intronic microRNA precursors that bypass Drosha processing. Nature 448: 83–86 [DOI] [PMC free article] [PubMed] [Google Scholar]
- Shcherbata HR, Hatfield S, Ward EJ, Reynolds S, Fischer KA, Ruohola-Baker H 2006. The microRNA pathway plays a regulatory role in stem cell division. Cell Cycle 5: 172–175 [DOI] [PubMed] [Google Scholar]
- Stadler BM, Ruohola-Baker H 2008. Small RNAs: keeping stem cells in line. Cell 132: 563–566 [DOI] [PMC free article] [PubMed] [Google Scholar]
- Stadler B, Ivanovska I, Mehta K, Song S, Nelson A, Tan Y, Mathieu J, Darby C, Blau CA, Ware C, et al. 2010. Characterization of microRNAs involved in embryonic stem cell states. Stem Cells Dev 19: 935–950 [DOI] [PMC free article] [PubMed] [Google Scholar]
- Starega-Roslan J, Krol J, Koscianska E, Kozlowski P, Szlachcic WJ, Sobczak K, Krzyzosiak WJ 2010. Structural basis of microRNA length variety. Nucleic Acids Res 39: 257–268 [DOI] [PMC free article] [PubMed] [Google Scholar]
- Stark A, Brennecke J, Bushati N, Russell RB, Cohen SM 2005. Animal microRNAs confer robustness to gene expression and have a significant impact on 3′UTR evolution. Cell 123: 1133–1146 [DOI] [PubMed] [Google Scholar]
- Sun G, Yan J, Noltner K, Feng J, Li H, Sarkis DA, Sommer SS, Rossi JJ 2009. SNPs in human miRNA genes affect biogenesis and function. RNA 15: 1640–1651 [DOI] [PMC free article] [PubMed] [Google Scholar]
- Takada S, Berezikov E, Yamashita Y, Lagos-Quintana M, Kloosterman WP, Enomoto M, Hatanaka H, Fujiwara S, Watanabe H, Soda M, et al. 2006. Mouse microRNA profiles determined with a new and sensitive cloning method. Nucleic Acids Res 34: e115. [DOI] [PMC free article] [PubMed] [Google Scholar]
- Wu M, Jolicoeur N, Li Z, Zhang L, Fortin Y, L'Abbe D, Yu Z, Shen SH 2008. Genetic variations of microRNAs in human cancer and their effects on the expression of miRNAs. Carcinogenesis 29: 1710–1716 [DOI] [PubMed] [Google Scholar]
- Yao S, Chen S, Clark J, Hao E, Beattie GM, Hayek A, Ding S 2006. Long-term self-renewal and directed differentiation of human embryonic stem cells in chemically defined conditions. Proc Natl Acad Sci 103: 6907–6912 [DOI] [PMC free article] [PubMed] [Google Scholar]
- Zeng Y, Cullen BR 2003. Sequence requirements for micro RNA processing and function in human cells. RNA 9: 112–123 [DOI] [PMC free article] [PubMed] [Google Scholar]
- Zeng Y, Yi R, Cullen BR 2005. Recognition and cleavage of primary microRNA precursors by the nuclear processing enzyme Drosha. EMBO J 24: 138–148 [DOI] [PMC free article] [PubMed] [Google Scholar]
- Zhou W, Dosey TL, Biechele T, Moon RT, Horwitz MS, Ruohola-Baker H 2011. Assessment of hypoxia inducible factor levels in cancer cell lines upon hypoxic induction using a novel reporter construct. PLoS One 6: e27460. [DOI] [PMC free article] [PubMed] [Google Scholar]
- Zisoulis DG, Kai ZS, Chang RK, Pasquinelli AE 2012. Autoregulation of microRNA biogenesis by let-7 and Argonaute. Nature 486: 541–544 [DOI] [PMC free article] [PubMed] [Google Scholar]