

Abstract
Bacterial growth inhibition tests have become a standard measure of the adverse effects of inhibitors for a wide range of applications, such as toxicity testing in the medical and environmental sciences. However, conventional well-plate formats for these tests are laborious and provide limited information (often being restricted to an end-point assay). In this study, we have developed a microfluidic system that enables fast quantification of the effect of an inhibitor on bacteria growth and survival, within a single experiment. This format offers a unique combination of advantages, including long-term continuous flow culture, generation of concentration gradients, and single cell morphology tracking. Using Escherichia coli and the inhibitor amoxicillin as one model system, we show excellent agreement between an on-chip single cell-based assay and conventional methods to obtain quantitative measures of antibiotic inhibition (for example, minimum inhibition concentration). Furthermore, we show that our methods can provide additional information, over and above that of the standard well-plate assay, including kinetic information on growth inhibition and measurements of bacterial morphological dynamics over a wide range of inhibitor concentrations. Finally, using a second model system, we show that this chip-based systems does not require the bacteria to be labeled and is well suited for the study of naturally occurring species. We illustrate this using Nitrosomonas europaea, an environmentally important bacteria, and show that the chip system can lead to a significant reduction in the period required for growth and inhibition measurements (<4 days, compared to weeks in a culture flask).
Conventional bacterial growth inhibition tests have become a standard measure of the adverse effects of compounds or materials on an aerobic organism. Such established protocols are now widely used in pharmacological, environmental monitoring, food safety, and wastewater toxicity investigations.1,2 However, these tests are time-consuming, are labor intensive, and require large amounts of reagents (the standard assay generally involves bacterial culture in a series of dilutions, followed by measurement of bacterial number or metabolic products).1 Since these assays are, in general, end-point measurements, it is often difficult to monitor the kinetics of bacterial growth in situ or to retrieve other information such as bacterial morphological changes.
Additional considerations also have to be given in areas where wild type or naturally occurring species are of interest. Outside of the laboratory, bacteria live in diverse environments and their physiology is dependent on local conditions and the species that they live in close contiguity with.3 Many of these influences cannot be accommodated in conventional flask or microtiter well-based cultivation techniques.
Microfluidics offers some clear advantages over these existing formats, providing the possibility to develop high throughput, real-time, low sample consumption assays for bacterial growth tests.4−6 For example, in the context of screening antibiotic toxicity, microdroplet based systems have already been demonstrated by carrying out multiple functional assays with minute samples (e.g., <100 μL).7,8 However, microdroplet methods come with additional challenges, including the need for highly sensitive optical readout systems in order to detect low levels of signal (e.g fluorescence) in small droplets moving very fast.
An alternative method that appears more adaptable to a microbiology laboratory is to track the growth of bacteria on a microfluidic chip. Because of the nonadherent nature of many bacteria, immobilization or trapping of bacteria on-chip is necessary for time-lapse observations. The use of geometrical barriers, including microchannels,9,10 microchambers,11,12 single cell tracks,13,14 and sandwiching a monolayer of bacteria between an agar membrane and glass slide15 have all been shown to be feasible. For growth and IC50 studies, most of these methods still require off-chip preparation of a series of dilutions and knowledge of potential conditions for the test, which can be cumbersome for unknown systems.
It is now well established that generating concentration gradients within a microfluidic system provides an effective means for evaluating a wide range of conditions in a single experiment.16−20 In conjunction with time lapse tracking of single cells, concentration gradient microfluidics has become an effective means for the study of cell migration (e.g chemotaxis).9,16,21−25 Surprisingly, its implementation for bacterial growth inhibition tests is less well reported, perhaps because of the difficulty of fixing/retaining the bacteria on the chip.
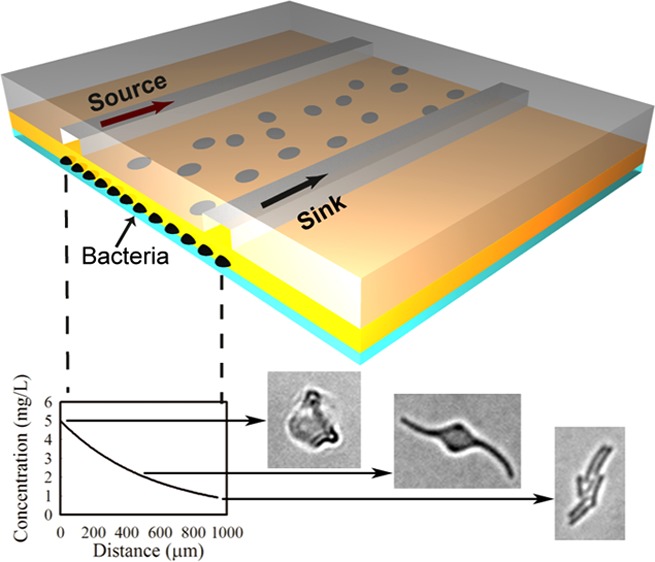
Recently, Choi et al. developed a microfluidic agarose channel system for trapping bacteria under a gradient of antibiotics and illustrated its potential for fast evaluation of antibiotic susceptibility.26 However, tracking the growth of multilayer bacteria in a 3D gel is challenging and requires specialized skills. Here, as an alternative, we describe a simple, gradient microfluidic system for rapid bacterial growth inhibition tests that is based on single bacterial morphology tracking. It employs the simple assembly of a polydimethylsiloxane (PDMS) chip and a thin agarose membrane to establish steady concentration gradients of inhibitors over a monolayer of bacteria. Compared with previous studies, our system enables long-term tracking of morphological dynamics of individual bacteria under a wide range of inhibitor concentrations and thus allows fast evaluation of inhibition with both quantitative and mechanistic information.
In this report we illustrate this method using two model systems. First, with Escherichia coli (E. coli) and amoxicillin we quantitatively compare the on-chip assay with conventional laboratory-based dilution methods. Second, we evaluated the capability of this on-chip approach for long-term cell studies (∼4 days) on Nitrosomonas europaea, an environmentally important nitrificating bacteria. In this case, for the first time, we are able to show how the local microenvironment can have a profound influence on investigations of bacteria such as these, that have a complex natural habitat.
Materials and Methods
Microfluidic Device
The microfluidic device developed in this study comprises an assembly of a coverslip, a thin agarose gel membrane, and a polydimethylsiloxane (PDMS) chip, Figure 1a. The chip consists of two parallel channels at a distance of 1 mm apart. The length, width, and depth dimensions of each channel were 13 mm × 500 μm × 500 μm, respectively.
Figure 1.
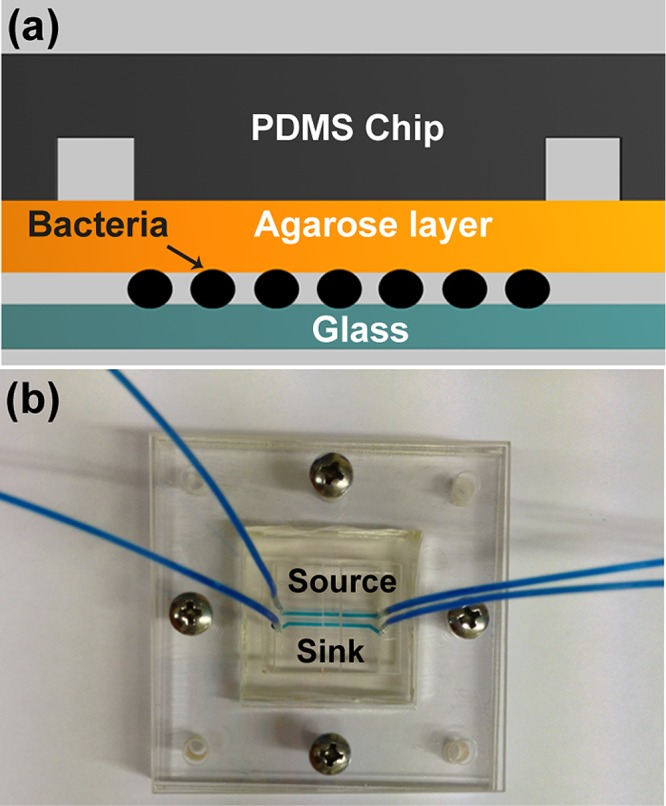
Configuration of the three-layered microfluidic device: (a) cross section of the device that consists of a glass substrate, a thin agarose membrane, and a PDMS chip. A monolayer of bacteria were trapped between the agarose layer and the glass substrate (not to scale); (b) photograph of the assembled device in a plastic manifold.
The thin agarose gel membrane was made from 2% agarose (Sigma-Aldrich) in reverse osmosis (RO) water. The solution was autoclaved, gelled, and stored at 4 °C prior to use. To obtain a uniformly thick membrane, the gel was melted at 65 °C and cast between two clean coverslips separated by a 250 μm thick PDMS spacer. The assembly was sterilized with UV light for 30 min and then left for 20 min to gell. After removal of the top coverslip and the spacer, the membrane was slid onto the channel side of an upturned PDMS chip.
To form a monolayer of bacteria, 3 μL of a bacterial suspension (OD600 in the range of 0.05–0.08) was dispensed onto the center of the agarose gel membrane and immediately covered with a coverslip, Figure 1b. The assembly was clamped in a plastic holder with spring loaded screws to ensure even pressure distribution, Figure 1c. New agarose gel and coverslips are used for each experiment to minimize contamination. The rest of the device is reusable and after UV sterilization was reassembled to perform repeated tests on fresh bacteria samples.
Bacteria Culture
Culture of Escherichia coli (ATCC 25922) and Nitrosomonas europaea (ATCC25978) are described in the Supporting Information.
On-Chip Inhibitory Test
On-chip inhibition tests were conducted by delivering “source” and “sink” solutions through parallel channels in the chip, Figure 1c. Solutions were continuously delivered at a speed of 0.33 mm/s by a syringe pump (NE-4000, Newera Pump Systems Inc.). The “source” solution contained medium plus either 5 mg/L (E. coli) or 15 mg/L (N. europaea) amoxicillin, and the “sink” solution contained medium alone. Shortly after delivery of the two solutions, a steady concentration gradient was established via diffusion through the agarose membrane to the bacterial monolayer underneath. To visualize the time course and profile of the gradient formed, 30 μM fluorescein (MW = 332.31, Sigma-Aldrich) solution was used in a parallel set of (bacteria free) experiments. All experiments were performed at room temperature (21–22 °C), in line with a habitat temperature commonly found for bacteria in the environment. At least three replicate experiments were conducted for each of the conditions reported below.
Off-Chip Inhibitory Test
Three replicate wells were filled with 5 μL of bacterial suspension and 295 μL of LB broth, with or without added amoxicillin (1, 2, 3, 4, and 5 mg/L). Plates were placed on an orbital shaker (150 rpm, 22 °C) and the OD600 recorded every 30 min for 12 h with a plate reader (Synergy HT, Biotek).
Optical Image Acquisition and Analysis
Time-lapse images were recorded using a motorized inverted microscope equipped with a 40× objective lens (Zeiss AxioObserver Z1, Photometrics Cascade II CCD) by observation through the coverslip. All images were processed with Image J and autocontrast was applied to bright field images to give clearly defined cell edges. Bright field images were processed and cell areas calculated as described in the Supporting Information.
Calculation of Bacterial Growth Rate
Conventionally, the growth rates of bacteria in suspension culture are determined by
| 1 |
where R is the increment ratio, OD0 and OD are the optical density (OD600) of suspended cells (i.e., an indirect measure of cell density as mass rather than numbers per unit volume)27,28 initially (t = 0) and after a time t; μ is the specific growth rate (h–1), and tm is the lag period of bacterial growth.
For the on-chip culture, since bacteria grow as a nonconfluent monolayer, cell mass in a colony can be considered to be directly proportional to the colony’s area.15 Therefore this can be used to analyze the growth rates of the bacteria within the colony via the following equation.
| 2 |
where S0 and S are the bacterial colony areas at the initial (t = 0) time and at time t. For on-chip measurements of bacterial growth, estimations for a given concentration were made using at least 10 randomly selected colonies.
Results and Discussion
Characterization of Concentration Gradients
The concentration gradient of amoxicillin in the device was estimated by collecting fluorescence images when fluorescein was used in place of amoxicillin in the source channel (note, amoxicillin and fluorescein have similar molecular weights and consequently similar diffusion characteristics). Because of the porous structure and high water content (98%) of agarose gel membranes, diffusion leads to the concentration gradient of fluorescein (or amoxicillin) at the membrane/coverslip interface being rapidly established, as shown in Figure 2a. Because of the continuous flow system used, the slight absorption of fluorescein (or other nonpolar small molecules) into the PDMS chip does not significantly affect the concentration gradient formed below the agarose layer.
Figure 2.

Concentration gradient formed under the agarose layer in the microfluidic chip: (a) bright field (top) and fluorescence (bottom) images of the source and sink channels at time 20 min. The focal plane was set by focusing at the interface between the agarose layer and the coverslip surface; this ensured that the fluorescence profile accurately corresponds to the concentration surrounding the bacteria. The distance between the source (where x = 0) and the sink channel is 1 mm; (b) evolution of fluorescein diffusion profiles during the first 6 h of microfluidic flow. Inset shows the concentration gradient versus distance at time 20 min.
Timelapse fluorescence images recorded over a period of 6 h showed that the intensity profile changed by <10% after 20 min (Figure 2b and Figure S1, Supporting Information). The concentration profiles were readily derived from the intensity profiles because of their excellent linear relationship (Figure S2, Supporting Information). It should be noted, the concentration at the source channel, where x = 0, was assumed to be the maximum concentration of fluorescein (Figure 2a). Furthermore, stable flows (e.g., 0.33 mm/s) in the two channels were found to be important to maintain the steady profile throughout the experiment. The concentration profile of fluorescein at time 60 min served as a calibration curve to calculate amoxicillin concentrations across the channel and was acquired after each inhibitory test to validate the anticipated concentration profile. These calibrations showed that the consistency of the chip assemblies and the distance/concentration relationships varied by less than 5%.
Cell Growth On-Chip and In Well-Plates
The continuous flow culture formed in the microfluidic chip provided constant nutrient supply and removal of metabolic waste. Given the abundance of nutrients, bacterial cells were able to grow exponentially within the monolayer, making it possible to directly monitor single cell division and morphologic variations in situ via simple bright field microscopy without resorting to complicated fluorescence labeling efforts (e.g., fusing fluorescence genes into cells).
Time-lapse images of E. coli cells were used to track their growth during 5 h experiments. A typical example (Figure 3) shows that cells growing underneath the (amoxicillin free) sink channel proliferate readily. By optimizing the dispensing conditions, bacteria were seeded as individuals, evenly distributed as a monolayer between the agarose membrane and coverslip. After a period of 2 h, colonies originating from these single cells formed and expanded by cell division, with continued growth leading to merging (5 h, Figure 3). The areas that a cell and its colony occupied were calculated from time-lapse images and used to derive individual cell growth rates.
Figure 3.

Bacterial growth on-chip. Time-lapse images of monolayer growth of E. coli during the first 5 h of on-chip cultivation. Scale bars 10 μm.
The growth curves of E. coli cultured on-chip were compared to those of conventional 96-well plate suspension cultures, Figure S3, Supporting Information. Typically, the growth curves in suspension culture showed no lag phase (tm = 0 h), an exponential growth phase (until t = 3 h), and then a stationary phase (t > 3 h). In the case of on-chip culture, after a short lag phase (tm estimated to be 1.2 h), exponential growth was observed and sustained for the duration of the experiment. It is believed that the on-chip culture lag phase may be due to acclimatization of bacteria to their new environment, i.e., from broth suspension to the surface of a glass substrate. Nevertheless, the specific growth rates μ, derived from the linear slope of the growth curves, were 0.89 h–1 and 0.92 h–1 for the on-chip and suspension culture, respectively. These are in good agreement with each other, indicating that growth using the two formats is directly comparable.
A key feature in the layered design of this microfluidic chip that distinguishes it from other gradient microfluidic devices16,26 is that the supply of nutrients and removal of waste occurs at all points across the porous membrane. Thus, bacteria can be kept growing in the exponential phase, without being inhibited by metabolically produced toxins or waste products. This provides a reliable means to perform investigations that require continuous, long-term culture without the undesirable influences of a stationary growth phase.
Inhibition Tests On-Chip and In Suspension
In on-chip experiments, time-lapse, tiled images provide a means to calculate the growth of bacteria exposed to the whole range of amoxicillin concentrations generated within the gradient. For example, in Figure 4a, E. coli at five different locations corresponding to five different amoxicillin concentrations (cAM) are shown. The concentration associated with each frame corresponds to that at the center of the image (note: each image is 110 μm × 100 μm).
Figure 4.

Inhibitory effect of E. coli by amoxicillin: (a) time-lapse images of monolayers of bacterial cells exposed to different concentrations of amoxicillin during the first 5 h of experiments (the horizontal black line in the 5 mg/L images is the edge of the source channel). Scale bars 10 μm. (b) The growth curves of E. coli at different concentrations. (c) Concentration and growth rates curves for on-chip (n = 10, randomly selected 10 colonies at the same concentration) and well plate tests. Sigmoidal fitting was applied to the curves to derive an IC50. The standard deviation for some data points on the 96-well plate curve are less than 4% of the average value, making the error bars invisible.
Time-lapse images of the five locations clearly show that the inhibitory effects of amoxicillin on E. coli are both concentration and time dependent, Figure 4a. For example, at t = 2 h, cell growth was observed at all amoxicillin concentrations; at t = 4 h, elongation of cells (i.e., filamentation indicated by arrows in the figure) was dominant at low concentrations cAM ≤ 2.0 mg/L and cell dissolution (indicated with stars) occurred at high concentrations (i.e., cAM ≥ 4.0 mg/L). This phenomenon suggests that the elimination of E. coli with amoxicillin takes time, and several stages are involved in the killing process (as detailed in the next section).
The growth curves of E. coli at different amoxicillin concentrations are shown in Figure 4b. Below 2 mg/L amoxicillin, an exponential growth phase is maintained, indicating the antibiotic has negligible effects. At 3 mg/L amoxicillin and above, the inhibition of growth was observed. At these higher concentrations, after an initial growth phase the onset of decline in growth rate is dependent on the amoxicillin concentration (higher concentrations lead to earlier loss of bacteria). Similar relationships were observed with 96-well plates, where E. coli growth was inhibited when the amoxicillin concentration was above 2.0 mg/L (Figure S4, Supporting Information).
The half maximal inhibitory concentration (IC50) is often used to describe the effectiveness of an inhibitor and can be derived from sigmoidal fitting of concentration–growth rates (μ) curves (Figure 4c). It was found that the IC50 for amoxicillin was 2.0 mg/L when using a 96-well plate and 2.5 mg/L for the on-chip system, showing a good agreement between the two methods.
Similarly, the minimum inhibitory concentration (MIC), a common measure in antibiotic susceptibility testing (AST), can be readily interpolated from Figure 4c. Since MIC refers to the minimum concentration of an antibiotic that gives total inhibition, it can be derived from the point on the curves where the specific growth rate approaches zero. The MIC of E. coli to amoxicillin obtained from both on-chip and 96-well plate assays was 3.0 mg/L. This is well within the range of 2–8 mg/L reported by the Clinical and Laboratory Standard Institute.29 Considering the long period (usually 16–24 h) and tedious dilutions involved in conventional AST measurements, the microfluidic format demonstrated an advantageous speed that is combined with a reliable performance.
Single Cell Morphological Dynamics in Response to Amoxicillin Inhibition
Amoxicillin is one kind of β-lactam antibiotic, which can inhibit the development of a bacterial cell wall by interfering with transpeptidase enzymes responsible for the formation of the cross-linkage between peptidoglycan strands. In response to environmental pressures, for example, antibiotic inhibition, bacteria can undergo diverse morphological changes in order to survive.30 Despite amoxicillin being one of the most widely used antibiotics, little is known about its detailed influence on single cell shape dynamics. In this study, we demonstrate an application of using our microfluidic systems for high-throughput tracking of single cell morphological dynamics under a wide range of antibiotic concentrations.
Our on-chip inhibition analysis of E. coli allows direct correlation of single cell morphological variations with amoxicillin concentrations and time scales. As shown in Figure 4a, during the initial growth period (0–2 h), filamentation of cells was observed at each amoxicillin concentration. Filamentation of E. coli under antibiotic treatment has been reported previously12,15,30 and is regarded as a survival mechanism. For some of the cells, a second stage, bulging, the black dot in the middle of the filament body indicated by the arrowhead in Figure 4a, occurs. These cells could be tracked and with higher amoxicillin concentrations or prolonged treatment, bulging cells underwent a final lysis stage and left faint residue on the surface. From numerous observations, it was clear that the occurrence of each stage (filament–bulge–lysis) is a hierarchical order and depends on the combination of amoxicillin concentration and treatment periods. For example, after the same period of treatment (e.g., 4 h) filamentation was prevalent at lower concentrations (cAM ≤ 1 mg/L) whereas more severe damage (i.e., bulge formation and lysis) was dominant at higher concentrations (cAM ≥ 3 mg/L) (Figure S5a, Supporting Information). The morphological variations of E. coli were further confirmed with high-resolution SEM images of cells exposed to amoxicillin (Figure S5b, Supporting Information).
From this finding, we propose that variations of bacterial length are a good measure to indicate different stages during the killing process. With the time-lapse images, we obtained bacterial lengths over the full range of concentration gradients of amoxicillin. For example, measurements at t = 4 h are shown in Figure 5, where the x-axis indicates the distance of bacteria from the source amoxicillin channel, the left y-axis is the average length of bacteria at a distance “x”, and the right y-axis is the corresponding concentration of amoxicillin. In relation to the concentration gradient, bacterial lengths presented three distinct clusters: (1) a flat, low cell length region (between 0 and 1 mg/L), suggesting negligible changes and normal growth; (2) a broad plateau region (between 1.5 and 3 mg/L) after a step increase from region 1 suggesting elongation or filamentation of cells. (Here, the relatively large deviation at each data point shows the heterogeneity in resistance of individual cells); and finally (3) a second flat, lowest cell length region (cAM ≥ 4 mg/L). This lowest cell length region is an indication of total growth inhibition, and interestingly, the lowest concentration in this region (4 mg/L) matches the MIC valued obtained by conventional AST measurement well.31 Clearly, the use of bacterial length as a readout provides a vivid illustration of both quantitative and mechanistic information of the inhibitory effect.
Figure 5.

Correlation between the bacterial length (dots) and amoxicillin concentration (line) at different distances from the source channel. Each data point is an average of 20 randomly chosen cells in the region. Error bars are standard deviations.
Benefits for Long-Term Studies of Naturally Occurring Bacteria
Wild type or bacteria in the environment are often the subjects of interest. However, they are less known and difficult to study. To assess the applicability of our approach for the investigation of these naturally occurring species, we carried out a preliminary study on the inhibition of amoxicillin on N. europaea. As an ammonia oxidizing bacteria N. europaea plays a central role in the global nitrogen cycle and in the elimination of the damage of ammonia fertilizers and estrogen do to the environment.32,33 However, they have proved difficult to study via conventional cultivation methods because of their slow proliferation rate and sensitivity to variations in their environments.34
Time lapse tracking of the growth of N. europaea on-chip was carried out for 4 days. As shown in Figure S6, Supporting Information, N. europaea are small rod-like bacteria and tend to clump together. Similar to E. coli growth on-chip, a continuous exponential growth was observed after a lag period (tm = 20 h) with the specific growth rate, μ, being 0.05 h–1, Figure 6. In contrast, several stages of growth rates were found in conventional flask culture (Figure 6). Interestingly, the initial flask growth rate (<12 h) is 0.05 h–1, similar to that found on-chip. After that, a very significant reduction of growth was observed until it reached a steady value of 0.08 day–1 after ∼4 days. This reduction in rate may well reflect the fact that ammonia-oxidizing bacteria such as N. europaea can be inhibited by their own product, nitrite.34 In a closed flask culture, this nitrite accumulates, whereas in the environment, such an inhibition can be removed by the presence of nitrite-oxidizing bacteria living in close spatial contiguity.35 It is possible that the continuous flow culture “mimics” the bacteria’s natural habitat by removing nitrite and thereby minimizing its inhibition. This function of the chip system is of significant benefit in long-term cell studies, where a stable interference-free microenvironment is essential.
Figure 6.

Growth rates of Nitrosomonas europaea for on-chip and in-flask culture.
Following successful cultivation of N. europaea on-chip for 2 days, with the bacteria in an exponential growth phase, an amoxicillin inhibition test was begun. As shown in Figure 7, cell division and generation persisted at the highest concentrations tested (15 mg/L, indicated by arrows in Figure 7), even after exposure for 40 h; no variations in cell length and morphogies were observed. The observed growth at such a high concentration suggests N. europaea is resistant to amoxicillin.36 In comparison with the weeks of culture and laborious spectrophotometric analysis needed for such inhibition evaluations in flask,37 our approach provides a well controlled microenvironment that enables fast, reliable method for “challenging” bacteria.
Figure 7.

Inhibitory effect of Nitrosomonas europaea by amoxicillin. The black arrows indicate growth of new cells. The scale bar is 5 μm.
Conclusions
We have developed a microfluidic platform that enables long-term continuous culture, generation of steady concentration gradients, and single cell tracking. The platform provided a fast and reliable means for both quantitative and mechanistic investigations of bacterial inhibitors.
With E. coli and amoxicillin as a model system, we showed an excellent agreement between on-chip single cell based assay with conventional methods on quantitative measures (i.e., IC50 and MIC) of antibiotic inhibition. Furthermore, we show that our methods provide rich information on bacterial morphological dynamics over a wide range of concentrations. For the first time, we illustrate the use of bacterial length as a read-out together with knowledge of the concentration gradient to provide quantitative information about an inhibitor’s efficacy.
Most importantly, our system does not need labeling of the bacteria and provides a novel, effective means for bacterial growth inhibition tests, especially for investigations of slowly growing bacteria, such as N. europaea, and could be applied to studies of single cell variability or exposure to a range of environmental pressures.
Acknowledgments
We thank the financial support from Environmental Simulation and Pollution Control State-Key Joint Laboratory (Grant 12L01ESPC), Tsinghua University Initiative Scientific Research Program (Grant No. 20121087922), and from EPSRC (Grants EP/H04986X/1 and EP/J009121/1).
Supporting Information Available
Protocols for bacteria culture; image analysis and SEM preparation; Figure S1, timelapse fluorescence images of fluorescein solution for a period of 6 h; Figure S2, calibration curve of fluorescein concentrations vs fluorescence intensity; Figure S3, growth curves for on-chip and 96-well plate culture; Figure S4, growth curves for E. coli at different amoxicillin concentrations in 96-well plates; Figure S5, optical and SEM images showing morphology variations in E. coli exposed to different amoxicillin concentrations; Figure S6, time-lapse images of N. europaea growth on-chip. This material is available free of charge via the Internet at http://pubs.acs.org.
The authors declare no competing financial interest.
Supplementary Material
References
- Kolpin D. W.; Furlong E. T.; Meyer M. T.; Thurman E. M.; Zaugg S. D.; Barber L. B.; Buxton H. T. Environ. Sci. Technol. 2002, 36, 1202–1211. [DOI] [PubMed] [Google Scholar]
- Wang S. Y.; Gunsch C. K. Water Res. 2011, 45, 3398–3406. [DOI] [PubMed] [Google Scholar]
- Paerl H. W.; Pinckney J. L. Microb. Ecol. 1996, 31, 225–247. [DOI] [PubMed] [Google Scholar]
- Faley S. L.; Copland M.; Wlodkowic D.; Kolch W.; Seale K. T.; Wikswo J. P.; Cooper J. M. Lab Chip 2009, 9, 2659–2664. [DOI] [PubMed] [Google Scholar]
- Weibel D. B.; DiLuzio W. R.; Whitesides G. M. Nat. Rev. Microbiol. 2007, 5, 209–218. [DOI] [PubMed] [Google Scholar]
- Wlodkowic D.; Faley S.; Zagnoni M.; Wikswo J. P.; Cooper J. M. Anal. Chem. 2009, 81, 5517–5523. [DOI] [PMC free article] [PubMed] [Google Scholar]
- Boedicker J. Q.; Li L.; Kline T. R.; Ismagilov R. F. Lab Chip 2008, 8, 1265–1272. [DOI] [PMC free article] [PubMed] [Google Scholar]
- Churski K.; Kaminski T. S.; Jakiela S.; Kamysz W.; Baranska-Rybak W.; Weibel D. B.; Garstecki P. Lab Chip 2012, 12, 1629–1637. [DOI] [PubMed] [Google Scholar]
- Kim K. P.; Kim Y. G.; Choi C. H.; Kim H. E.; Lee S. H.; Chang W. S.; Lee C. S. Lab Chip 2010, 10, 3296–3299. [DOI] [PubMed] [Google Scholar]
- Chen C. H.; Lu Y.; Sin M. L. Y.; Mach K. E.; Zhang D. D.; Gau V.; Liao J. C.; Wong P. K. Anal. Chem. 2010, 82, 1012–1019. [DOI] [PMC free article] [PubMed] [Google Scholar]
- Luo C. X.; Jiang L. L.; Liang S. B.; Ouyang Q.; Ji H.; Chen Y. Biomed. Microdevices 2009, 11, 981–986. [DOI] [PubMed] [Google Scholar]
- Sun P.; Liu Y.; Sha J.; Zhang Z. Y.; Tu Q.; Chen P.; Wang J. Y. Biosens. Bioelectron. 2011, 26, 1993–1999. [DOI] [PubMed] [Google Scholar]
- Long Z.; Nugent E.; Javer A.; Cicuta P.; Sclavi B.; Lagomarsino M. C.; Dorfman K. D. Lab Chip 2013, 13, 947–954. [DOI] [PubMed] [Google Scholar]
- Moffitt J. R.; Lee J. B.; Cluzel P. Lab Chip 2012, 12, 1487–1494. [DOI] [PMC free article] [PubMed] [Google Scholar]
- Wong I.; Atsumi S.; Huang W. C.; Wu T. Y.; Hanai T.; Lam M. L.; Tang P.; Yang J. A.; Liao J. C.; Ho C. M. Lab Chip 2010, 10, 2710–2719. [DOI] [PubMed] [Google Scholar]
- Kim M.; Kim T. Anal. Chem. 2010, 82, 9401–9409. [DOI] [PubMed] [Google Scholar]
- Garcia E.; Hasenbank M. S.; Finlayson B.; Yager P. Lab Chip 2007, 7, 249–255. [DOI] [PubMed] [Google Scholar]
- Tirella A.; Marano M.; Vozzi F.; Ahluwalia A. Toxicol. Vitro 2008, 22, 1957–1964. [DOI] [PubMed] [Google Scholar]
- Yin H. B.; Ji B. Z.; Dobson P. S.; Mosbahi K.; Glidle A.; Gadegaard N.; Freer A.; Cooper J. M.; Cusack M. Anal. Chem. 2009, 81, 473–478. [DOI] [PubMed] [Google Scholar]
- Ji B. Z.; Cusack M.; Freer A.; Dobson P. S.; Gadegaard N.; Yin H. B. Integr. Biol. 2010, 2, 528–535. [DOI] [PubMed] [Google Scholar]
- Englert D. L.; Manson M. D.; Jayaraman A. Appl. Environ. Microbiol. 2009, 75, 4557–4564. [DOI] [PMC free article] [PubMed] [Google Scholar]
- Jeong H. H.; Lee S. H.; Kim J. M.; Kim H. E.; Kim Y. G.; Yoo J. Y.; Chang W. S.; Lee C. S. Biosens. Bioelectron. 2010, 26, 351–356. [DOI] [PubMed] [Google Scholar]
- Ahmed T.; Shimizu T. S.; Stocker R. Nano Lett. 2010, 10, 3379–3385. [DOI] [PMC free article] [PubMed] [Google Scholar]
- Haessler U.; Kalinin Y.; Swartz M. A.; Wu M. W. Biomed. Microdevices 2009, 11, 827–835. [DOI] [PubMed] [Google Scholar]
- Choi E.; Jun I.; Chang H. K.; Park K. M.; Shin H.; Park K. D.; Park J. Lab Chip 2012, 12, 302–308. [DOI] [PubMed] [Google Scholar]
- Choi J.; Jung Y. G.; Kim J.; Kim S.; Jung Y.; Na H.; Kwon S. Lab Chip 2013, 13, 280–287. [DOI] [PubMed] [Google Scholar]
- Dalgaard P.; Ross T.; Kamperman L.; Neumeyer K.; McMeekin T. A. Int. J. Food Microbiol. 1994, 23, 391–404. [DOI] [PubMed] [Google Scholar]
- Monod J. Annu. Rev. Microbiol. 1949, 3, 371–394. [Google Scholar]
- Clinical and Laboratory Standards Institute (CLSI); http://www.clsi.org.
- Yao Z. Z.; Kahne D.; Kishony R. Mol. Cell 2012, 48, 705–712. [DOI] [PMC free article] [PubMed] [Google Scholar]
- Andrews J. M. J. Antimicrob. Chemother. 2001, 48, 5–16. [DOI] [PubMed] [Google Scholar]
- Kuai L. P.; Verstraete W. Appl. Environ. Microbiol. 1998, 64, 4500–4506. [DOI] [PMC free article] [PubMed] [Google Scholar]
- Shi J.; Fujisawa S.; Nakai S.; Hosomi M. Water Res. 2004, 38, 2323–2330. [DOI] [PubMed] [Google Scholar]
- Stein L. Y.; Arp D. J. Appl. Environ. Microbiol. 1998, 64, 4098–4102. [DOI] [PMC free article] [PubMed] [Google Scholar]
- Mobarry B. K.; Wagner M.; Urbain V.; Rittmann B. E.; Stahl D. A. Appl. Environ. Microbiol. 1996, 62, 2156–2162. [DOI] [PMC free article] [PubMed] [Google Scholar]
- NCCSL. NCCLS Document M7-A4; National Committee of Clinical Laboratory Standards: Wayne, PA, 2006.
- Halling-Sorensen B. Arch. Environ. Contam. Toxicol. 2001, 40, 451–460. [DOI] [PubMed] [Google Scholar]
Associated Data
This section collects any data citations, data availability statements, or supplementary materials included in this article.