

Abstract
The multiple skeletal components of the skull originate asynchronously and their developmental schedule varies across amniotes. Here we present the embryonic ossification sequence of 134 species, covering all major groups of mammals and their close relatives. This comprehensive data set allows reconstruction of the heterochronic and modular evolution of the skull and the condition of the last common ancestor of mammals. We show that the mode of ossification (dermal or endochondral) unites bones into integrated evolutionary modules of heterochronic changes and imposes evolutionary constraints on cranial heterochrony. However, some skull-roof bones, such as the supraoccipital, exhibit evolutionary degrees of freedom in these constraints. Ossification timing of the neurocranium was considerably accelerated during the origin of mammals. Furthermore, association between developmental timing of the supraoccipital and brain size was identified among amniotes. We argue that cranial heterochrony in mammals has occurred in concert with encephalization but within a conserved modular organization.
 The skeletal components of the skull develop at different times in mammals. Here, Koyabu et al. show that the mode of bone ossification constrains the timing of bone formation and find an association between the developmental timing of the supraoccipital bone and brain size.
The mammalian cranium displays great morphological disparity, reflecting the wide spectrum of ecological diversification in the group1. A major aspect of skull diversification is heterochrony, or changes in developmental timing, for which genetic mechanisms are now increasingly being understood2,3. Simple alterations in the onset, duration and tempo of development are regarded as causes of profound morphological changes4. Until recently, most mammalian heterochronic studies have focused on postnatal life, and our knowledge of fetal development has largely been restricted to model organisms5. The critical stages for examination of organogenesis are fetal or around the time of birth6,7, and thus non-model organisms are rarely available and difficult to sample8,9. Recent progress in high-resolution imaging techniques has provided new avenues to non-destructive investigation of fetal and neonatal specimens from museum collections. Microtomographic imaging allows documentation of the onset of individual bone ossification, a powerful marker for tracing perinatal anatomy. This approach has served to identify fundamental differences in postcranial osteogenesis between marsupials and placentals10, and unsuspected variation in placental development11. However, the ancestral patterns of craniogenesis timing and factors behind the cranial heterochrony remain largely unknown. In this study, we show that the timing of bone formation in the mammalian skull is greatly influenced by two factors such as brain size and developmental modularity caused by the mode of ossification.
Encephalization is a central phenomenon in mammalian evolution, one that has led to the largest brained vertebrates12, as best exemplified by primates and cetaceans. During the early evolution of mammals in the Jurassic, brain expansion was associated with the acquisition of the neocortex and diversification of sensory faculties12. Ontogenetically and evolutionarily, the expansion of the cranial vault reflects brain size increase13,14,15, as shown also for humans16. Given such somatic integration between the skull and the brain, we tested whether the heterochronic changes in embryonic ossification reflect the evolution of brain size. Modularity, referring to the strong internal integration and weak interactions among morphological subsets17, is another aspect of patterns of heterochrony to consider18. It has been suggested that genetic modularity affects the evolutionary dynamics of species, which in turn influence the evolution of molecular networks regulating morphogenesis17,19. However, the link between heterochrony and modularity in macroevolution remains largely unknown20,21,22.
A comprehensive sampling of museum collections across the world using non-destructive micro-computed tomography technique produced skeletal developmental sequences for 21 cranial elements of 102 mammalian species and 32 non-mammalian amniote species (sauropsids). Covering almost all major mammalian groups, our exceptionally large data set was used to reconstruct the developmental sequence of the common ancestor of mammals, and provide insights into evolutionary patterns of skeletal development. Herein, we demonstrate that cranial heterochrony reflects the encephalization history of mammals and conserved modular organization of skull elements.
Results
Reconstruction of ancestral ossification sequence
The ancestral conditions and heterochronic changes of ossification sequence at all nodes were reconstructed from developmental sequences of 134 amniote species (Supplementary Data 1 and 2; and Supplementary Table 1) using squared-change parsimony under a Brownian motion model of character evolution23. The ossification sequence inferred for the ancestor of Mammalia is as follows: (1) premaxilla and maxilla, (2) dentary, (3) palatine, (4) frontal and squamosal, (5) pterygoid, (6) jugal, (7) parietal, (8) nasal and ectotympanic, (9) vomer, (10) exoccipital and goniale, (11) basioccipital, (12) lacrimal, supraoccipital and alisphenoid, (13) basisphenoid, (14) orbitosphenoid and (15) petrosal (Fig. 1 and Supplementary Table 2). Inferred heterochronies for all other nodes are given in Supplementary Figs 1–21. We also conducted an alternative reconstruction by Parsimov-based genetic inference (PGi)24. This approach treats the sequence as one single, complex character and uses the Parsimov algorithm25 as an edit-cost function to optimize ancestral states and sequence heterochronies. The inferred sequence for the ancestor of Mammalia is: (1) premaxilla, (2) maxilla, dentary, nasal, jugal, frontal, parietal, squamosal, vomer, palatine and ectotympanic, (3), lacrimal, (4) basioccipital and supraoccipital, (5) pterygoid, (6) basisphenoid, (7) orbitosphenoid, alisphenoid and exoccipital, 8) goniale and (9) petrosal. The PGi sequence was less resolved (that is, involving more tied ranks) than that generated by squared-change parsimony, but both were mostly similar (Spearman’s rank correlation analysis, rs=0.80, n=21, P<0.0001). Inferred heterochronies for higher taxonomic levels are given in Fig. 2, and those for more inclusive nodes are given in Supplementary Figs 22–29. The results obtained by squared-change parsimony showed that the last common ancestor of Mammalia had a more accelerated onset of ossification of the vomer, frontal, parietal, basioccipital, exoccipital, and supraoccipital compared to non-mammalian amniotes (Supplementary Table 2). The PGi analysis showed that the last common ancestor of Mammalia had a more accelerated onset of ossification of the frontal, parietal, basisphenoid, basioccipital and supraoccipital (Fig. 2).
Figure 1. Reconstructed ossification sequence of the hypothetical common ancestor of Mammalia using squared-change parsimony under a Brownian motion model.

The skull of the mammaliaform Morganucodon51,52 is used to show the adult bone topology. The skull is in lateral view and the lower jaw in lingual view. Septomaxilla, coronoid and articular (malleus) were not applicable or studied herein. Abbreviations: as, alisphenoid (epipterygoid); bo, basioccipital; bs, basisphenoid; de, dentary; eo, exoccipital; et, ectotympanic (angular); fr, frontal; go, goniale (prearticular); ju, jugal; la, lacrimal; mx, maxilla; na, nasal; os, orbitosphenoid; pa, parietal; pal, palatine; pe, petrosal; pg, pterygoid; pm, premaxilla, so, supraoccipital; sq, squamosal. This material is reproduced and modified with permission of John Wiley & Sons, Inc. Copyright 1981 (John Wiley & Sons, Inc).
Figure 2. Heterochronic shifts in the onset of skull bone ossification recovered by the Parsimov-based genetic inference (PGi) analysis in amniotes.

Significant shifts detected in derived nodes compared with ancestral nodes are summarized. A, acceleration; D, delay. Numbers in the tree represent the detected cranial elements.
Ossification patterns and encephalization
Results of correlation analysis of the relative timing of cranial ossification (scaled from 0 to 1) and encephalization quotient (EQ), which is the residual of an allometric regression of brain weight against body weight26, are given in Table 1. We found that the ossification onset of the supraoccipital bone occurs earlier in taxa with higher EQ in mammals (Pearson’s product moment correlation analysis, r=−0.65, n=48, P<0.0001) (Fig. 3). Similarly, among non-mammalian amniotes, a tight correlation was found between the developmental timing of the supraoccipital and EQ (Pearson’s product moment correlation analysis, r= −0.95, n=9, P<0.001). These correlations were similarly significant in the phylogenetically controlled correlation analysis (Fig. 4; Table 1). The results by squared-change parsimony revealed that the timing of the supraoccipital development was accelerated in ancestral mammals when splitting from non-mammalian amniotes (Fig. 5 and Supplementary Table 2). The developmental timing of the supraoccipital was shown to be significantly earlier in mammals than in non-mammalian amniotes (U-test on phylogenetic independent contrasts27, mammals n=79, non-mammalian amniotes n=30, P<0.001).
Table 1. Pearson’s correlation coefficients and P-values for comparsions between relative developmental timing and EQ.
| r | P-values | r (Phylogenetically corrected) | P (Phylogenetically corrected) | |
|---|---|---|---|---|
| Mammals | ||||
| Premaxilla | −0.04 | 0.79 | −0.11 | 0.43 |
| Maxilla | 0.12 | 0.39 | −0.15 | 0.30 |
| Dentary | 0.03 | 0.82 | −0.09 | 0.53 |
| Frontal | −0.03 | 0.85 | −0.11 | −0.41 |
| Nasal | −0.10 | 0.49 | 0.01 | 0.96 |
| Jugal | −0.14 | 0.32 | −0.12 | 0.38 |
| Lacrimal | −0.16 | 0.25 | −0.16 | 0.26 |
| Parietal | 0.10 | 0.44 | 0.22 | 0.11 |
| Squamosal | −0.11 | 0.44 | 0.03 | 0.81 |
| Vomer | −0.02 | 0.87 | −0.10 | 0.48 |
| Palatine | −0.20 | 0.15 | −0.27 | 0.05 |
| Orbitosphenoid | −0.11 | 0.43 | −0.18 | 0.21 |
| Basisphenoid | −0.18 | 0.18 | 0.00 | 1.00 |
| Pterygoid | −0.09 | 0.53 | −0.17 | 0.23 |
| Alisphenoid | −0.07 | 0.61 | 0.00 | 0.98 |
| Basioccipital | −0.01 | 0.94 | −0.03 | 0.83 |
| Supraoccipital | −0.65 | 0.00 | −0.60 | 0.00 |
| Exoccipital | −0.11 | 0.41 | −0.18 | 0.19 |
| Ectotympanic | −0.33 | 0.03 | 0.03 | 0.85 |
| Goniale | −0.49 | 0.00 | −0.17 | 0.28 |
| Petrosal | −0.06 | 0.64 | −0.20 | 0.14 |
| Non-mammalian amniotes | ||||
| Premaxilla | −0.24 | 0.53 | −0.34 | 0.37 |
| Maxilla | −0.29 | 0.45 | −0.49 | 0.18 |
| Dentary | 0.03 | 0.93 | 0.09 | 0.82 |
| Frontal | 0.62 | 0.08 | 0.42 | 0.26 |
| Nasal | −0.50 | 0.21 | −0.26 | 0.54 |
| Jugal | −0.34 | 0.37 | −0.18 | 0.64 |
| Lacrimal | −0.66 | 0.07 | −0.65 | 0.08 |
| Parietal | 0.23 | 0.56 | −0.14 | 0.72 |
| Squamosal | −0.51 | 0.16 | −0.54 | 0.13 |
| Vomer | −0.36 | 0.38 | −0.14 | 0.97 |
| Palatine | −0.68 | 0.04 | −0.73 | 0.03 |
| Orbitosphenoid | — | — | — | — |
| Basisphenoid | 0.30 | 0.44 | 0.23 | 0.55 |
| Pterygoid | 0.09 | 0.82 | 0.05 | 0.91 |
| Alisphenoid | — | — | — | — |
| Basioccipital | 0.28 | 0.46 | 0.35 | 0.36 |
| Supraoccipital | −0.95 | 0.00 | −0.95 | 0.00 |
| Exoccipital | 0.44 | 0.23 | 0.25 | 0.52 |
| Ectotympanic | −0.48 | 0.23 | −0.44 | 0.28 |
| Goniale | 0.71 | 0.04 | 0.36 | 0.38 |
| Petrosal | 0.43 | 0.25 | 0.36 | 0.35 |
Both raw comparisons and phylogenetically corrected comparisons (Felsenstein’s independent contrasts) are given. Significance level was set as P<0.05/21 after Bonferroni correction, and statistically significant values are given in bold. Ectotympanic, goniale and alisphenoid of mammals were homologized to angular, prearticular and epipterygoid of non-mammalian amniotes, respectively. Values for orbitosphenoid of non-mammalian amniotes are not available because of uncertain homologies of this bone. Values for alisphenoid (epipterygoid) of non-mammalian amniotes are not available, as both the ossification timing of this bone and EQ is reported only for one species (Lacerta agilis).
Figure 3. Relation between encephalization quotient (EQ) and supraoccipital ossification timing.

Supraoccipital timing was obtained by calculating the relative score of the supraoccipital within all cranial bones. Significant negative correlation was found between supraoccipital timing and EQ (r= −0.65, n=48, P<0.0001).
Figure 4. Phylogenetic independent contrasts between EQ and supraoccipital timing.

Supraoccipital timing is negatively correlated with the EQ (r= −0.60, n=47, P<0.0001).
Figure 5. Reconstructed heterochronic shifts of supraoccipital developmental timing.

Values were reconstructed using squared-change parsimony under a Brownian motion model.
Modularity analysis
Depending on the anatomical identity of skull bone elements, the cranial region can be divided into different modules. Developmentally, the skull can be divided into mesoderm and neural crest cell-derived elements28. Similarly, skull bones are classified into either dermal bones or endochondral bones, depending on their mode of ossification15. Morphometric analyses of adult mammalian skulls have previously identified five phenotypic variational modules: oral, zygomatic, nasal, cranial base and cranial vault29. We considered these divisions as hypothetical modules, and tested whether these modules are identifiable in the patterns of skeletal heterochrony. Our results on pooled species demonstrated that timing of ossification of dermal bones is skewed towards earlier developmental stages than that of endochondral bones (U-test, n=1,470, P<0.05) (Fig. 6a). In addition, neighbour-joining cluster analysis showed that the skull bones form two evident clusters, one cluster consisting explicitly of dermal bones and the other of endochondral bones (n=1,470) (Fig. 6b,c).
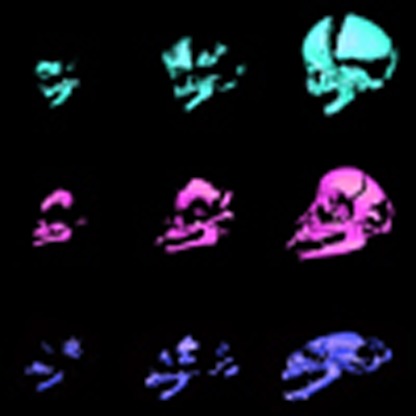
Figure 6. Variation of developmental timing of all bones.

Results are shown for highly resolved species with more than four ranks. (a) Boxplot comparison of the range of variation of relative timing of cranial bones (dermal bones in red and endochondral bones in blue). The 25–75th percentiles are shown using a box. The whiskers show the top of the box up to the largest data point <1.5 times the box height from the box. Values further than 1.5 times the box height from the box are shown as circles, and those further than three times are shown as stars. Relative ossification timing is indicated to be significantly different between pooled dermal bones and pooled endochondral bones (Mann–Whitney U-test, P<0.00001). (b) Neighbour-joining cluster analysis of developmental timing. Bootstrap values were obtained through 10,000 permutations. Cranial bones form two clusters such as a dermal bone cluster and an endochondral bone cluster. (c) Topology of dermal and endochondral bones (prenatal Bos taurus). Abbreviations: as, alisphenoid; bo, basioccipital; bs, basisphenoid; de, dentary; eo, exoccipital; et, ectotympanic; fr, frontal; go, goniale; ju, jugal; la, lacrimal; mx, maxilla; na, nasal; os, orbitosphenoid; pa, parietal; pg, pterygoid; pm, premaxilla, so, supraoccipital; sq, squamosal.
Discussion
The common ancestor of Mammalia was found to have an accelerated onset of ossification of the cranial bones associated with the braincase (frontal, parietal, basioccipital and supraoccipital) when compared with non-mammalian amniotes. Morganucodon (Fig. 1), one of the basal-most mammaliaforms (the clade that includes mammals and their closest relatives), had a greatly expanded olfactory bulb, olfactory cortex, neocortex and cerebellum in comparison with non-mammaliaform cynodonts12. Such a morphological transformation is recognized as the first evolutionary pulse of brain expansion in mammalian evolution. The expanded brain regions are covered by accelerated bones of the skull-roof, suggesting that increased encephalization led to quantifiable developmental changes in the skull. Among mammals and non-mammalian amniotes, the ossification onset of the supraoccipital bone, which covers the occipital lobe of the cerebrum and cerebellum, is more accelerated in taxa with higher EQ (Figs 3 and 4; and Table 1). This indicates that the developmental timing of the supraoccipital can predict brain size. The developmental timing of the supraoccipital is more precocious, on an average, in mammals than in non-mammalian amniotes. Furthermore, our squared-change parsimony analysis detected that the timing of the supraoccipital development was considerably accelerated in ancestral mammals when splitting from non-mammalian amniotes, but then remained constant in monotremes, marsupials and the last common ancestor of placentals (Fig. 5). Then, its timing was further accelerated in multiple lineages independently, including primatomorphans, cetaceans, talpids and dipodid rodents (Fig. 5), all of which are known as encephalized30,31. Within primates, humans exhibit the highest EQ and the most accelerated case of supraoccipital development. Among rodents, the supraoccipital is most accelerated in jerboas (Jaculus) that possesses the highest EQ among the studied rodents (Supplementary Table 3). On the other hand, the ossification timing of another major skull-roof bone, the parietal, is not significantly correlated with EQ. However, it is worth noting that the onset of parietal ossification was also accelerated at the common ancestor of placentals (Supplementary Fig. 8). Moreover, the parietal is one of the earliest bones to develop even in other non-placental amniotes, and its ossification timing varies little among placentals. Parietal timing possibly reached a plateau at the placental ancestor, and therefore it is not correlated with EQ.
Recent genetic studies have shown that the development of the supraoccipital and brain are genetically integrated. The apparent link between supraoccipital development and brain expansion may be because of the pleiotropic effect of Lmx1b and Dlx5. The supraoccipital and interparietal are either absent or severely reduced in Lmx1b knockout mice32. Furthermore, this gene is critically required for mid/hindbrain development32. Dlx5 is essential for axonogenesis and nervous system development and is reported to be related to Down Syndrome in humans33. It also affects the timing of supraoccipital ossification34, and more importantly, Dlx5 null mutants explicitly lack the supraoccipital and interparietal35.
Our modularity analysis demonstrates that timing of ossification of dermal bones is constrained towards earlier developmental stages, whereas that of endochondral bones occurs later (Fig. 6a). Furthermore, the skull bones form two separate modules, one consisting explicitly of dermal bones and the other of endochondral bones (Fig. 6b,c). It is possible that when sequence heterochrony occurs during evolution, developmental timing of bones of identical developmental modes are likely to covary, and that bones of different developmental modes tend to be more independent from each other. On the other hand, neither mesoderm versus neural crest origin nor phenotypic modularity identified based on adult metric traits29 appears to be related to cranial ossification heterochrony. In the early stages of vertebrate development, Hedgehog signalling critically controls the differentiation of osteoblasts and the onset of osteoclast activity in endochondral bones, while alteration of this signalling has little effect on dermal bone formation36. Such a finding implies the genetic independence of endochondral bones and dermal bones, that is, timing of osteogenesis of endochondral bones and dermal bones are controlled by somewhat independent gene regulatory networks. Together, we suggest that such genetic integration constrains cranial ossification timing both ontogenetically and evolutionarily.
Our study highlights the conserved modular organization imposed on cranial heterochrony and the evolutionary degrees of freedom in this integrated system. Ossification modes fundamentally constrain the evolvability of cranial development. Although the integration of all other endochondral bones is evident, the supraoccipital appears to be rather independent from the rest (Fig. 6b). This bone exhibits the most variable ossification timing among endochondral bones (Supplementary Table 4) and does not form a tight ossification timing cluster with other occipital elements (that is, exoccipital and basioccipital) (Fig. 6a,b), despite the shared somite derivation of all three occipital components37. We suggest that this relative independence of the supraoccipital may be because of its tight link with the brain.
Methods
Specimen collections
Specimens sampled are held at the Anthropological Institute and Museum of University of Zürich (AIMUZ), Botanical Gardens Museum of Hokkaido University (BGHU), Institute of Ecology and Biological Resource of Vietnamese Academy of Science and Technology (IEBR), Japan Monkey Center (JMC), Kyoto University Museum (KUM), Natural History Museum Bern (NMB), Natural History Museum Wien (NMW), Swedish Museum of Natural History Stockholm (NRS), National Museum of Nature and Science Tokyo (NSMT), Palaeontological Institute and Museum of University of Zürich (PIMUZ), Wildlife Laboratory at Tokyo University of Agriculture (TUA), University Museum of University of Tokyo (UMUT), and Berlin Museum of Natural History (ZMB). Specimens used in this study are summarized in Supplementary Data 1.
Data acquisition
Ossification sequence data of 21 cranial elements were documented. Ectotympanic, goniale and alisphenoid of mammals were homologized to angular, prearticular and epipterygoid of non-mammalian amniotes, respectively38. The appearance of bones was assessed non-invasively by acquiring shadow images taken by μCT at the University Museum, University of Tokyo (TXS225-ACTIS, TESCO, Tokyo) and at the Anthropological Institute, University of Zürich (μCT80, Scanco Medical, Bassersdorf). Three-dimensional visualization and analysis of shadow images were conducted in Amira 5.3 (Visage Imaging GmbH, Berlin, Germany). Supplementary Data 2 lists the acquired sequences and those obtained from the literature.
Phylogenetic framework
The topology was arranged in Mesquite39. Phylogenetic framework of species studied and divergence time are based on molecular evidence (Supplementary Table 1). Divergence time has been estimated for all major sauropsid and mammalian clades. Therefore, although not completely consistent internally, the TimeTree of Life-project40 resamples the most comprehensive synopsis of molecular-based phylogenetic studies to date. Several authors published divergence times of lower taxonomic levels. Those were brought into relation with the TimeTree of Life. Therefore, the deepest, most overlapping phylogenetic node between the TimeTree of Life-project and the specific study were compared among each other and brought into relation. The resulting factor was then used to normalize the divergence times of lower taxonomic levels in the specific study. Usually these were known only for one or two subclades. Such normalization was also performed for data of those chapters in the TimeTree of Life40, which show inconsistency towards the higher phylogenetic levels of other chapters. Only few studies exist that present molecular-based divergence times of the mammalian or sauropsid subgroups. Moreover, those studies often do not show nodes that overlap with nodes in the phylogeny of the TimeTree of Life or the subclades of our taxonomic sampling are not represented. In those cases, the branch lengths between the nodes (of unknown age) within a major clade (of known divergence time) were evenly distributed (Supplementary Table 1). Based on this strategy of dating the composite phylogeny, the significance of our results is particularly high on the higher taxonomic levels. Only those are discussed in the present contribution.
Heterochrony analysis
We used two methods, squared-change parsimony23,41 and PGi24, to reconstruct heterochronic changes in amniotes. In the former approach, the sequence of each bone is divided by the maximum rank, resulting in intervals that are standardized between 0 and 1. Then, squared-change parsimony39 based on a Brownian motion model of character evolution and Felsenstein’s independent contrasts42 is used to reconstruct the heterochronic changes at all nodes. The analysis was conducted with the PDAP module of Mesquite39. Divergence times derived from molecular dating were used as branch lengths. As the resolution of the sequence can bias the results in this approach, well-resolved species with more than three ranks were included. The alternative PGi examines the sequence as one single, complex character and uses the Parsimov algorithm as an edit-cost function to optimize ancestral states and sequence heterochronies. The PGi algorithm computes the lowest cost assignment of the ancestral sequences in a two-step, dynamic programming procedure24. The advantage of this approach is that no assumptions are made of the data, outside of those made when evaluating the hypothetical solutions24. The parameters used for the analysis were as follows: 100 cycles, 100 replicates and 100 sequences retained at each node. Semi-exhaustive search with 10,000 permutations was performed. Such runs were conducted four times independently, and the shortest tree was treated as the conservative reconstruction. As the phylogenetic position of turtles is still disputed, and as results by PGi can be affected by polytomies, turtles were excluded from this analysis. The analysis was conducted using ‘ape’, ‘e1071’, and ‘PGi’ packages in R24.
Comparisons with brain size
We compared the relative timing of cranial ossification (scaled from 0 to 1) and EQ26. Phylogenetic effect was corrected using Felsenstein’s independent contrasts42. Significance level was set as P<0.05/21 after Bonferroni correction. Species with <3 ranks were excluded from this analysis to minimize statistical errors. EQ for mammals was calculated following the allometric formula (Log10(brain weight)−(Log10(body weight) × 0.746–1.253) reported by Boddy et al.31, and EQ for non-mammalian amniotes (Log10(brain weight)−(Log10(body weight) × 0.55+0.0155) were computed following the formula reported by Witmer et al.26
Analysis of variation in ossification sequence
To examine the rank variation in sequence of a particular ossification event, we scaled the rank of each ossification event as:
 |
in which r is the absolute rank of a given ossification event, and rmax is the total number of ranks for each species18. Therefore, the relative ranks of each species are distributed between 0 and 1. This allows removing the differences of maximum rank between species resulting from differing levels of sampling resolution between species. A similar approach as standardizing the absolute rank r by the maximum number of ranks (rmax) has been applied in previous sequence heterochrony studies10,43,44. As the ranks are distributed between 1/rmax and 1 with this method, the relative ranks of the earliest bone to ossify can vary, depending on rmax. However, the method used here circumvents this problem because the relative ranks of the earliest event is always be scaled to zero. Nevertheless, some noise remains because species with higher rmax have a lower influence on the variance. The range in rank variation across species was assessed to examine the variability of a particular element in the ossification sequence. As the resolution of the sequence can bias the results in this approach, species only with >3 ranks were included.
Modularity analysis
Neighbour-joining cluster analysis45 based on chord distance was conducted to identify integration of bone ossification timing. Nodes were tested using bootstrapping with 10,000 permutations. Analyses were conducted with PAST46. Here again, well-resolved species only with >3 ranks were included. Then, three hypothetical module divisions, such as developmental modules47,48 (neural-crest-cell bones versus mesoderm bones), ossification mode modules15 (dermal bones versus endochodral bones) and phenotypic variational modules49,50, were tested if these could be recovered in neighbour-joining cluster analysis.
Author contributions
D.K. and M.R.S.-V. designed the project; D.K., N.M., A.M.F., H.E., J.K., S.D.O., S.N.T. and M.R.S.-V. collected specimens; and D.K., I.W., N.M., C.P.E.Z. and M.R.S.-V. performed data analysis and wrote the manuscript. All authors read and approved the manuscript.
Additional information
How to cite this article: Koyabu, D. et al. Mammalian skull heterochrony reveals modular evolution and a link between cranial development and brain size. Nat. Commun. 5:3625 doi: 10.1038/ncomms4625 (2014).
Supplementary Material
Supplementary Figures 1-29, Supplementary Tables 1-4 and Supplementary References
Absence/presence of cranial elements and specimen size.
Relative timing of onset of ossification (ranks) in the cranial elements for all species examined.
Acknowledgments
We are indebted to P. Giere, D. Kalthoff, M. Kato, S. Kawada, M. Motokawa, S. Nogami, P. Schmid, D. Shimizu, F. Takaya and F. Zachos who kindly allowed us to examine the specimens under their care. We thank D. Kubo, G. Suwa and J. Weissmann for their assistance with CT scans; S. Satoshi for providing his weasel specimens and for technical support on R; and L. Harrison for assistance on PGi. We also thank M. Laurin, L. Hautier, S. Kuratani, G. Suwa, N. Irie, T. Suzuki, past and present members of the Palaeontological Institute and Museum of University of Zürich and University Museum of University of Tokyo for discussion and input. This project was funded by Japan Society for Promotion of Science grant 23-4832, 25891010, 24000015, Sasakawa Scientific Research grant 25-501, and Swiss National Fund grant 3100A0-133032/1.
References
- Moore W. J. The Mammalian Skull Cambridge Univ. Press (1981). [Google Scholar]
- Merrill A. E., Eames B. F., Weston S. J., Heath T. & Schneider R. A. Mesenchyme-dependent BMP signaling directs the timing of mandibular osteogenesis. Development 135, 1223–1234 (2008). [DOI] [PMC free article] [PubMed] [Google Scholar]
- Albertson R. C. et al. Molecular pedomorphism underlies craniofacial skeletal evolution in Antarctic notothenioid fishes. BMC Evol. Biol. 10, 4 (2010). [DOI] [PMC free article] [PubMed] [Google Scholar]
- Zollikofer C. P. E. & Ponce de León M. S. Kinematics of cranial ontogeny: heterotopy, heterochrony, and geometric morphometric analysis of growth models. J. Exp. Zool. B Mol. Dev. Evol. 302, 322–340 (2004). [DOI] [PubMed] [Google Scholar]
- Sánchez-Villagra M. R., Goswami A., Weisbecker V., Mock O. & Kuratani S. Conserved relative timing of cranial ossification patterns in early mammalian evolution. Evol. Dev. 10, 519–530 (2008). [DOI] [PubMed] [Google Scholar]
- Maier W. On the evolutionary biology of early mammals -with methodological remarks on the interaction between ontogenetic adaptation and phylogenetic transformation. Zool. Anz. 238, 55–74 (1999). [Google Scholar]
- Koyabu D., Maier W. & Sánchez-Villagra M. R. Paleontological and developmental evidence resolve the homology and dual embryonic origin of a mammalian skull bone, the interparietal. Proc. Nat. Acad. Sci. USA 109, 14075–14080 (2012). [DOI] [PMC free article] [PubMed] [Google Scholar]
- Milinkovitch M. C. & Tzika A. Escaping the mouse trap: the selection of new Evo-Devo model species. J. Exp. Zool. B 308, 337–346 (2007). [DOI] [PubMed] [Google Scholar]
- Werneburg I. et al. Development and embryonic staging in non-model organisms: the case of an afrotherian mammal. J. Anat. 222, 2–18 (2013). [DOI] [PMC free article] [PubMed] [Google Scholar]
- Weisbecker V., Goswami A., Wroe S. & Sánchez-Villagra M. R. Ossification heterochrony in the therian postcranial skeleton and the marsupial-placental dichotomy. Evolution 62, 2027–2041 (2008). [DOI] [PubMed] [Google Scholar]
- Hautier L. et al. Patterns of ossification in southern versus northern placental mammals. Evolution 67, 1994–2010 (2013). [DOI] [PubMed] [Google Scholar]
- Rowe T. B., Macrini T. E. & Luo Z. X. Fossil evidence on origin of the mammalian brain. Science 332, 955–957 (2011). [DOI] [PubMed] [Google Scholar]
- Luo Z. X., Crompton A. W. & Sun A. L. A new mammaliaform from the early Jurassic and evolution of mammalian characteristics. Science 292, 1535–1540 (2001). [DOI] [PubMed] [Google Scholar]
- López E. K., Stock S. R., Taketo M. M., Chenn A. & Ravosa M. J. A novel transgenic mouse model of fetal encephalization and craniofacial development. Integr. Comp. Biol. 48, 360–372 (2008). [DOI] [PubMed] [Google Scholar]
- Richtsmeier J. T. & Flaherty K. Hand in glove: brain and skull in development and dysmorphogenesis. Acta Neuropathol. 125, 1–21 (2013). [DOI] [PMC free article] [PubMed] [Google Scholar]
- Zollikofer C. P. E. & Ponce de León M. S. The evolution of hominin ontogenies. Semin. Cell Dev. Biol. 21, 441–452 (2010). [DOI] [PubMed] [Google Scholar]
- Wagner G. P., Pavlicev M. & Cheverud J. M. The road to modularity. Nat. Rev. Genet. 8, 921–931 (2007). [DOI] [PubMed] [Google Scholar]
- Koyabu D. et al. Heterochrony and developmental modularity of cranial osteogenesis in lipotyphlan mammals. EvoDevo. 2, 21 (2011). [DOI] [PMC free article] [PubMed] [Google Scholar]
- Mallarino R. et al. Two developmental modules establish 3D beak-shape variation in Darwin’s finches. Proc. Natl Acad. Sci. USA 108, 4057–4062 (2011). [DOI] [PMC free article] [PubMed] [Google Scholar]
- Goswami A., Weisbecker V. & Sánchez-Villagra M. R. Developmental modularity and the marsupial-placental dichotomy. J. Exp. Zool. B Mol. Dev. Evol. 312, 186–195 (2009). [DOI] [PubMed] [Google Scholar]
- Schoch R. R. Skull ontogeny: developmental patterns of fishes conserved across major tetrapod clades. Evol. Dev. 8, 524–536 (2006). [DOI] [PubMed] [Google Scholar]
- de Bakker M. A. et al. Digit loss in archosaur evolution and the interplay between selection and constraints. Nature 500, 445–448 (2013). [DOI] [PubMed] [Google Scholar]
- Germain D. & Laurin M. Evolution of ossification sequences in salamanders and urodele origins assessed through event-pairing and new methods. Evol. Dev. 11, 170–190 (2009). [DOI] [PubMed] [Google Scholar]
- Harrison L. B. & Larsson H. C. E. Estimating evolution of temporal sequence changes: a practical approach to inferring ancestral developmental sequences and sequence heterochrony. Syst. Biol. 57, 378–387 (2008). [DOI] [PubMed] [Google Scholar]
- Jeffery J. E., Bininda-Emonds O. R. P., Coates M. I. & Richardson M. K. A new technique for identifying sequence heterochrony. Syst. Biol. 54, 230 (2005). [DOI] [PubMed] [Google Scholar]
- Witmer L. M., Chatterjee S., Franzosa J. & Rowe T. Neuroanatomy of flying reptiles and implications for flight, posture and behaviour. Nature 425, 950–953 (2003). [DOI] [PubMed] [Google Scholar]
- Garland T., Bennett A. F. & Rezende E. L. Phylogenetic approaches in comparative physiology. J. Exp. Biol. 208, 3015–3035 (2005). [DOI] [PubMed] [Google Scholar]
- Gross J. B. & Hanken J. Review of fate-mapping studies of osteogenic cranial neural crest in vertebrates. Dev. Biol. 317, 389–400 (2008). [DOI] [PubMed] [Google Scholar]
- Porto A., de Oliveira F. B., Shirai L. T., De Conto V. & Marroig G. The evolution of modularity in the mammalian skull I: morphological integration patterns and magnitudes. Evol. Biol. 36, 118–135 (2009). [Google Scholar]
- Symonds M. R. E. Phylogeny and life histories of the ‘Insectivora’: controversies and consequences. Biol. Rev. 80, 93–128 (2005). [DOI] [PubMed] [Google Scholar]
- Boddy A. et al. Comparative analysis of encephalization in mammals reveals relaxed constraints on anthropoid primate and cetacean brain scaling. J. Evol. Biol. 25, 981–994 (2012). [DOI] [PubMed] [Google Scholar]
- Dai J. X., Johnson R. L. & Ding Y. Q. Manifold functions of the Nail-Patella Syndrome gene Lmx1b in vertebrate development. Dev. Growth Differ. 51, 241–250 (2009). [DOI] [PubMed] [Google Scholar]
- Dierssen M. Down syndrome: the brain in trisomic mode. Nat. Rev. Neurosci. 13, 844–858 (2012). [DOI] [PubMed] [Google Scholar]
- Acampora D. et al. Craniofacial, vestibular and bone defects in mice lacking the Distal-less-related gene Dlx5. Development 126, 3795–3809 (1999). [DOI] [PubMed] [Google Scholar]
- Zhu H. & Bendall A. J. Dlx5 is a cell autonomous regulator of chondrocyte hypertrophy in mice and functionally substitutes for Dlx6 during endochondral ossification. PLoS ONE 4, e8097 (2009). [DOI] [PMC free article] [PubMed] [Google Scholar]
- Hammond C. L. & Schulte-Merker S. Two populations of endochondral osteoblasts with differential sensitivity to Hedgehog signalling. Development 136, 3991–4000 (2009). [DOI] [PubMed] [Google Scholar]
- Kuratani S. Craniofacial development and the evolution of the vertebrates: the old problems on a new background. Zool. Sci. 22, 1–19 (2005). [DOI] [PubMed] [Google Scholar]
- Luo Z. X. Developmental patterns in Mesozoic evolution of mammal ears. Annu. Rev. Ecol. Evol. Syst. 42, 355–380 (2011). [Google Scholar]
- Maddison W. P. & Maddison D. R. Mesquite: a Modular System for Evolutionary Analysis. Version 2.75 http://mesquiteproject.org (2011).
- Hedges S. B. & Kumar S. The TimeTree of Life Oxford Univ. Press (2009). [Google Scholar]
- Meslin C. et al. Evolution of genes involved in gamete interaction: evidence for positive selection, duplications and losses in vertebrates. PLoS ONE 7, e44548 (2012). [DOI] [PMC free article] [PubMed] [Google Scholar]
- Felsenstein J. Phylogenies and the comparative method. Am. Nat. 125, 1–15 (1985). [DOI] [PubMed] [Google Scholar]
- Hautier L. et al. Skeletal ossification and sequence heterochrony in xenarthran evolution. Evol. Dev. 13, 460–476 (2011). [DOI] [PubMed] [Google Scholar]
- Wilson L. A. B. et al. Skeletogenesis and sequence heterochrony in rodent evolution, with particular emphasis on the African striped mouse, Rhabdomys pumilio (Mammalia). Org. Divers. Evol. 10, 243–258 (2010). [Google Scholar]
- Saitou N. & Nei M. The neighbor-joining method: a new method for reconstructing phylogenetic trees. Mol. Biol. Evol. 4, 406–425 (1987). [DOI] [PubMed] [Google Scholar]
- Hammer Ø., Harper D. A. T. & Ryan P. D. PAST: paleontological statistics software package for education and data analysis. Palaeontol. Electron. 4, 9 (2001). [Google Scholar]
- Jiang X., Iseki S., Maxson R. E., Sucov H. M. & Morriss-Kay G. M. Tissue origins and interactions in the mammalian skull vault. Dev. Biol. 241, 106–116 (2002). [DOI] [PubMed] [Google Scholar]
- Yoshida T., Vivatbutsiri P., Morriss-Kay G., Saga Y. & Iseki S. Cell lineage in mammalian craniofacial mesenchyme. Mech. Dev. 125, 797–808 (2008). [DOI] [PubMed] [Google Scholar]
- Marroig G. & Cheverud J. M. A comparison of phenotypic variation and covariation patterns and the role of phylogeny ecology and ontogeny during cranial evolution of New World monkeys. Evolution 55, 2576–2600 (2001). [DOI] [PubMed] [Google Scholar]
- Marroig G. & Cheverud J. M. Did natural selection or genetic drift produce the cranial diversification of neotropical monkeys? Am. Nat. 163, 417–428 (2004). [DOI] [PubMed] [Google Scholar]
- Kermack K., Mussett F. & Rigney H. The skull of Morganucodon. Zool. J. Linn. Soc. 71, 1–158 (1981). [Google Scholar]
- Kielan-Jaworowska Z., Cifelli R. & Luo Z. X. Mammals from the Age of Dinosaurs: Origins, Evolution, and Structure Columbia Univ. Press (2004). [Google Scholar]
Associated Data
This section collects any data citations, data availability statements, or supplementary materials included in this article.
Supplementary Materials
Supplementary Figures 1-29, Supplementary Tables 1-4 and Supplementary References
Absence/presence of cranial elements and specimen size.
Relative timing of onset of ossification (ranks) in the cranial elements for all species examined.