Abstract
Current evidence suggests that delta oscillations (0.5–4 Hz) in the brain are generated by intrinsic network mechanisms involving cortical and thalamic circuits. Here we report that delta band oscillation in spike and local field potential (LFP) activity in the whisker barrel cortex of awake mice is phase locked to respiration. Furthermore, LFP oscillations in the gamma frequency band (30–80 Hz) are amplitude modulated in phase with the respiratory rhythm. Removal of the olfactory bulb eliminates respiration-locked delta oscillations and delta-gamma phase-amplitude coupling. Our findings thus suggest respiration-locked olfactory bulb activity as a main driving force behind delta oscillations and gamma power modulation in the whisker barrel cortex in the awake state.
 Oscillatory neuronal activity in the mammalian neocortex is implicated in cognitive processes but its generation is poorly understood. In this study, the authors show that delta band oscillatory activity in mice phase-locks with respiratory activity and that this is mediated by activity in the olfactory bulb.
Oscillatory neuronal activity is a common phenomenon in mammalian neocortex and can be readily observed in local field potential (LFP) and electroencephalogram (EEG) signals1. Oscillations occur across a broad range of frequencies including slow (0.5–8 Hz) delta/theta and high-frequency gamma band (30–80 Hz) oscillations2. How oscillatory brain activity is generated and controlled, particularly in the low (delta, 0.5–4 Hz)-frequency range, and how oscillations relate to behaviour are only partially understood3. Neocortical neuronal oscillations in the delta frequency range (0.5–4 Hz) are believed to be generated by mechanisms involving both neocortical and thalamic neuronal circuits4,5 and are commonly associated with slow-wave sleep in both humans and animals. However, delta band oscillatory activity in LFP and spike activities was also observed in the whisker barrel cortex of awake, head-fixed mice6,7,8. At rest, mice breathe rhythmically at frequencies between 1 and 3 Hz, which corresponds to the delta frequency range of neuronal oscillations. While it has been shown on a behavioural level that respiration and whisker movements are dynamically phase locked in this frequency band9,10,11, whether the neuronal rhythm in the barrel cortex is related to respiration has not been investigated.
To examine a possible link between barrel cortical delta oscillations in awake mice breathing at resting respiratory rate, we simultaneously measured breathing rhythm and neuronal activity in the whisker barrel cortex of awake head-fixed mice. We found that delta band neuronal oscillations in the whisker barrel cortex were phase locked to the respiratory rhythm and were mostly driven by olfactory bulb activity. Furthermore, phase–amplitude coupling analysis showed that LFP oscillations in the gamma frequency band were amplitude modulated in phase with the respiratory rhythm. Thus, our results demonstrate that respiratory activity directly modulates slow (1–4 Hz), rhythmic neuronal activity in the somatosensory whisker barrel cortex and indirectly modulates gamma band power through phase–amplitude coupling mechanisms. Several studies have linked theta-gamma phase–amplitude coupling to sensory, motor and cognitive processes12,13,14,15. Our findings thus suggest a possible neuronal mechanism for cross-modal interactions between olfaction and whisker tactile sensation9,10,11.
Results
Respiration-locked LFP oscillations in the barrel cortex
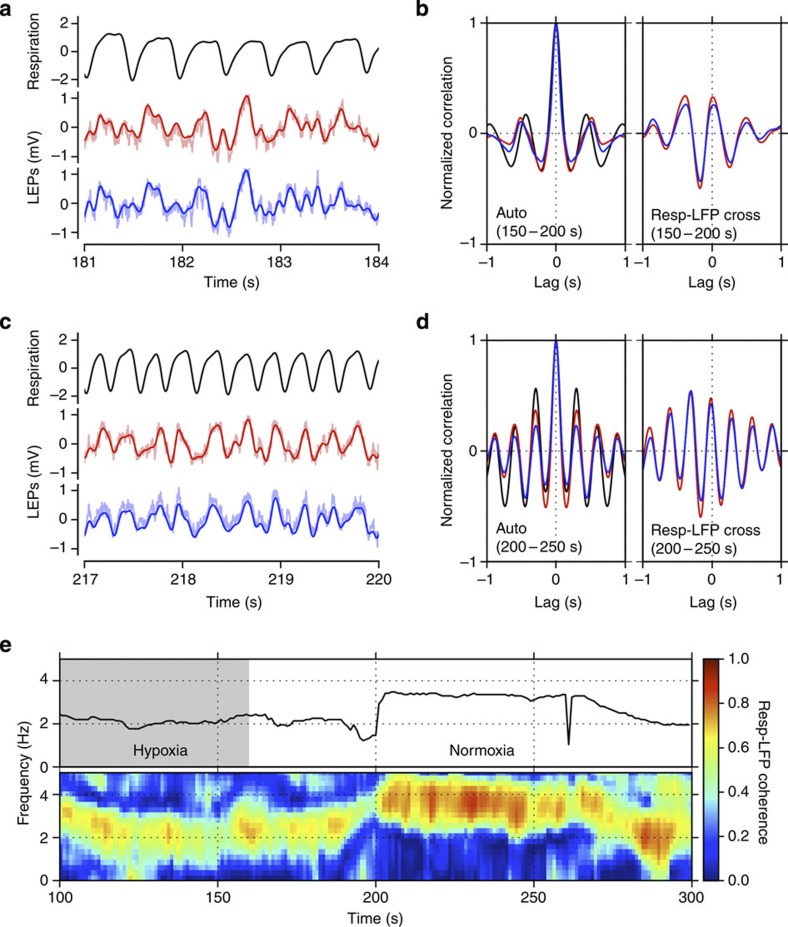
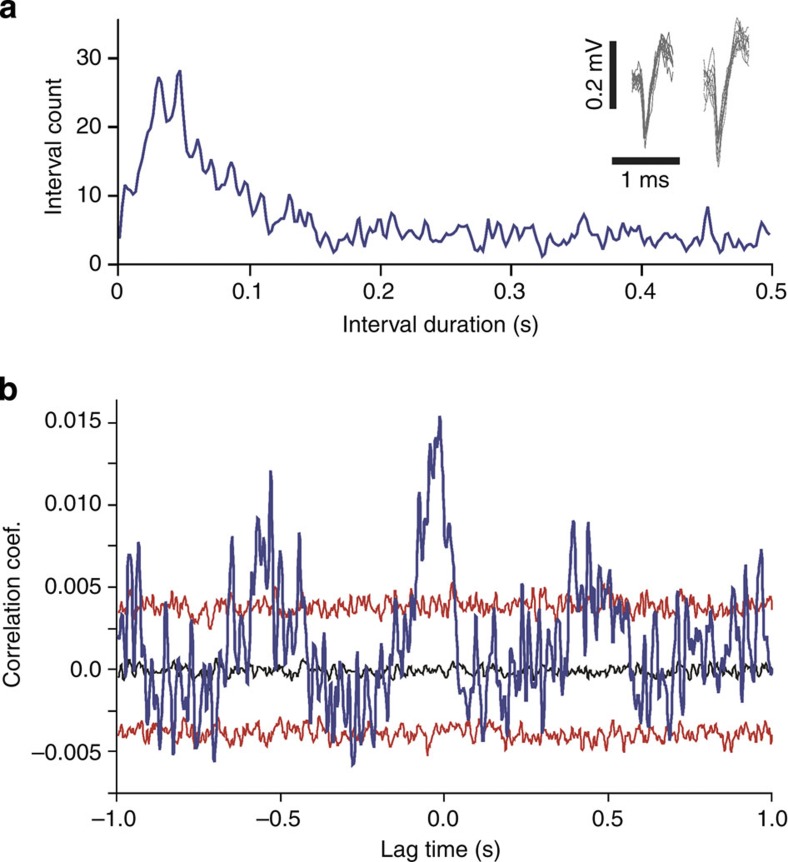
Using multiple-electrode extracellular recording techniques, we measured spike and local field potential (LFP) activity in the somatosensory whisker barrel cortex of awake, head-fixed mice. Simultaneously, respiratory activity was monitored non-invasively by measuring the air temperature fluctuations in front of the nostrils (see Methods). LFP as well as single- and multi-unit spike activity were rhythmically correlated with respiration (Figs 1, 2).
Figure 1. Oscillatory neuronal activity phase locks with breathing.
Correlation and coherence between respiratory and local field potential (LFP) signals in barrel cortex in an awake mouse. Data from one mouse are shown, but results were reproduced in five out of five mice. (a) Respiratory rhythm (black) and two LFP signals simultaneously recorded in the whisker barrel cortex (red and blue) at rest. Recording sites were 300 μm apart. (b) Autocorrelations (left) of respiratory and LFP signals and LFP-respiration cross-correlations (right). Curve colours correspond to those in a. (c) Same recordings as in a, but during accelerated breathing induced by brief exposure to hypoxic air. (d) Autocorrelations (left) of respiratory and LFP signals and LFP-respiration cross-correlations (right). Curve colours correspond to those in a. (e) Instantaneous respiration frequency (top) and LFP-respiration coherency (bottom) during normal accelerated breathing elicited by exposure to hypoxic air. Respiration frequency and coherency were computed within 5-s time windows, moved in 2.5-s steps. The coherence was plotted in a pseudo-colour code shown on the right. Grey background in top panel indicates time of exposure to hypoxic air. Data shown in a and c are two 3-s segments of the full data range shown in e (the time axes in a and c are common with the one in e).
Figure 2. Spike activity is rhythmically correlated with respiration.
Single- (n=3) and multi-unit (n=9) spike activity was recorded in the whisker barrel cortex of two awake mice. The cross-correlations of spike activity with breathing was significant for 3/3 single units and 8/9 multi-unit recordings. (a) Inter-spike interval histogram of single-unit spike activity recorded over 10 min in the whisker barrel cortex of an awake mouse. Inset shows overlays of waveforms of the first (left) and last (right) 10 action potentials. (b) Cross-correlation of single-unit spike activity with respiration (time of onset of the inspiratory cycle). The blue line represents the raw cross-correlation. The black line represents the median of the distribution of surrogate correlations. Top and bottom red lines represent the 5th and 95th percentile of the surrogate correlation distribution, respectively (see Methods or details). Raw correlations were considered significant if cross-correlation values exceeded the 5 or 95 percentile boundaries of the surrogate correlation distributions.
Effects of olfactory bulbectomy on oscillations
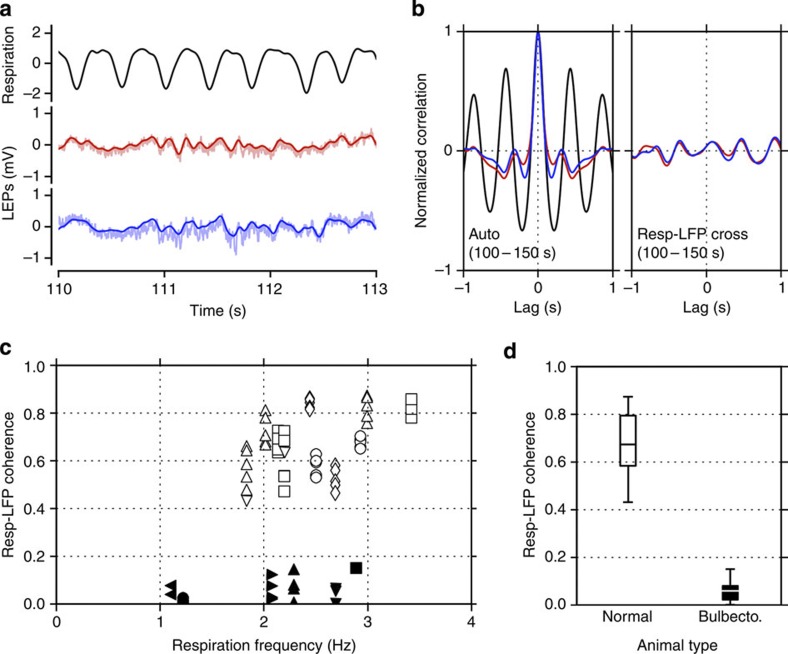
Respiration-locked neuronal activity is known to occur in the rodent olfactory bulb, driven by the activation of olfactory sensory neurons with each breath through the nose16,17. Fontanini et al.18,19 have shown that these oscillations can propagate to the olfactory piriform cortex. The average respiratory rate in C57BL/6J mice at rest is 165 breaths min−1 or 2.75 Hz (ref. 20). Hence, mice breathe at a resting rate that lies within the 1–4 Hz delta frequency range defined for neuronal oscillations1. We asked whether respiration-locked neuronal delta band oscillations in the sensory whisker barrel could be driven by olfactory bulb activity. As a first experimental approach, we surgically removed the olfactory bulb (in n=6) mice. Olfactory bulbectomies eliminated barrel cortical delta band oscillations and the correlation between respiration and LFPs (Fig. 3). We quantified this reduction in the locking between respiration and LFP in terms of their coherence at the respiration frequency. This decrease in the LFP-respiration coherence due to bulbectomy corresponds to an average reduction by 91% (Fig. 3), hence a highly significant decrease (P<0.001 (two-sides), Mann–Whitney U-test).
Figure 3. Olfactory bulb activity drives cortical oscillations.
Reduction of coherence between respiration and local field potential (LFP) signals in intact and olfactory bulbectomized mice recorded in awake, head-fixed conditions. (a) Respiration (black) measured as the temperature in front of the mouse’s nostrils and simultaneously recorded LFP signals (red and blue) in the barrel cortex of a bulbectomized mouse. The respiration signal was normalized by subtraction of the mean and division by the s.d. (b) Autocorrelations (left) of the LFP and respiratory signals shown in a and cross-correlations (right) between the respiratory signal and either of the LFP signals in a. Red and blue curves represent the cross-correlations obtained from the LFPs drawn by the corresponding colour in a. (c) Coherence between respiratory signals and LFP signals plotted against respiration frequency. Individual data points represent the coherence within a data segment of 50 s between respiration and the simultaneously recorded LFP signal. Different symbols represent different mice, and white and black symbols represent intact and bulbectomized mice, respectively. A total of 52 and 18 50-s segments were sampled from five intact and six bulbectomized mice, respectively. Multiple identical symbols represent multiple parallel LFP measurements (with up to five electrodes in the whisker barrel cortex) or multiple LFP samples from the same recording site in one mouse. Each symbols position along the x axis is determined by the average respiratory rate during the corresponding 50-s segment. (d) Summary of the data shown in c. White and black box-and-whisker plots represent the means (ticks inside the boxes), the 1st and 3rd quartiles (bottom and top ends of the boxes) and the extents of the data (whiskers) for the white and black data points in c, respectively.
LFP oscillations related to nasal airflow
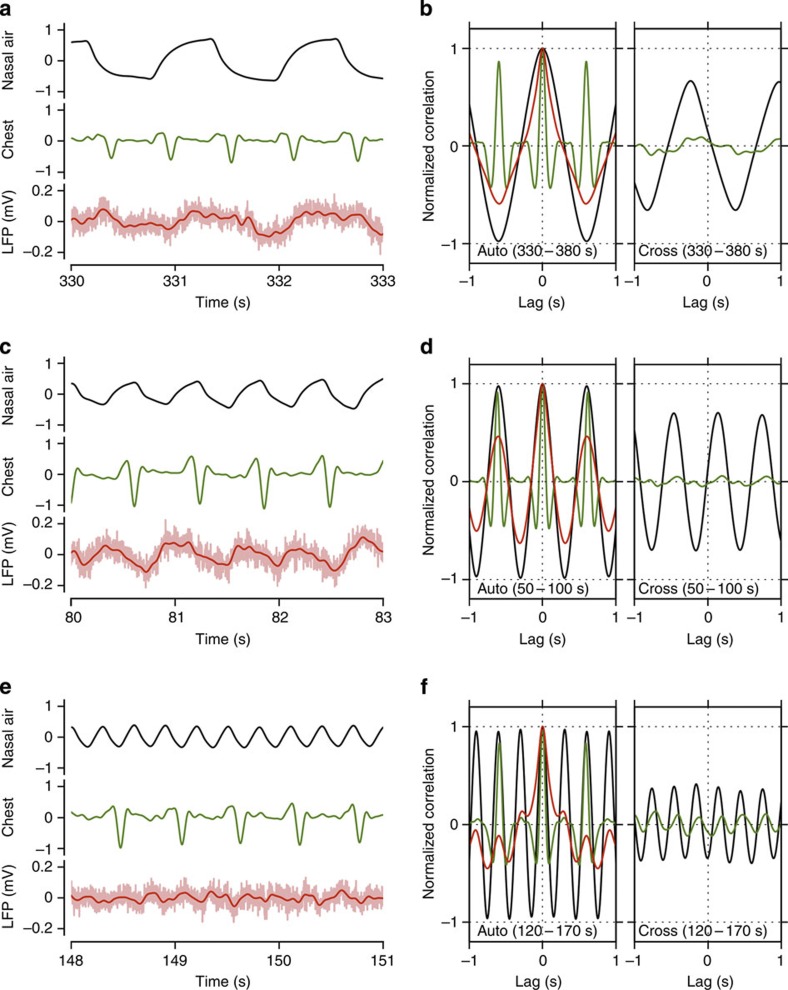
To control if other effects not related to respiration were responsible for the loss of coherence between respiration and LFP in bulbectomized mice, we performed tracheotomies in intact, anaesthetized mice (n=3) to eliminate respiration through the nose. This manipulation selectively prevented activation of the olfactory bulb through nasal airflow while leaving the bulb intact. LFP activity was recorded in the whisker barrel cortex and respiratory activity was monitored through chest movements. In addition, we generated an artificial rhythmic airflow through the nose independent from the spontaneous tracheal respiration (Fig. 4). This was performed at three different frequencies of airflow and a controlled volume that mimicked the mouse’s resting tidal volume of ~0.15 ml (see Method). Frequencies for artificial nasal airflow were chosen to be lower (0.8 Hz), higher (3.2 Hz) or the same (1.6 Hz) as the average spontaneous respiratory rate of the anaesthetized mouse. In tracheotomized mice, the correlation between respiration and barrel cortical LFP activity was weak (Fig. 4b,d,f, right, green), but the LFP activity was strongly correlated with the rhythmic nasal airflow (Fig. 4b,d,f, right, black) at all three frequencies tested. The highest correlation between nasal airflow and LFP activity occurred at a 1.6-Hz rhythm of nasal airflow. This could be due to resonance phenomena in cortical principal neurons, which have been shown to possess a preferred subthreshold frequency close to 1.6 Hz (ref. 21).
Figure 4. Nasal airflow is required to link respiration to cortical oscillations.
Local field potential (LFP) oscillations in whisker barrel cortex related to nasal airflow in an anaesthetized tracheotomized mouse. Data are shown from one mouse, but results were reproduced in 3/3 mice. (a) Raw signals representing nasal airflow modulated at 0.8 Hz through the opening of the ascending trachea (black), spontaneous breathing through the opening of the descending trachea measured as chest movement (green) and barrel cortical LFP (light red: raw signal, red: filtered in 0.5–10 Hz). (b) Autocorrelations (left) of the signals in a with the same colour convention, and cross-correlations (right) of the filtered LFP signal to the nasal airflow (black) and to the chest movement (green). All the correlations were computed from data segments of 50 s duration that include the traces shown in a, as indicated by the labels within the panels. (c) As in a with nasal airflow modulated at 1.6 Hz. (d) Auto- and cross-correlations as in b for the signals in c. (e) As in a with nasal airflow modulated at 3.2 Hz. (f) Auto- and cross-correlations as in b for the signals in e. The units of the nasal airflow and the chest movement are arbitrary, but common across a,c and e.
LFP activity follows electrical olfactory bulb stimulation
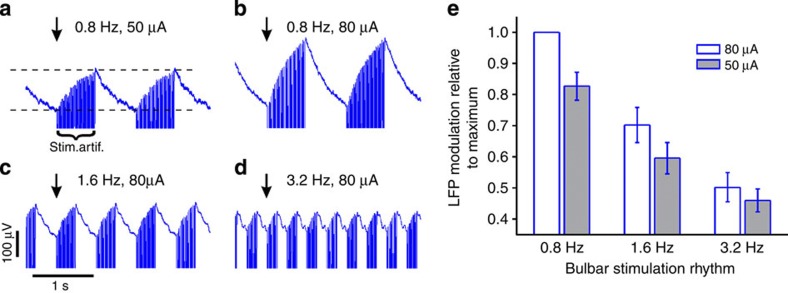
The rhythmic airflow through the nose might exert small mechanical forces on the olfactory bulb that could cause neuronal responses due to small movements of the brain tissue against the recording electrodes. We therefore performed another control experiment in which we eliminated nasal airflow by performing a tracheotomy, but now modulated neuronal activity in the olfactory bulb through electrical stimulation while recording barrel cortical LFP activity. We used rhythmic electrical stimulation consisting of brief trains of current steps to activate the ipsilateral olfactory bulb at the same frequencies used for the artificial nasal airflow stimulation (0.8, 1.6 and 3.2 Hz) in the previous experiment. These stimuli caused stimulus-locked rhythmic fluctuations of the barrel cortical LFPs (Fig. 5), confirming that rhythmic olfactory bulb activity rhythmically modulates neuronal activity in the whisker barrel cortex.
Figure 5. Electrical stimulation of the olfactory bulb entrains cortical activity.
(a) Average barrel cortical LFP response to electrical stimulation of the ipsilateral olfactory bulb with a 0.8-Hz rhythmic stimulus. The stimulus consisted of 50 Hz trains of 10-ms current steps (50 μA) repeated every 1.25 s (=0.8 Hz). The arrow points to the onset of the stimulus train. Electrical stimulation artefacts (marked by curly brackets labelled stim.artif.) appear as dense vertical lines truncated at the bottom. LFP signals were averaged across 30 stimulus trains. The LFP increased during bulbar stimulation and decreased again during the inter-train interval. The average LFP response amplitude was measured as the difference between the voltage at the time of the onset and end of the stimulus train in the averaged signal, as marked by the two dashed horizontal lines. (b) Average barrel cortical LFP response to the same stimulus as in a but with a higher stimulus current (80 μA). The LFP increased faster with higher stimulus current. (c,d) Average barrel cortical LFP response to bulbar stimulation (80 μA) at 1.6 Hz (c) and 3.2 Hz (d). In all cases, bulbar stimulation was through a concentric bipolar electrode (SNEX 100x, Kopf Instruments, USA). Stimulus timing was controlled using Spike2 software and the D/A output of the CED 1401 (both Cambridge Electronic Design, UK) and stimulus currents were generated by a battery driven stimulus isolation unit (A380, World Precision Instruments, USA). (e) Average LFP responses measured as described in a to three different stimulus frequencies at two different stimulus currents. Responses to each stimulus frequency-current combination were measured in three mice. Response amplitudes are normalized to each animal’s maximum response to the 0.8 Hz/80 μA stimulus and averaged across the three mice. Response amplitude was a function of stimulus current and stimulus frequency. Error bars show s.e.m.
Phase–amplitude coupling of gamma and respiratory rhythms
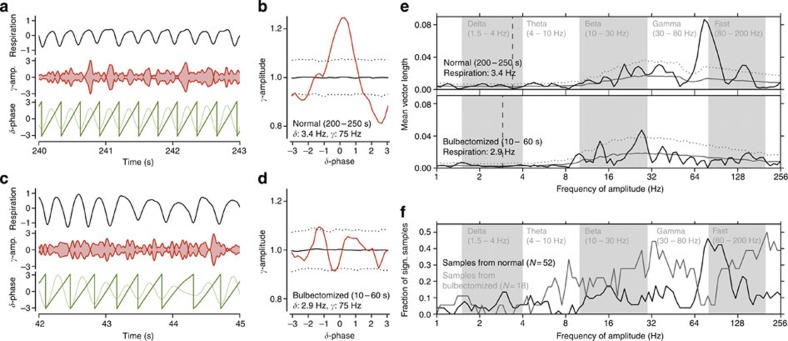
Recent studies suggest that gamma band amplitude or power is modulated in phase with delta band oscillations, a finding referred to as phase–amplitude coupling14,15,22. Our data also show this type of cross-frequency interaction. We found that the power of gamma oscillations (75 Hz) in the whisker barrel cortex was modulated in phase with the respiratory cycle (Fig. 6). Thus, not only slow oscillations but also higher-frequency activities in the whisker barrel cortex are linked to respiration. Such cross-frequency coupling has been implicated in spatial and temporal coordination of neuronal activity associated with higher brain functions14,23. By use of a bootstrap statistical approach, using phase-randomized surrogate data (see Methods) we show that removal of the olfactory bulb eliminated the respiration-related modulation of power around the frequency range of transition from gamma (30–80 Hz) to fast (80–200 Hz) oscillations. The opposite occurred in frequency ranges below and above this band where phase–amplitude coupling was observed after olfactory bulbectomy (Fig. 6).
Figure 6. Respiratory modulation of power in high-frequency oscillations.
Phase–amplitude coupling between respiration-locked delta and gamma band oscillations in the barrel cortical LFP activity of an awake intact and an awake bulbectomized mouse, followed by population statistics. (a) Respiratory activity (top trace), amplitude of gamma band oscillations (middle trace) and delta oscillations (light green bottom trace) and its phase (dark green bottom trace) in an intact mouse. Gamma oscillation (75 Hz) amplitude peaks rhythmically phase locked to the delta cycle. (b) Gamma oscillation amplitude as a function of delta phase (red). The solid and dotted black lines indicate the mean and the 2.5 and 97.5 percentile boundaries of the surrogate amplitude distribution estimated from 1000 phase-randomized surrogates. Gamma amplitude modulation is significant at phase 0 of the delta cycle. (c,d) Same as a,b, respectively, but for a bulbectomized mouse. After removal of the olfactory bulb, the amplitude modulation of the gamma band oscillations is no longer phase locked to respiration. (e) Quantitative analysis of phase–amplitude coupling by the mean vector length (MVL, solid black lines) between the phase of the respiratory (delta) frequency and the amplitudes of a range of frequencies from 1 to 256 Hz (logarithmically scaled). Grey and white backgrounds delineate commonly used frequency band boundaries1. The solid and dotted grey lines indicate the mean and the 95 percentile, respectively, of surrogate mean vector length values estimated from 1,000 phase-randomized surrogates. (f) Population statistics of respiration-LFP phase–amplitude coupling in intact and bulbectomized mice. MVL values were computed from the same set of LFP segments as used in the coherence analysis in Fig. 2c (52 samples from five intact and 18 samples from six bulbectomized mice). The graphs represent the fraction of samples exceeding the 95 percentile boundary of the surrogate MVL value distribution in intact (black) and bulbectomized mice (grey) plotted as a function of amplitude frequency (logarithmically scaled). Phase frequency was fixed at the respiratory frequency.
Retrograde tracing
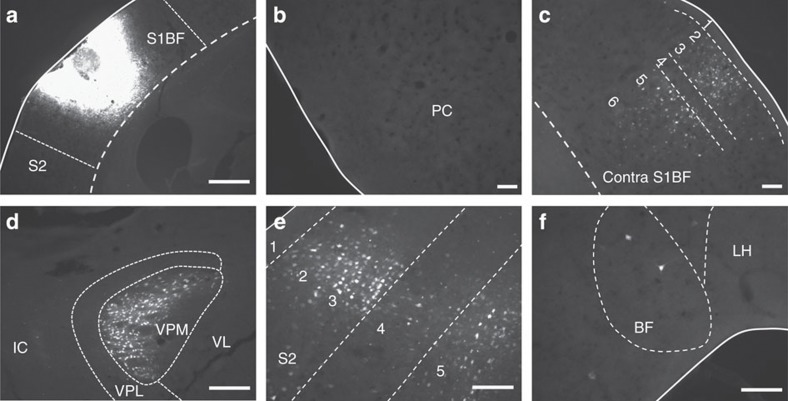
The pathway through which respiration-locked neuronal activity reaches the whisker barrel cortex is currently unknown. The large olfactory or piriform cortex in mice is known to show respiration-locked neuronal oscillations18,19 and is thus a plausible link in the pathway from the main olfactory bulb to the barrel cortex. To determine whether the whisker barrel cortex receives direct projections from the piriform cortex or other olfaction-related areas, such as the entorhinal cortex, the amygdala or the orbitofrontal cortex24,25, we injected a retrograde tracer (Fluorogold) into the barrel cortex (see Methods). Labelling of forebrain neurons projecting to the whisker barrel cortex was consistent with previous studies (for example, ref. 26). Projection neurons were found in ventral posteromedial thalamus (VPM) and to a lesser extent as well in ventral posterolateral thalamus (VPL). Labelled neurons were also found in several cortical areas, including contralateral barrel cortex, as well as adjacent ipsilateral cortical areas, including secondary somatosensory (S2), entorhinal and insular cortex and rostral motor cortex. In somatosensory cortical areas, projection neurons were predominantly found in layers 2,3 and 5, but not in layers 1 or 4. Sparse, large labelled neurons were found in basal forebrain nuclei—these are likely cholinergic neurons in the nucleus basalis known to project to multiple cortical areas.
Discussion
We find that respiration-locked olfactory bulb activity caused by airflow through the nose is a major driving force behind delta band neuronal oscillations in the somatosensory cortex of awake mice. Coherence of cortical neuronal oscillations with respiration was reduced by 91% after removal of the olfactory bulb (Fig. 3). Somatosensory cortical oscillations could be directly linked to olfactory bulb activity by experiments involving controlled airflow activation of the bulb in tracheotomized mice (Fig. 4) or through electrical stimulation of the bulb (Fig. 5). Both manipulations result in the modulation of barrel cortical activity phase locked to the airflow or electrical stimulation.
Adrian27 showed already in 1950 that respiration drives oscillatory spike and LFP activity in the mammalian olfactory bulb. A recent study in rats confirmed that respiration-locked oscillations in the bulb depend on rhythmic airflow through the nose17. These oscillations do not require the detection of odours because mammalian olfactory sensory neurons are also mechanical sensors, signalling pressure changes caused by nasal airflow28.
The influence of respiration-locked olfactory bulb activity on the whisker barrel cortex is not limited to delta band oscillations. Phase–amplitude coupling analysis reveals that the power of gamma band oscillatory activity in the whisker barrel cortex is modulated in phase with respiration-locked delta band activity.
An interaction between respiration as a behaviour linked to olfaction and active whisker movements for tactile exploration has been suggested by Welker, based on early behavioural observations in rats29. Recent studies confirmed that respiratory and whisker tactile behaviours are coordinated in mice9 and rats10, suggesting a coordinated interaction of olfactory and tactile sensory acquisition. The fact that the two sensory systems are not independent is further supported by studies showing that the loss of one results in increased sensitivity in the other sensory modality30,31.
Whisking and breathing movements in mice are dynamically correlated with correlations being particularly strong during slow whisking (<5 Hz)9. Thus, during slow whisking, sensory input from the whiskers is likely to contribute to the breathing-LFP coherence in the whisker barrel cortex, in addition to olfactory bulb sensory input. However, the contribution of whisker sensory feedback to breathing-LFP coherence can be no larger than ~10% of the maximal coherence, since bulbectomy experiments show that olfactory bulb activity accounts for ~90% of LFP-breathing coherence.
Since delta band oscillations in cortical activity are also found in mammals who breathe much slower than mice (for example, humans), parallel neuronal mechanisms likely involving thalamocortical circuits exist that generate delta oscillations independent of the respiratory rhythm. Our findings suggest, however, that respiration might cause a rhythmic modulation of somatosensory cortical activity at the species-specific respiratory rates. Removing the olfactory bulb reduces the breathing-LFP coherence at the respiratory frequency by 91%. Thus, in mice olfactory bulb activity was responsible for most of the respiration-locked neuronal oscillations, but other respiration related to sensory inputs, e.g., from the trigeminal nasal airflow sensors, upper airway sensors and chest muscles, are likely to contribute as well. Those could be responsible for the residual respiration-locked modulation observed in bulbectomized mice and would also be present in animals with poor or no sense of olfaction, like dolphins.
Our findings provide a potential neuronal mechanism for the interaction between olfactory and whisker tactile sensation in awake-behaving mice. Behavioural studies have shown that the timing of respiratory and whisker movements are dynamically coordinated9,11. The results by Cao et al.9 suggest that active odour and tactile sensing through sniffing and high-frequency whisking can occur independently in mice , while a study by Deschenes and colleagues suggests continuous strong phase locking between the two rhythms in rats11.
Gamma oscillations in the barrel cortex of rats have been shown to increase immediately before exploratory whisking behaviour32 and after mechanical whisker stimulation33. Whether these changes in gamma activity were linked to respiration was not addressed in those studies. Our results suggest that the modulation of barrel cortical gamma band power in phase with respiration could play a role in coordinating olfactory and tactile sensory processing. Additional clues about the potential functional role of respiration-locked oscillations in whisker sensory processing might come from a comparative investigation of different species. Rats, gerbils, hamsters and chinchillas, who also have barrel cortices and motile whiskers, also have resting respiratory rates within the delta frequency band (~1.2, 1.4, 0.7 and 0.7 Hz, respectively). On the basis of our findings those species could be expected to show respiration-locked gamma power modulation in the barrel cortex, similar to mice. In contrast, Guniea pigs possess a whisker barrel cortex but have immotile mystacial whiskers and thus lack active whisker-sensing behaviour. If respiration-locked modulations of gamma power does play a role in the coordination of respiration with whisker tactile sensing, it could be less pronounced or even absent in animals without active tactile sensing.
In summary, respiration-locked neuronal oscillation in the olfactory bulb is a major driving force behind delta band neuronal oscillations in the somatosensory cortex of mice. Furthermore, gamma band oscillations, which have been widely implicated in higher cortical processing, are amplitude modulated in phase with respiration. Thus, the life supporting respiratory behaviour, believed to be controlled mostly by brain stem centres, has an unexpected, indirect influence on higher-order brain activity in mice, via the olfactory system. Whether similar influences of breathing on brain activity also exist in other cortical areas and possibly also in humans, whose olfactory bulb is much reduced in size relative to the neocortex, remain to be shown.
Methods
Animals
Experiments were performed on adult male C57BL/6J (B6) mice (>8 weeks old, 18–25 g body weight). Male mice were used to avoid variability in behavioural physiological measures related to oestrous cycle. Mice were housed in a breeding colony with 12-hour light/dark cycles in standard cages housing maximally five adult mice with ad libitum access to food and water. All experiments were performed during the light cycle (between 1200 and 1700 hours). None of the mice had undergone any previous experimental procedure. All animal experimental procedures adhered to guidelines approved by the University of Tennessee Health Science Center Animal Care and Use Committee. Principles of laboratory animal care (NIH publication No. 86–23, rev. 1996) were followed.
Preparation for awake, head-fixed recording
For surgeries, mice were anaesthetized with 3% Isoflurane (Baxter Pharmaceutical Products, Deerfield IL) in oxygen in an incubation chamber, transferred to a stereotaxic head mount and anaesthesia was continued with 1–2.5% Isoflurane in oxygen through a mouthpiece. Isoflurane concentration was controlled with a vaporizer (Highland Medical Equipment, CA). The depth of anaesthesia was adjusted until the mice failed to show a reflex withdrawal of the hind paw to a strong pinch. Blunt ear bars were used to prevent damaging the eardrums. Core body temperature, measured with a rectal thermometer, was maintained between 36.5 and 38.0 °C with a feedback-controlled heating pad (FHC Inc., Bowdoinham, ME). Surgical techniques were described in detail elsewhere34,35. In brief, a small craniotomy (diameter, 1-2 mm) was made over the right whisker barrel cortex 1 mm posterior to Bregma and 3.5 mm lateral to the midline. The exposed but intact dura was covered with Triple Antibiotic (Walgreens, US) to keep it moist and reduce the risk of infection. A cylindrical plastic chamber (0.45 cm diameter and 8 mm height) was placed over the skull opening and filled with Triple Antibiotic. Three small machine screws (1/8′ dome head, 0.8 mm diameter, 2 mm long, Small Parts, Inc., Miami Lakes, FL) were secured in the skull bone, and metal head post was mounted anterior to Bregma. The chamber, head post and skull screws were secured into place with dental acrylic, as described earlier. Mice were injected subcutaneously with 5 mg kg−1 analgesic Torbugestic (Fort Doege, USA) to alleviate pain and 0.5 ml of lactated ringer solution as a fluid supplement twice within the first 24 h of the surgery.
Electrophysiological recordings and respiration monitoring in awake mice
Mice were allowed a 3–4-day recovery period after surgical mounting of a head post and recording chamber before being adapted to the head-restrained experimental situation during two sessions of head fixation of 15 min duration performed on the same day at 0900 and 1500 hours. During these sessions, the head was held fixed and the body was covered with a loose fitting plastic half-tube (5 cm diameter, 10 cm long) to limit movements. Mice typically adapted to the head fixation within 2–3 sessions as judged by markedly reduced walking and running movements during the third session compared with the first or second. The experimental setup, head-holding device and recording procedures have been described in detail in a technical publication34. In short, head fixation involved clamping the metal head post mounted on the mouse’s skull to a metal fixation device, using a machine screw. Triple antibiotic paste was then removed from the recording chamber, and the chamber was rinsed and filled with sterile saline solution.
Before each experiment, mice were allowed to accommodate to the head fixation situation for 30 min before recordings.
For extracellular recordings, the guiding tubes of a computer-controlled microdrive (MiniMatrix, Thomas Recording, Germany) were lowered into the saline-filled recording chamber to a distance of less than 2 mm from the dural surface of the brain. The stainless steel guiding tubes also serve as reference electrodes and are eclectically connected to the brain tissue via the saline solution. Then, 2–5 electrodes (glass insulated tungsten/platinum, impedance: 3.5–5.0 MΩ) were slowly advanced through the intact dura into the whisker barrel cortex. Electrode movements were controlled with micrometre resolution and digitally monitored. Local field potentials and spike signals were separated by bandpass filtering at 0.1 to 200 Hz and at 200 Hz to 8 kHz, respectively, using a hardware filter amplifier (FA32; Multi Channel Systems). Filtered and amplified voltage signals were digitized and stored on a computer hard disk (16 bit A/D converter; sampling rate, >20 kHz for action potentials, >1 kHz for LFPs) using a CED power1401 and Spike2 software (both Cambridge Electronic Design).
Respiratory behaviour was monitored based on temperature changes associated with the expiration of warm air. A thermistor (Measurement Specialties, Boston, MA, USA) was placed in front of one nostril (or descending trachea in some tracheotomy experiments), and breathing cycles could reliably be measured as temperature increased and decreased during exhale and inhale movements, respectively. Increased temperature is represented as positive deflections of the thermistor voltage signal, which thus correspond to exhale movements (Figs 1, 2). The raw thermistor voltage signal was digitized at 1 kHz and stored together with the electrophysiological signals.
On completion of each recording session, the Ringer’s solution was removed, the recording chamber filled with triple antibiotic and the mice were returned to their home cages. Each animal typically participated in experiments for 1–2 weeks.
Tracheotomy and nasal airflow control
To further investigate the question whether neuronal activity was locked to respiration as a motor act or to nasal airflow and hence olfactory bulb activation, we opened the trachea in anaesthetized mice to separate respiration from nasal airflow. While the mouse could breathe spontaneously through the descending trachea, we were able to independently modulate nasal airflow by moving air through the ascending trachea.
For the performance of a tracheotomy before electrophysiological recordings, mice (n=3) were anaesthetized with Avertin (400 mg kg−1). After completion of the tracheotomy, anaesthesia was continued with 1–2% Isoflurane in oxygen inhaled through the opening of the descending trachea. Spontaneous respiration was monitored using a piezo film touching the chest wall. The ascending trachea was connected to a Picospritzer III (Parker Hannifin Corp., Cleveland, OH, USA) to modulate nasal airflow by passing air (mimicking a ~0.15 ml tidal volume) into the trachea. Nasal airflow was modulated rhythmically to be half, the same and double the spontaneous respiration frequency (1.6 Hz). Nasal airflow was modulated at 0.8, 1.6 or 3.2 Hz and was monitored using a thermistor placed in front of the nostril as described in detail below.
Electrical stimulation of olfactory bulb
To investigate whether local field potential activity in the whisker barrel cortex could be modulated by electrical stimulation of the olfactory bulb in the absence of nasal airflow, we performed experiments in anaesthetized, tracheomotized mice (n=3). A tracheotomy was performed under Avertin anaesthesia to eliminate nasal airflow and thus respiration-related bulbar activity. Anaesthesia was then continued using Isoflurane inhaled through the pulmonary trachea. Mice were mounted in a stereotaxic frame, and the skull was opened above the right whisker barrel cortex and olfactory bulb. Recording electrodes were inserted into the whisker barrel cortex. A concentric bipolar stimulation electrode was lowered onto the intact dura of the olfactory bulb. We electrically stimulated the bulb with rhythmic stimulation patterns consisting of 50 Hz trains of stimuli with inter-train intervals of 1.25, 0.62 and 0.28 s, corresponding to stimulation rhythms of 0.8, 1.6 and 3.2 Hz, respectively. Stimulus trains consisted of 10-ms current steps using 50 or 80 μA stimulus currents. We kept the train frequency and step duration constant while changing the number of pulses to generate different stimulation frequencies. The stimulus trains had 30, 15 and 8 current steps for 0.8, 1.6 and 3.2 Hz stimulation rhythms, respectively.
Creation of hypoxic conditions
We increased the frequency of respiratory activity by exposing the mice for 1 min to hypoxic (~10% oxygen) air while continuously recording the local field potentials. To this end, a custom-designed plastic cover was placed over the mouse leaving access to the recording chamber and head post through an opening at the top. Respiratory behaviour was monitored with a thermistor as described above. The composition of the air in the chamber was controlled by mixing atmospheric air with nitrogen at a ratio of 1/0 for normoxic and 1/2 for hypoxic conditions. Gas flowed into the chamber at a rate of 1 l min−1. An O2 analyser (GB-300, Teledyne Anal. Instr., City of Industry, CA, USA) continuously monitored the O2 concentration in the chamber. Following at least 5 min of stable LFP recording, mice were exposed to hypoxic air (10% O2) for 1 min, followed by normoxic air. Respiratory frequency, blood O2 saturation and heart rate were measured using a MouseOx (Starr Life Sci.Corp. Pittsburgh, USA) and recorded together with electrophysiological data before, during and after exposure to hypoxic air.
Analysis of local field potentials
LFP data were collected in awake, head-fixed conditions from five intact and six olfactory bulbectomized mice. Primary analysis involved identification of the correlation of the LFP activity to the respiratory activity and the frequency of the resting respiratory rhythm. Periods of stable resting respiratory rhythm (<5 Hz) were selected for further analysis. Coherence analysis focused on the resting respiratory frequency range (1–3 Hz) only, excluding higher respiratory rates associated with the brief episodes of sniffing.
Cross-correlations were calculated for each pair of simultaneously recorded respiratory and LFP signals, as well as the autocorrelation of each of the signals (Fig. 1). The respiratory frequency was identified as the peak frequency of the power spectrum calculated from the respiratory signal after a bandpass filtering between 0.5 and 10 Hz (the 4th order Butterworth filter).
Phase locking between the respiratory rhythm or nasal airflow and the LFP oscillations was assessed by computing the coherence between the two signals. The coherency spectrum was estimated in the following manner: 50-s segments of resting respiration and LFP signals served for the estimation of respiration-LFP coherence. Each of these segments were further segmented in 19 subsegments of 5 s duration with 2.5 s overlap. For each of those subsegments, we calculated the autospectrum separately of each signals and the cross-spectra of the respiration-LFP signals. The auto- and cross-spectra were averaged over the 50-s segment, and the average cross-spectrum was normalized by the square roots of the average auto-spectra of the respiration and LFP signals. To compare the degrees of the respiration-LFP coherence in normal and bulbectomized mice, we took from each coherency spectrum the coherence value at the corresponding respiration frequency and tested for the significance of the difference in the coherence values for the two groups with the Mann–Whitney U-test. When we performed the coherence analysis in a time-resolved manner, we sampled consecutive 10-s segments of 9-s overlaps (that is, shifts in steps of 1 s) and applied the above-mentioned coherence spectrum estimation to each of the 10-s segments with 1-s subsegments of 0.5-s overlaps.
To study cross-frequency phase–amplitude coupling of the LFP activity, we extracted from the LFP recordings the oscillatory phase  and amplitude
  at time t and at two different frequencies, respectively, that is, phase frequency fp and amplitude frequency fa. For this extraction, we used the wavelet transform with a Morlet wavelet defined at time t and frequency f as
  . The parameter σ was set to 10/(6f) so that the wavelet contains about 10 cycles of oscillations. The obtained amplitude was divided by its mean so that the absolute amplitude value, which depends on the frequency, does not affect the results of the forthcoming phase–amplitude coupling analysis.
The degree of the phase–amplitude coupling between the frequencies fa and fp was measured with the mean vector length 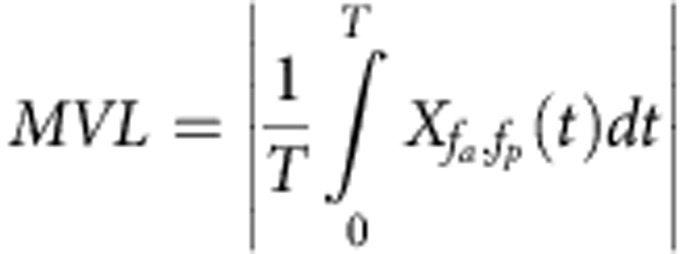 (Equation (1)), where T is the duration of the signal and Xfa,fp is the composite signal defined as
  (Equation (2)). The phase frequency fp was fixed to the breathing frequency, estimated as the peak frequency of the power spectrum of the respiratory signal. The amplitude frequency fa was varied in a range of frequencies between 1 and 256 Hz, sampled evenly on a logarithmic scale. To test the significance of the mean vector length, 1,000 phase-randomized surrogates were generated from the original signal by applying random phase shift to every Fourier coefficient of the original signal in the frequency domain and then inverse-Fourier transforming the randomized signal back into the time domain. The mean vector length was computed for each of them in exactly the same manner as for the original signal. The original mean vector length was considered to be significantly high if it exceeded the 95 percentile of the surrogate mean vector lengths.
The mean vector length was computed for 50-s segments of the recordings sampled from artefact-free periods. For each of the normal mice, 2–3 samples of such artefact-free segments were obtained. For each of the bulbectomized mice, one segment of 50-s was taken.
Analysis of spiking activity
In two awake, head-fixed mice, we recorded spiking activity in the whisker barrel cortices while also monitoring respiratory behaviour. Spiking activity was recorded at a total of 12 sites, six in each mouse. Spike events were extracted using a fixed threshold. If the signal to noise ratio of a spike signal was larger than four and the inter-spike intervals had a gamma distribution with a refractory period >5 ms we regarded it as a single unit (n=3). All other spike trains were regarded as multi-unit signals (n=9). The spike trains were convolved with a Gaussian of unit area and σ=2.5 ms, and the resulting function was correlated with the respiratory signal (that is, the thermistor voltage output). To determine the significance of spike-respiration correlations, we generated surrogate correlations by randomly shifting the spike train in time relative to the respiratory times. The spike train could be shifted in time by any random value between 0 s and the full duration of the recording. All spike times were shifted by the same value, preserving the spike interval sequence. The process was repeated 100 times, each time calculating the correlation of the shifted spike trains and saving the correlation values. From these 100 surrogate correlations, we calculated the median and the 5th and 95th percentile of the distributions of correlation coefficients at each lag time. Correlations were considered significant if the raw correlation coefficient values exceeded the 5th or 95th percentile of the surrogate distributions (Fig. 2).
Tracing studies
Five mice were anaesthetized (i.p. injection) with Ketamine/Xylazine (100/10 ml kg−1) and positioned in a stereotaxic frame (Stoelting, Wood Dale, IL, USA). The scalp was opened with a midline incision, and the skull was levelled between bregma and lambda by adjusting the bite bar. Body temperature was maintained at 35 °C using a heating pad. A glass micropipette filled with 5% Fluorogold (FG; Fluorochrome, LLC, Denver, CO, USA) was lowered into barrel cortex (anteroposterior=−1.0 mm, mediolateral=3.8 mm, dorsoventral=−0.3 mm), and the tracer was injected via iontophoresis (Precision Current Source, Stoelting Co., Wood Dale, IL, USA), at 2 μA (cycle 8 s ON and 8 s OFF), for a total of 20 min. The injection pipette was left in place for 10 min before and after the injection. Supplemental anaesthetic was administered as necessary throughout the surgery to maintain the animals under deep anaesthesia.
After a 5-day survival period, mice were perfused transcardially with phosphate-buffered saline and 4% paraformaldehyde. The brains were removed and placed in 4% paraformaldehyde for 1 day and then transferred to a 30% buffered sucrose solution and stored at 4 °C for at least 1 week. Coronal sections (40 μm, every other section) were cut serially using a freezing microtome. FG can be visualized using fluorescent microscopy, so no further histological processing was necessary. Sections were rinsed, mounted, air-dried and coverslipped on saline-coated slides with DPX mounting media for histology. All material were visualized and imaged using a Leica (DMRXA2, Leica Microsystems, Bannockburn, IL, USA) episcopic-fluorescence microscope equipped with a digital camera (Hamamatsu ORCA-ER, Hamamatsu , Shizuoka, Japan) and imaging software (SimplePCI, Hamamatsu, Shizuoka, Japan) (Fig. 7).
Figure 7. Retrograde tracing of barrel cortical afferents.
Representative images showing retrograde labelling in the forebrain following injection of a retrograde tracer (Fluorogold) into barrel cortex. (a) Injection site in S1BF (barrel cortex). (b) Retrogradely labelled cells were not found in the piriform cortex (PC). Retrogradely labelled neurons are found primarily in layers 2,3 and 5 in the contralateral barrel cortex (c), ipsilateral ventral posteromedial (VPM) thalamus (d), adjacent ipsilateral S2 (somatosensory) cortex (e). There is also sparse labelling of neurons ipsilaterally in basal forebrain (BF) nuclei (f). IC, internal capsule; LH, lateral hypothalamus; VPL, ventral posterolateral thalamus; VL, ventral lateral thalamus. Scale bars, (a), 400 μm. (b–f), 100 μm. Images a–c and d–f are from different mice.
Disclaimer
The content of this publication is solely the responsibility of the authors and does not necessarily represent the official views of the NIH.
Author contributions
D.H.H. conceived the original idea. D.H.H., S.R., Y.L., Y.C. and M.F. designed the experiment. S.R., Y.L. and Y.C. performed the experiments. D.H.H. participated in part of the experiments. L.L and J.B. designed and performed the tracing study. J.I. performed the majority of data analysis, S.G. advised the data analysis. D.H.H. contributed to data analysis. D.H.H., J.I. and S.G. wrote the paper. S.R., Y.L., J.B. and Y.C. contributed to the writing.
Additional information
How to cite this article: Ito, J. et al. Whisker barrel cortex delta oscillations and gamma power in the awake mouse are linked to respiration. Nat. Commun. 5:3572 doi: 10.1038/ncomms4572 (2014).
Acknowledgments
We thank Shuhua Qi for techncal assistance and Michael Nguyen for custom-machined parts. We also thank S. du Lac, D. Linden, M. Ennis and H. Kita for valuable suggestions and comments on earlier versions on this manuscript. This work was supported by grants NS060887, NS067201 from the National Institute of Health to D.H.H. and by the Helmholtz Alliance on Systems Biology, and Helmholtz Portfolio Supercomputing and Modeling for the Human Brain (SMHB) and BrainScales (EU Grant 269912) to S.G. Additional intramural support to D.H.H. was obtained from the UTHSC College of Medicine.
References
- Buzsaki G. Rhythms of the Brain Oxford University Press (2006). [Google Scholar]
- Buzsaki G. & Draguhn A. Neuronal oscillations in cortical networks. Science 304, 1926–1929 (2004). [DOI] [PubMed] [Google Scholar]
- Buzsaki G. & Wang X. J. Mechanisms of gamma oscillations. Annu. Rev. Neurosci. 35, 203–225 (2012). [DOI] [PMC free article] [PubMed] [Google Scholar]
- Amzica F. & Steriade M. Electrophysiological correlates of sleep delta waves. Electroencephalogr. Clin. Neurophysiol. 107, 69–83 (1998). [DOI] [PubMed] [Google Scholar]
- Timofeev I. & Chauvette S. Thalamocortical oscillations: local control of EEG slow waves. Curr. Top. Med. Chem. 11, 2457–2471 (2011). [DOI] [PubMed] [Google Scholar]
- Ros H., Sachdev R. N., Yu Y., Sestan N. & McCormick D. A. Neocortical networks entrain neuronal circuits in cerebellar cortex. J. Neurosci. 29, 10309–10320 (2009). [DOI] [PMC free article] [PubMed] [Google Scholar]
- Petersen C. C., Hahn T. T., Mehta M., Grinvald A. & Sakmann B. Interaction of sensory responses with spontaneous depolarization in layer 2/3 barrel cortex. Proc. Natl Acad. Sci. USA 100, 13638–13643 (2003). [DOI] [PMC free article] [PubMed] [Google Scholar]
- Poulet J. F. & Petersen C. C. Internal brain state regulates membrane potential synchrony in barrel cortex of behaving mice. Nature 454, 881–885 (2008). [DOI] [PubMed] [Google Scholar]
- Cao Y., Roy S., Sachdev R. N. & Heck D. H. Dynamic correlation between whisking and breathing rhythms in mice. J. Neurosci. 32, 1653–1659 (2012). [DOI] [PMC free article] [PubMed] [Google Scholar]
- Moore J. D. et al. Hierarchy of orofacial rhythms revealed through whisking and breathing. Nature 497, 205–210 (2013). [DOI] [PMC free article] [PubMed] [Google Scholar]
- Deschenes M., Moore J. & Kleinfeld D. Sniffing and whisking in rodents. Curr. Opin. Neurobiol. 22, 243–250 (2012). [DOI] [PMC free article] [PubMed] [Google Scholar]
- Ward L. M. Synchronous neural oscillations and cognitive processes. Trends Cogn. Sci. 7, 553–559 (2003). [DOI] [PubMed] [Google Scholar]
- Fries P. A mechanism for cognitive dynamics: neuronal communication through neuronal coherence. Trends Cogn. Sci. 9, 474–480 (2005). [DOI] [PubMed] [Google Scholar]
- Canolty R. T. & Knight R. T. The functional role of cross-frequency coupling. Trends Cogn. Sci. 14, 506–515 (2010). [DOI] [PMC free article] [PubMed] [Google Scholar]
- Ito J., Maldonado P. & Grun S. Cross-frequency interaction of the eye-movement related LFP signals in V1 of freely viewing monkeys. Front Syst. Neurosci. 7, 1 (2013). [DOI] [PMC free article] [PubMed] [Google Scholar]
- Adrian E. D. The role of air movement in olfactory stimulation. J. Physiol. 114, 4–5p (1951). [PubMed] [Google Scholar]
- Phillips M. E., Sachdev R. N., Willhite D. C. & Shepherd G. M. Respiration drives network activity and modulates synaptic and circuit processing of lateral inhibition in the olfactory bulb. J. Neurosci. 32, 85–98 (2012). [DOI] [PMC free article] [PubMed] [Google Scholar]
- Fontanini A. & Bower J. M. Variable coupling between olfactory system activity and respiration in ketamine/xylazine anesthetized rats. J. Neurophysiol. 93, 3573–3581 (2005). [DOI] [PubMed] [Google Scholar]
- Fontanini A., Spano P. & Bower J. M. Ketamine-xylazine-induced slow (<1.5Hz) oscillations in the rat piriform (olfactory) cortex are functionally correlated with respiration. J. Neurosci. 23, 7993–8001 (2003). [DOI] [PMC free article] [PubMed] [Google Scholar]
- Han F., Subramanian S., Price E. R., Nadeau J. & Strohl K. P. Periodic breathing in the mouse. J. Appl. Physiol. 92, 1133–1140 (2002). [DOI] [PubMed] [Google Scholar]
- Sun H., Luhmann H. J. & Kilb W. Resonance properties of different neuronal populations in the immature mouse neocortex. Eur. J. Neurosci. 36, 2753–2762 (2012). [DOI] [PubMed] [Google Scholar]
- Canolty R. T., Cadieu C. F., Koepsell K., Knight R. T. & Carmena J. M. Multivariate phase-amplitude cross-frequency coupling in neurophysiological signals. IEEE Trans. Biomed. Eng. 59, 8–11 (2012). [DOI] [PMC free article] [PubMed] [Google Scholar]
- Canolty R. T. et al. Oscillatory phase coupling coordinates anatomically dispersed functional cell assemblies. Proc. Natl Acad. Sci. USA 107, 17356–17361 (2010). [DOI] [PMC free article] [PubMed] [Google Scholar]
- Masaoka Y., Satoh H., Akai L. & Homma I. Expiration: the moment we experience retronasal olfaction in flavor. Neurosci. Lett. 473, 92–96 (2010). [DOI] [PubMed] [Google Scholar]
- Masaoka Y., Yoshimura N., Inoue M., Kawamura M. & Homma I. Impairment of odor recognition in Parkinson’s disease caused by weak activations of the orbitofrontal cortex. Neurosci. Lett. 412, 45–50 (2007). [DOI] [PubMed] [Google Scholar]
- Brown C. E. & Dyck R. H. Retrograde tracing of the subset of afferent connections in mouse barrel cortex provided by zincergic neurons. J. Comp. Neurol. 486, 48–60 (2005). [DOI] [PubMed] [Google Scholar]
- Adrian E. D. The electrical activity of the mammalian olfactory bulb. Electroencephalogr. Clin. Neurophysiol. 2, 377–388 (1950). [DOI] [PubMed] [Google Scholar]
- Grosmaitre X., Santarelli L. C., Tan J., Luo M. & Ma M. Dual functions of mammalian olfactory sensory neurons as odor detectors and mechanical sensors. Nat. Neurosci. 10, 348–354 (2007). [DOI] [PMC free article] [PubMed] [Google Scholar]
- Welker W. I. Analysis of sniffing of the albino rat. Behaviour 22, 223–243 (1964). [Google Scholar]
- Ni H. et al. Upregulation of barrel GABAergic neurons is associated with cross-modal plasticity in olfactory deficit. PLoS One 5, e13736 (2010). [DOI] [PMC free article] [PubMed] [Google Scholar]
- Ye B. et al. The functional upregulation of piriform cortex is associated with cross-modal plasticity in loss of whisker tactile inputs. PLoS One 7, e41986 (2012). [DOI] [PMC free article] [PubMed] [Google Scholar]
- Hamada Y., Miyashita E. & Tanaka H. Gamma-band oscillations in the ‘barrel cortex’ precede rat’s exploratory whisking. Neuroscience 88, 667–671 (1999). [DOI] [PubMed] [Google Scholar]
- Jones M. S. & Barth D. S. Sensory-evoked high-frequency (gamma-band) oscillating potentials in somatosensory cortex of the unanesthetized rat. Brain Res. 768, 167–176 (1997). [DOI] [PubMed] [Google Scholar]
- Bryant J. L., Roy S. & Heck D. H. A technique for stereotaxic recordings of neuronal activity in awake, head-restrained mice. J. Neurosci. Methods 178, 75 (2009). [DOI] [PMC free article] [PubMed] [Google Scholar]
- Hayar A., Bryant J. L., Boughter J. D. & Heck D. H. A low-cost solution to measure mouse licking in an electrophysiological setup with a standard analog-to-digital converter. J. Neurosci. Methods 2, 203–207 (2006). [DOI] [PMC free article] [PubMed] [Google Scholar]


