

Abstract
Multivariate pattern analysis (MVPA) is an increasingly popular approach for characterizing the information present in neural activity as measured by fMRI. For neuroimaging researchers, the searchlight technique serves as the most intuitively appealing means of implementing MVPA with fMRI data. However, searchlight approaches carry with them a number of special concerns and limitations that can lead to serious interpretation errors in practice, such as misidentifying a cluster as informative, or failing to detect truly informative voxels. Here we describe how such distorted results can occur, using both schematic illustrations and examples from actual fMRI datasets. We recommend that confirmatory and sensitivity tests, such as the ones prescribed here, should be considered a necessary stage of searchlight analysis interpretation, and that their adoption will allow the full potential of searchlight analysis to be realized.
Keywords: functional magnetic resonance imaging (fMRI), Multivariate pattern analysis (MVPA), Searchlight analysis, Support vector machines (SVM), Information mapping, Classification
Introduction
Multivariate pattern analysis (MVPA) of functional MRI (fMRI) data has grown steadily since its beginnings in 2001(Haxby, 2012). Following Raizada and Kriegeskorte (2010), we illustrate the growth of the literature by showing the citation rate for several key MVPA papers in Figure 1. Interest in MVPA spans disciplines. Advances have arisen from synergistic interactions with the machine learning community, which has developed new methods for addressing fMRI datasets and questions, as seen in the proliferation of relevant articles (e.g. Cuingnet et al., 2011; Mitchell et al., 2004; Van De Ville and Lee, 2012) and dedicated conference workshops (e.g. the International Conference on Pattern Recognition, NIPS, Cosyne, etc.). Interest in the cognitive neuroscience applications of MVPA is just as great (e.g. Heinzle et al., 2012; Tong and Pratte, 2012; Yang et al., 2012). The growing popularity of MVPA within neuroimaging has been driven by multiple factors, including: a) suggestions that it provides greater sensitivity and specificity than mass-univariate analyses with generally complementary results (Haynes and Rees, 2005; Jimura and Poldrack, 2012; Kamitani and Tong, 2005); b) the possibility of designing tests to address hypotheses which cannot be addressed with mass-univariate methods (e.g. Knops et al., 2009; Quadflieg et al., 2011; Stokes et al., 2009); and c) the intuitive appeal of a method which incorporates the signal from multiple voxels at once.
Figure 1.

Pattern-information fMRI is still a rapidly growing field, particularly searchlight analysis (note the rapid increase in papers citing Kriegeskorte et al, 2006). This figure follows Figure 2 in Raizada and Kriegeskorte (2010), but uses the actual citation counts after 2008. The number of citations for each paper and year was obtained via Scopus (www.scopus.com) on 9 January 2013.
Searchlight analysis (also called information mapping) is an MVPA method introduced as a technique for identifying locally informative areas with greater power and flexibility than mass-univariate analyses (Kriegeskorte and Bandettini, 2007a; Kriegeskorte et al., 2006). Searchlight approaches are relatively unique, in that they were developed specifically for fMRI analysis, addressing both the common localization goal (many fMRI studies aim to identify small brain areas) and the spatial structure of the BOLD signal (adjacent voxels tend to have similar activation timecourses). Searchlight analysis produces maps by measuring the information in small spherical subsets (“searchlights”) centered on every voxel; the map value for each voxel thus derives from the information present in its searchlight, not the voxel individually. Note that the word “information” is not used here in its formal sense (as in the field of information theory), but rather following its conventional use in the MVPA application literature. Specifically, we use the word “information” to indicate that the activity in a group of voxels varies consistently with experimental condition: a highly informative voxel cluster can be used to identify experimental condition more accurately than a weakly informative one.
Appealing aspects of searchlight analysis include its whole-brain approach (i.e., a priori region specification is not needed), the ability to pool over subject-specific activation patterns, and its minimization of the extremes of the curse of dimensionality associated with whole-brain MVPA (the “curse” refers to computational difficulties which can occur when there are more voxels than examples, see (Clarke et al., 2008; Jain et al., 2000); it is minimized in searchlight analysis since relatively few voxels are typically included in each searchlight). Additionally, searchlight analysis produces a whole-brain results map that is superficially similar in appearance to the whole-brain significance maps produced by more familiar mass-univariate analyses (based on the general linear model); thus, searchlight analysis results are potentially easier to interpret.These appealing aspects, plus promising early results, have led to a rapid increase in the number of studies using searchlight analyses (note the rapid rise in citations for Kriegeskorte et al, 2006 in Figure 1, particularly in the last few years). Its acceptance as a standard approach is reflected in its inclusion in recent MVPA review and methodology articles (e.g. Bandettini, 2009; Mourao-Miranda et al., 2006; Raizada and Kriegeskorte, 2010; Tong and Pratte, 2012), as well as in the most prominent MVPA software packages (BrainVoyager QX 2.0, the Princeton MVPA Toolbox, PyMVPA).
Reflecting its potential and appeal, variations of the searchlight technique have been developed. In the spatial domain, it has been extended to circular subsets on cortical surfaces (Chen et al., 2011; Oosterhof et al., 2011; Oosterhof et al., 2010), rather than the original volumetric spheres. Efforts have also been made to extend the technique to incorporate the temporal domain (Fogelson et al., 2011; Rao et al., 2011). The first searchlight analyses used the Mahalanobis distance as the similarity measure for information mapping, but a widely adopted variation is to use machine learning algorithms, often support vector machines (SVMs), instead (Haynes et al., 2007; Kriegeskorte and Bandettini, 2007b). In these approaches, generalization accuracy of the classifier is used as a proxy for information content. Group analysis is usually performed by combining individual subject’s maps with a binomial or t-test at each voxel (with the null hypothesis that the group classification accuracy is at chance level), creating maps of voxels with significant searchlights. Here we primarily consider classification-based searchlight analysis, but much of the discussion applies regardless of the precise implementation.
Searchlight analysis is a powerful and attractive tool for understanding neuroimaging data. However, it has particular characteristics and limitations that can lead to serious interpretation errors in practice, and so we recommend that straightforward confirmatory and sensitivity tests (analogous to post-hoc tests after an ANOVA), such as the ones described here, be considered a standard part of the searchlight analysis procedure. In the following sections we describe two assumptions that often implicitly underlie the interpretation of searchlight analysis results. Unfortunately, as we illustrate, these assumptions do not always hold, and so may lead to distorted results. We then describe how confirmatory follow-up tests can be used to guard against particularly harmful distortions, using two hypotheses common in cognitive studies as illustrations. This manuscript is accompanied by Supplemental Information containing examples (with code) and technical details.
Assumption 1: Information is detected consistently
A fundamental aspect of fMRI is that information is not distributed uniformly across voxels but rather has a three-dimensional structure: some groups of voxels (e.g. those corresponding to a specific anatomical region) are more informative for a particular task than other groups of the same size. Additionally, neuroimaging data contains information at multiple spatial frequencies (Kriegeskorte et al., 2010; Op de Beeck, 2010). For example, consider a cued finger-tapping task. The finger area of the primary motor cortex will be highly informative at a very small spatial frequency while the premotor and somatosensory cortices may be equally informative, but at a larger spatial frequency. The difference can be imagined as the size of box required to enclose the minimum set of voxels capable of task classification: a larger box is necessary to enclose the pattern in premotor or somatosensory cortices than to enclose the pattern in the primary motor cortex.
The distribution of information is relevant for searchlight analysis because interpretation of any particular map depends on whether the information can be detected equally across spatial frequencies. In a simulation designed with equal power in all spatial frequency bands, Kriegeskorte et al. (2006) showed that detection did not require a close match between the size of the searchlight and the informative area: a 4 mm radius consistently performed well. When this finding holds, it simplifies searchlight analysis interpretation: the peak areas of the map are the most informative voxels. However, if information is not present and detected equally at all spatial frequencies, then searchlight analysis results will depend fairly strongly upon the searchlight size; moreover, no single searchlight radius will be universally optimal or sufficient.
Additionally, although the Mahalanobis distance may be consistently sensitive to information across spatial frequency bands (Kriegeskorte et al., 2006), this property does not hold for all information measures used with searchlight analysis, especially the linear SVM. Training a linear SVM algorithm results in a set of weights; its decision function is a weighted linear combination of the voxels (Norman et al., 2006). Two properties of the linear SVM are particularly relevant when used in searchlight analysis: (1) It is sometimes able to correctly classify when the searchlight contains a small minority of highly informative voxels (intermixed with a majority of uninformative voxels), and conversely, (2) It is sometimes able to correctly classify when the searchlight contains a large number of weakly informative voxels.
Highly-informative voxels can be detected even when very rare
Since, as described above, linear SVMs are relatively resistant to the curse of dimensionality (Jain et al., 2000), they can sometimes classify a dataset accurately even when only a tiny minority of the voxels are informative. The degree to which this occurs varies depending on dataset properties, but it happens often enough to be relevant in practice. For instance, Supplemental Example 4 shows that introducing just five informative voxels from an actual fMRI dataset into a group of two hundred random (uninformative) voxels is sufficient to shift the median accuracy of an SVM from chance to 0.6. For an extreme example, a dataset containing a single highly informative voxel and 200 random voxels is accurately classified in Supplemental Example 5. Searchlight analysis generally includes fewer than 200 voxels in each searchlight, increasing the likelihood that searchlights containing a single or only a few informative voxels will be detected (see the “Detection of rare informative voxels” section of the Supplemental Information for further discussion).
This behavior can cause distortions in a searchlight map. To illustrate, suppose that a cluster of five highly informative voxels (capable of significant classification whenever included in a searchlight) is surrounded by hundreds of truly uninformative voxels. Any searchlight overlapping the five-voxel cluster will be significant, even if the majority of its voxels are uninformative. As a result, some voxels in the results map will be categorized as significant, not because they themselves are informative, but because they are at the center of a searchlight that contains the informative voxels. Figure 2 (Supplemental Example 7) gives examples of this occurrence in an actual fMRI dataset (see Supplemental Example 6 as well): for instance, the voxel in the lower-left corner (at coordinates 1, 1) changes its mapped classification accuracy from “uninformative” to “informative” when the starred (actually informative) voxel is moved, despite there being no change the properties of the (lower-left) voxel itself.
Figure 2.
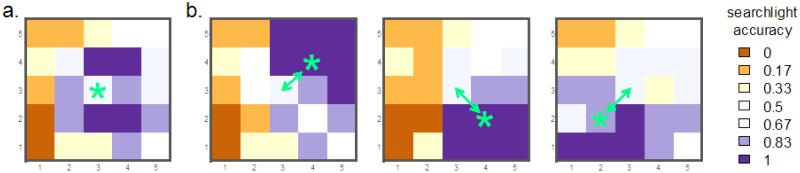
Influence of a single highly informative voxel on the searchlight map of a single subject from an fMRI dataset (complete version is Supplemental Example 7). a: Original searchlight accuracy map. The center voxel (starred) is highly informative individually. b: Searchlight maps after moving the highly informative voxel to the indicated locations. The most informative cluster of voxels in the searchlight accuracy map shifts to match the location of this voxel: this single informative voxel causes multiple voxels to be marked informative in the searchlight map.
A second issue is that the number of voxels marked as informative in a searchlight map will tend to grow as the searchlight radius increases, even when the size of the truly informative cluster stays fixed (Figure 3), so long as the curse of dimensionality does not dominate; classifiers will vary in how many uninformative voxels can be added to the fixed informative cluster before performance declines. This phenomenon, which has been termed the “needle-in-the-haystack-effect”, was demonstrated as a formal proof in Viswanathan et al. (2012). As an extreme example, Viswanathan et al. (2012) showed how all 147,000 voxels of a simulated volume would be classified as “informative” in a 3 voxel radius searchlight map when the volume contained just 430 evenly distributed informative voxels.
Figure 3.

Illustration of how the representation of a highly informative voxel (yellow square) increases in the information map of a single subject (right, green circle) with increasing searchlight radius (left, red circle). While the actual informative voxels are the same in a and b, the number of voxels marked informative in the map increases with the searchlight radius.
Weakly-informative voxels can be detected when sufficiently numerous
Another property of linear SVMs relevant for their use in searchlight analysis is that they can pool weak biases across many voxels, with the result that it is possible for a group of voxels to be classified accurately while the individual voxels making up the group do not yield significant classification, either singly or as subsets. This information “pooling” is often a useful characteristic for fMRI data, which is sometimes structured as weak information present in a large number of voxels. However, it can be troublesome for searchlight analysis interpretation. For example, suppose that there is a large cluster of voxels, each with the same small bias (i.e. a uniformly weakly informative voxel cluster). Ten voxels from this cluster (a small searchlight) may not yield significant classification, but thirty voxels (a larger searchlight) could produce a weakly significant classification, and fifty voxels, a highly significant classification (Figure 4 and Supplementary Example 1). This can be thought of as a case of discontinuous detection of information: at the extreme, a voxel cluster can change from “uninformative” to “informative” upon the addition of a single voxel (Supplementary Examples 2 and 3).
Figure 4.

Example of discontinuous information detection by a linear SVM, showing that accuracy increases from chance as the number of voxels increases; complete version is Supplemental Example 1. The simulated dataset has 500 voxels, all equally informative (constant bias), two classes, and four runs, with accuracies averaged over four leave-one-run-out cross-validation folds. Additional voxels are added to each successive subset, such that the two-voxel subset has voxels #1 and #2, the three-voxel subset has voxels #1, #2, and #3, etc. The inset shows the result of adding the first fifty voxels in greater detail. As the inset shows, at less than 20 voxels the SVM tends to suggest an absence of significant information (~50% classification accuracy); however, as the subsets increase past 20 voxels the classification accuracy rapidly increases in a discontinuous manner.
Discontinuous detection makes it possible for groups of weakly informative voxels to be partially or entirely missed when mapping information. Continuing the example, with a searchlight encompassing fewer than 30 voxels, the cluster will be classified as uninformative because no single searchlight can include enough voxels to enable accurate classification (Figure 5a). Larger searchlights could detect the cluster, but only when the shape of the searchlight matches the shape of the cluster: a spherical searchlight could miss an elliptical cluster (Figure 5b). An additional complication comes from assigning each searchlight’s accuracy to its center voxel : large, weakly informative clusters will appear smaller in the information map if the searchlight radius is less than the cluster diameter, since only searchlights fully overlapping the cluster will be significant (Figure 5c).
Figure 5.

Illustration of how informative voxels may be missed in a single-subject searchlight analysis when information is not detected with equal power in all spatial frequencies. The yellow areas represent informative voxels while the red circles represent the searchlight. Assume all cluster voxels are required for significant classification. a. The cluster will not be detected because the searchlight is too small. b. The cluster will be not detected because the searchlight shape does not match the cluster shape. c. The cluster appears smaller in the information map since only searchlights containing the entire cluster are significant.
Prior reports in the literature have documented the failure of weakly informative areas to be detected in searchlight analysis, mirroring our experience that widespread, weakly informative areas are common in fMRI datasets (see also Gonzalez-Castillo et al., 2012). For example, Eger, Michel et al. (2009) found that searchlight analysis (linear SVM, 3-voxel radius) identified no ROI voxels as informative, despite significant classification when using the whole ROI. Likewise, Diedrichsen, Wiestler et al. (2012) report needing to expand their searchlight size to achieve adequate sensitivity in one experimental condition (increasing from 80 to 160 voxels, with regularized linear discriminant analysis as the classification algorithm).
Assumption 2: Spatial variation between subjects is small compared to the searchlight radius
Most applications using searchlight analysis interpret results primarily based on group-level aggregation of single-subject information maps, even though strategies for constructing and interpreting these maps have not been fully explored. Methods for constructing group-level maps often parallel those used in mass-univariate analysis: a t-test (for average accuracy across individuals greater than chance) is conducted at every voxel independently, followed by multiple-comparisons correction (Kriegeskorte and Bandettini, 2007a). Alternatively, the individual maps are statistically thresholded and the group-level map is reported in terms of the proportion of subjects with a significant searchlight at each voxel (Pereira and Botvinick, 2011). Permutation-based tests have also been proposed (Kriegeskorte et al., 2006), with new techniques increasing their interpretability and computational tractability (Gaonkar and Davatzikos, 2012; Stelzer et al., 2013). Some authors perform the searchlight analysis in native space then normalize the individual maps to an atlas, while others normalize the images first and then perform the searchlight analysis in atlas space (both of which can introduce distortions). This proliferation of techniques reflects the importance placed on group information maps in cognitive neuroscience applications of MVPA, and also the lack of agreement regarding the best method for constructing them. All of these techniques rely on a common assumption, however: that spatial variation in the information maps between individuals is minimal compared to the searchlight radius. Group maps may be misleading if this does not hold.
Spatial variation between individuals is not a concern unique to searchlight analysis but a factor in all neuroimaging techniques. For example, smoothing is used during mass-univariate analysis to help reduce the impact of inter-individual variability. However, evaluating results when inter-individual variability is present is particularly complex in searchlight analysis because of distortions that can occur when constructing individual information maps, particularly distortions causing a mismatch between the actual informative voxels and their appearance in the searchlight map (such as those shown in Figure 3 and Figure 5). Since all methods of constructing a group information map involve combining some version of the individual maps, distortions in the individual maps are carried to the group level, where their effects may be magnified.
For example, spatial variation in the location of an informative cluster between individuals may cause the cluster to be missed in the group-level map. In Figure 6a, weakly informative clusters overlap in the individual maps, but since the individual searchlight mapping detects only a mi nority of the informative voxels (as in Figure 5c), the individual information maps do not overlap at the group level (Figure 6b green area), and so the cluster is missing from the group information map.
Figure 6.
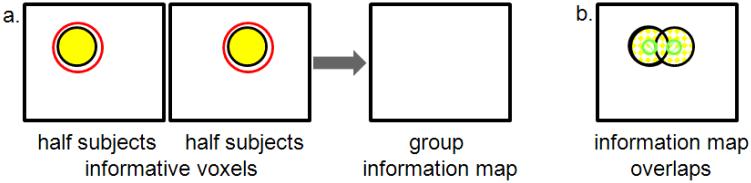
Illustration of spatial variability between subjects causing informative clusters to be missed at the group level. a. Half of the subjects have the cluster of informative voxels (yellow) on the left side of the ROI while the other half have the cluster on the right side; all cluster voxels are required for significant classification. The searchlight (red circle) is large enough to encompass the informative voxels, but neither appears significant in the group information map. b. Information maps for each subject group (green) do not overlap despite overlapping informative clusters (yellow).
At the opposite extreme, voxels that are uninformative in each individual when examined separately can be identified as being informative at the group level. To illustrate that this can occur, suppose half of the individuals have a cluster of highly informative voxels towards the left side of a ROI while the rest of the individuals have the same cluster of informative voxels, but shifted towards the right side (Figure 7a). The group-level information map will not identify the voxels corresponding to either cluster as informative but rather the voxels between the two clusters, because this is where the individual maps overlap (Figure 7b). While Figure 7 is a simple illustration contrived to show the problem, such an outcome can occur in many actual situations. Figure 8 (Supplemental Example 9) shows an occurrence in real fMRI data: The most informative voxel in the group information map (starred voxel at left) has the lowest average accuracy when the voxels are tested for classification in a univariate manner (i.e. as single voxels; Figure 8, right).
Figure 7.
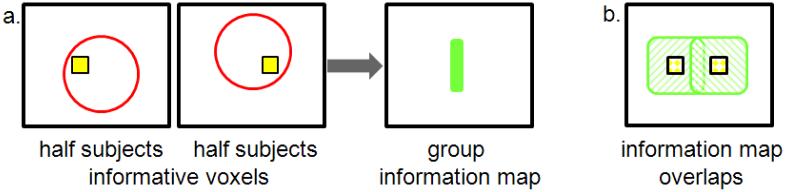
Illustration of how searchlight analysis (red circle) can produce a group information map misaligned to the informative clusters when spatial variability across subjects is present. a. Suppose half of the subjects have the cluster of informative voxels on the left side of the ROI (yellow) while the other half has the cluster on the right side of the ROI. The group map will locate the informative voxels between the two clusters (green), where no subjects had informative voxels. b. Information maps for each subject group, showing how the overlap of the subjects’ maps results in the distorted group map.
Figure 8.

Instance of group map distortions in fMRI data; complete version is Supplemental Example 9. The most informative voxel (starred) in the group information map (left) has the lowest mean accuracy, as determined by single-voxel classification (right). Maps for each of the six subjects making up the group are shown at the top of the figure.
Beyond the Searchlight: Some prescriptive guidelines for interpretation
In the previous sections we described how searchlight maps can be distorted at the single-subject level when information is not detected consistently (highly informative voxels can appear disproportionately large in the searchlight map while weakly informative voxels can be missed), and how, when these distortions are carried to the group level, their effects can be magnified by spatial variation between individuals. The severity of these distortions is intimately linked to both searchlight size (radius, shape) and classifier properties (such as how quickly accuracy is degraded by the presence of noise voxels and its sensitivity to the curse of dimensionality). As a consequence, it is critical that searchlight results be described in terms of possible dependence on searchlight size and classifier parameters, and checked for distortions before being interpreted as locating the most informative voxels.
As a general guideline, when only a single searchlight analysis is conducted, interpretation must be cautious, restricted to the parameters and choices used in the particular analysis. We do agree that a single-subject searchlight analysis indicates the amount of local information at each voxel, but only as measured by a particular classifier and given a searchlight of a particular size and shape. These caveats are necessary and relevant in practice. For example, in the demonstration dataset included in the Supplemental Information (actual fMRI data), in subject 12, voxel #13 was assigned an accuracy of 0.17 in the map made with a one-voxel radius searchlight, but an accuracy of 0.67 with a two-voxel radius searchlight (chance accuracy is 0.5). The same voxel exhibited the opposite pattern in a different individual (subject 19): informative in the one-voxel radius searchlight map, but uninformative in the two-voxel radius searchlight map (see Supplemental Figures 6 and 14). Thus, it is not meaningful to describe the informativeness of this voxel in these individuals without specifying a particular searchlight radius.
Precise descriptions are necessary to ensure that interpretation occurs within the correct context. For example, authors sometimes describe information maps in terms of informative brain regions, such as “searchlight analysis indicated that information about the effect of interest was present in the inferior frontal gyrus.” While convenient shorthand, such phrasing conflates spatial scales, implying that the region itself was shown to demonstrate the effect, when what was found was that significant voxels in the local information map were present within the region when using a particular searchlight. It is more precise to convey the results by emphasizing the scale and type of information found, such as “analysis with a 6 mm radius searchlight found local information related to the effect of interest, with significant searchlight centers located in the inferior frontal gyrus.”
Moving beyond interpreting searchlight maps in isolation enables more general conclusions to be drawn, inferences about information at scales other than that of a searchlight (such as “information about the effect of interest was present in the inferior frontal gyrus” and “the anterior portion of the prefrontal cortex was more informative than the posterior”). We suggest that conducting straightforward tests after a searchlight analysis (analogous to post-hoc tests after an ANOVA) can allow such inferences to be made with reasonable confidence. Two inferences particularly relevant in applications will be described: first, that a voxel cluster found in a group information map is itself informative, and, second, that a particular significant cluster contains the most informative voxels in the local anatomical region. This is not intended to be an exhaustive list of possible conclusions, but rather an illustration of the type of additional evidence that can be used to support interpretations drawn from searchlight analysis results, and why such evidence is necessary.
For convenience, in this section we will refer to the voxels identified as significant by the searchlight analysis as the “cluster.” In some applications the cluster could be composed of the searchlight centers only (as typical in searchlight mapping), while in others the cluster could include surrounding voxels (all voxels included in the identified searchlights). We refer to the anatomic region in which the cluster was found (and about which we want to infer), as the “area.”
Testing the interpretation that a cluster of searchlight-detected voxels is itself informative
A searchlight analysis gives the location of a cluster of informative searchlight centers, but additional tests are necessary to demonstrate that the voxels making up the cluster are themselves informative. The key issue is to infer across spatial scales: we wish to describe the cluster not only as the centers of informative searchlights of a particular radius (which is accurate without additional testing), but that the cluster voxels themselves (usually the searchlight centers) are informative. This claim requires additional evidence because it refers to the group of centers rather than the searchlights, which were the unit of analysis. In other words, we wish to change from making inferences about the searchlights to making inferences about the particular group of voxels we identified in the searchlight analysis. We propose that a general strategy for demonstrating that a cluster is informative is to explicitly create a region of interest (ROI) from the cluster and then characterize the properties of that ROI1. If the ROI made from the cluster is informative, then there is justification for concluding that the cluster is itself informative.
This analysis is deliberately circular: the ROI is tested using the same data as the original searchlight analysis. Despite the circularity, it is not guaranteed that the ROI will be informative. For example, the cluster in the group searchlight map in Figure 7 is composed entirely of uninformative voxels (see also Figure 8). Since the ROI may not be informative, even in a circular analysis (which should be the most favorable), the cluster should always be tested for information, as a ROI, before describing it in any sense other than that of the centers of searchlights. Stronger evidence for an informative cluster can be provided by a noncircular analysis (constructing the information map from different data than those used to test the resulting ROI).
While in many (perhaps most) cases the cluster will itself be informative in a circular analysis, the severity of the interpretation error in the exceptions, combined with the ease with which exceptions can be found (particularly in group analyses), leads us to recommend that clusters identified in a searchlight analysis always be directly checked for informativeness (as a ROI) before being described as informative themselves.
Conducting additional, complementary, analyses may allow confidence in the interpretation to be strengthened even further. The most appropriate analyses will vary with dataset and hypothesis, but sensitivity analyses are likely generally useful: how much does the cluster change when the analytical choices are varied (e.g. searchlight shape, classification algorithm)? Equivalently, how much does the information map change? For example, does the particular highly informative cluster have a similar appearance across a range of searchlight radii and shapes? If so, it is less likely to be a simple artifact. Nestor, Plaut et al. (2011) followed this strategy, providing group information maps at three different radii, which show that the t-values increase with increasing radius without greatly shifting the location of the highest values.
In the case of group analysis, sensitivity analyses can also evaluate whether the cluster depends on the inclusion of particular subjects. For example, group -level maps can be made after leaving out each subject individually (Supplemental Example 8); the cluster’s appearance should not rely on the inclusion of particular subjects. Similarly, providing individual subject information maps (e.g. Diedrichsen et al., 2012) is also useful, allowing the reader to evaluate the degree to which the group-level clusters are also found in the individuals. Sensitivity to statistical technique can also be important: a robust cluster should be similar over several methods of creating the group-level map (e.g. t-test, permutation test).
Testing the hypothesis that a cluster contains the area’s informative voxels
If it has been demonstrated that a particular cluster of voxels is itself informative (as a ROI), the researchers may wish to investigate whether those voxels are more informative than neighboring ones, that is, that the cluster encompasses the most informative voxels in a particular anatomical location. This type of claim is most relevant and tractable in cases where the cluster is in a specific anatomic region of interest. For example, searchlight analysis could identify a cluster in the left dorsolateral prefrontal cortex, and the researchers want to investigate whether it contains all the informative voxels in the left dorsolateral prefrontal cortex. This will of course not be proof that the most informative possible cluster was found, as that would require exhaustive testing of all possible configurations; conclusions will necessarily be restricted to a particular analysis protocol and dataset.
We propose that virtual lesion and feature perturbation techniques provide a framework for evaluating this type of claim: If the cluster contains the informative voxels, then the area should be less informative when the cluster voxels are removed. Such a test can begin by determining the accuracy of the entire area, including the cluster (i.e. a ROI-based analysis of the whole area). The area should be found informative, since the cluster known to be informative is present within it (although if the area is very large, or the classifier highly sensitive to noise, this test may fail, necessitating a different approach). Then the cluster should be removed and the classification of the area repeated (i.e. perform the ROI-based analysis after “lesioning” the cluster). In some cases it may be appropriate to “lesion” after dilating the cluster by the searchlight radius, to include all voxels participating in the targeted searchlights.
Strong evidence that the cluster contains the most informative voxels is provided if the area without the cluster contains little information, but the area with the cluster and the cluster alone contain similar amounts of information (Figure 9a). If the area is still informative after the cluster has been lesioned, it is improper to describe the cluster as the sole informative location, despite the appearance of the searchlight map. Instead, the information could be described in terms of the area as a whole (e.g. “weak information is widespread throughout the dorsolateral prefrontal cortex, with fine-scale information (as measured by a 8 mm-radius searchlight) found in a cluster centered at −38, 30, 30”), or additional analyses conducted to clarify the spatial distribution of informative voxels.
Figure 9.

Relationships between ROI accuracy and the statistical threshold applied to the searchlight map. a. Hypothetical information map resulting from a searchlight analysis (lighter shades indicate more accurate classification), with the area of interest outlined in green. Many voxels are considered part of the informative cluster at a lenient statistical threshold (left, marked by blue dots). Only the most significant voxels are included in the informative threshold at a stringent statistical threshold (right). b. Possible relationship when the above-threshold ROI contains the area’s informative voxels. The ROI’s accuracy increases as the statistical threshold becomes more stringent, since only the most informative voxels are retained in the cluster. The accuracy of the below-threshold ROI (i.e. the voxels not in the cluster) is near chance at lenient thresholds, but may increase at stringent thresholds if some moderately-informative voxels are no longer included in the above-threshold ROI. c. Schematic of an actual relationship observed in a circular analysis of an fMRI dataset, see Supplemental Example 10. The above-threshold ROI’s accuracy is slightly below that of the non-cluster voxels at the stringent statistical threshold, indicating that the voxels outside the cluster are approximately as informative as the cluster voxels.
Evaluating the accuracy of the cluster and area can be done at the either the individual or group level, as relevant to the particular interpretation being drawn. In the case of group analyses, the strongest evidence that a highly informative cluster had been detected would occur if the cluster is more informative than the rest of the area not only at the group level but also in a majority of the subjects individually.
This virtual lesion test is most stringent when the initial searchlight analysis and the follow-up cluster and area analyses are carried out in independent datasets (such as from different scanning days or groups of subjects). If the lesion analysis is performed using the same dataset as the searchlight mapping the analysis will be circular (Kriegeskorte et al., 2009), and so biased towards finding that the cluster is highly informative. However, even in a circular analysis it is not guaranteed that the cluster will contain most of the information in the area. In other words, removing (“lesioning”) the cluster identified in a searchlight analysis from an area does not always reduce the area’s accuracy to chance, and will not necessarily reduce the area’s accuracy at all.
For example, consider the small illustration summarized in Figure 9 and presented as Supplemental Example 10. The same fMRI dataset was used for the searchlight mapping and cluster-based analysis, so it is a circular analysis, biased towards supporting the claim that the area’s information is contained within the cluster. At the most lenient threshold (t > 0, 68% of the area’s voxels in the ROI made from the informative cluster) we find support for the claim that the most informative voxels in the area are in the cluster: the ROI classifies more accurately than the ROI made from the non-cluster voxels (which are near chance), and slightly more accurately than the area as a whole. But this does not hold when the thresholds increase in stringency: at a higher threshold (t > 1, 44% of the area’s voxels in the ROI) the cluster classifies marginally less accurately than both the non-cluster voxels and the area as a whole. Thus, at this threshold, the above-threshold voxel cluster, when treated as a ROI, does not classify more accurately than the less-significant voxels: the above-threshold voxels are only more informative in the context of the searchlight analysis.
In a more extensive analysis of this type (also circular) conducted in Etzel, Cole et al. (2012) a similar pattern was observed: a cluster identified as significant via searchlight analysis achieved an accuracy of 0.74 when tested as a ROI (p < 0.001), but when the cluster was removed the remaining (putatively non-informative voxels) in the area classified at 0.69 (p < 0.01) as a ROI, not a significant difference. The 0.05 reduction in accuracy after lesioning lends supports to the inference that the cluster is informative, but does not support the inference that the cluster encompasses all of the area’s informative voxels; many voxels outside the cluster must have also been informative for the area to classify significantly after lesioning.
Discussion
Searchlight analysis is a powerful tool for neuroimaging data analysis, but has characteristics that must be kept in mind for accurate interpretation, since it has the potential to produce distorted results, including misidentifying a cluster as informative or failing to detect truly informative voxels. We described why such errors are particularly troublesome when information detection is discontinuous, especially when weak information is distributed over a large number of voxels with spatial variability between subjects, as is common in high-level cognitive tasks.
We suggest that the natural role for searchlight analysis is to be part of an analysis protocol, not used in isolation. Searchlight analysis not accompanied by additional evidence supports inferences about the collections of searchlights analyzed, but not about the regions defined by clusters of voxels defined by searchlight centers. Clusters of significant searchlight centers are frequently described as defining a region of the brain that contains information, but that inference is not warranted based solely on the searchlight analysis.
As a concrete example, consider a hypothetical article (but representative of many currently published in NeuroImage and other journals) in which a searchlight analysis classifying a task was run at the individual level, after which a group-level results map was statistically generated. In the results section the authors write that they used “multivariate pattern analysis to determine the voxel clusters that contain significant information about the task” and present both “the resulting map of second-level analysis t-values” and a table listing the coordinates and sizes of four significant voxel clusters. The discussion and interpretation focuses on the anatomical regions in which the four clusters were found, beginning with an explanation that they “used MVPA to identify brain regions that predict participant task performance,” and followed by discussion of the potential task-related processing taking place in the regions.
We would consider the presented evidence insufficient to support the conclusions being drawn in the article, as it does not show that the brain regions predicted task performance, but rather that, at the group level, the centers of searchlights capable of such prediction fell inside those brain regions. While this may seem a fine distinction, it is a crucial one: it is possible that the voxels falling within the brain regions would not actually predict participant task performance if tested directly, outside of the searchlight analysis. Confirmatory analyses are necessary to demonstrate that the brain regions can indeed predict task performance. At minimum, a circular ROI-based analysis of each cluster would, if capable of classification, demonstrate that the cluster voxels themselves are informative. More convincingly, ROIs could be defined anatomically or in independent data (such as by holding each subject out of the searchlight analysis in turn, performing the ROI-based analysis on that subject using clusters defined on the other subjects). If the confirmatory tests fail, the conclusion that the regions predict participant task performance should not be made. We would recommend that an article making claims like this should not be accepted until confirmatory tests like the ones described above have been conducted.
While no set of confirmatory and sensitivity tests will be universally applicable, we propose that following a searchlight mapping with ROI-based analyses on detected voxels is straightforward and will identify the most serious distortions. Here we focused on issues that arise when linear SVMs are used with volumetric searchlights, as this combination is currently in wide use. Yet, similar issues stemming from discontinuous information detection are likely to apply to other linear classifiers as well; the detection characteristics of any metric should be explored before it is used in searchlight analysis. Nor are the issues unique to a particular searchlight shape; any technique (including surface-based) that assigns the searchlight’s accuracy to its center voxel is susceptible to map distortions (see (Björnsdotter et al., 2011; Tianhao and Davatzikos, 2011; Zhang et al., 2012) for possible alternatives).
Searchlight approaches are often thought to be the preferred MVPA technique when conducting group analyses, because they provides a degree of spatial abstraction by combining local information maps across individuals at the level of the searchlight, rather than of single voxels (Kriegeskorte and Bandettini, 2007a). However, any distortions that occur in the individual information maps can lead to misleading or incomplete group-level maps, particularly in cases when large variation is expected between subjects, and/or when information is diffusely distributed and weak, such as with high-level cognitive tasks. This problem is not unique to searchlight analysis, as spatial variation between individuals causes difficulties in nearly all fMRI techniques, including the mass-univariate GLM. While smoothing mitigates some of the effects of misalignment in mass-univariate analyses, the distortions in searchlight analysis are discontinuous, harder to predict and control, and so present a special challenge. One possible outcome is that searchlight analysis in individuals can detect highly informative clusters of voxels matching the searchlight size much more readily than mismatched or less informative clusters. Carried to the group level, only areas with consistently-located, highly informative clusters of that particular size will survive statistical thresholding, leading to an impression that the information is distributed much more focally than it is in actuality. This parallels the distortions that occur in univariate group analyses when there is low statistical power (Yarkoni, 2009), in the sense that many informative areas are missed, but those that are found appear (artifactually) to be extremely strong and focal. The greater sensitivity of searchlight analysis to focal information is compatible with the tendency in fMRI research to describe small brain areas with specific properties; the “localizationist view” (Gonzalez-Castillo et al., 2012). Expanding our search space beyond focal information, such as by using the strategies described in this paper, will provide a more complete picture of the brain activity that is measured by fMRI BOLD signals, hopefully leading to a more accurate and powerful understanding of brain function.
Supplementary Material
Highlights.
Searchlight analysis is a promising MVPA method widely used in fMRI research.
Violation of assumed properties potentially leads to misleading information maps.
Voxels significant in searchlight accuracy maps may not themselves be informative.
Critical follow-up analyses are prescribed to support and justify interpretations.
Acknowledgments
We thank Michael W. Cole for many fruitful discussions. This research was supported by NIH 3RO1MH66078-06A1W1 to Todd Braver and 1R01AG031150 to Jeffrey M. Zacks.
Footnotes
Publisher's Disclaimer: This is a PDF file of an unedited manuscript that has been accepted for publication. As a service to our customers we are providing this early version of the manuscript. The manuscript will undergo copyediting, typesetting, and review of the resulting proof before it is published in its final citable form. Please note that during the production process errors may be discovered which could affect the content, and all legal disclaimers that apply to the journal pertain.
For concreteness, suppose that the searchlight analysis used a linear SVM to distinguish two types of stimuli, and that each searchlight contained 50 voxels. A particular cluster of interest containing 100 voxels is found in the resulting information map. These 100 voxels could then be grouped together as a ROI, and evaluated with another linear SVM trained to distinguish the stimuli. Thus, the second analysis involves linear SVM on the single group of 100 voxels corresponding to the ROI, rather than 100 different 50-voxel searchlights.
References
- Bandettini PA. What's New in Neuroimaging Methods? Annals of the New York Academy of Sciences. 2009;1156:260–293. doi: 10.1111/j.1749-6632.2009.04420.x. [DOI] [PMC free article] [PubMed] [Google Scholar]
- Björnsdotter M, Rylander K, Wessberg J. A Monte Carlo method for locally multivariate brain mapping. Neuroimage. 2011;56:508–516. doi: 10.1016/j.neuroimage.2010.07.044. [DOI] [PubMed] [Google Scholar]
- Carlson TA, Schrater P, He S. Patterns of activity in the categorical representations of objects. Journal Of Cognitive Neuroscience. 2003;15:704–717. doi: 10.1162/089892903322307429. [DOI] [PubMed] [Google Scholar]
- Chen Y, Namburi P, Elliott LT, Heinzle J, Soon CS, Chee MWL, Haynes J-D. Cortical surface-based searchlight decoding. Neuroimage. 2011;56:582–592. doi: 10.1016/j.neuroimage.2010.07.035. [DOI] [PubMed] [Google Scholar]
- Clarke R, Ressom HW, Wang A, Xuan J, Liu MC, Gehan EA, Wang Y. The properties of high-dimensional data spaces: implications for exploring gene and protein expression data. Nature Reviews Cancer. 2008;8:37–49. doi: 10.1038/nrc2294. [DOI] [PMC free article] [PubMed] [Google Scholar]
- Cuingnet R, Rosso C, Chupin M, Lehéricy S, Dormont D, Benali H, Samson Y, Colliot O. Spatial regularization of SVM for the detection of diffusion alterations associated with stroke outcome. Medical Image Analysis. 2011;15:729–737. doi: 10.1016/j.media.2011.05.007. [DOI] [PubMed] [Google Scholar]
- Diedrichsen J, Wiestler T, Krakauer JW. Two Distinct Ipsilateral Cortical Representations for Individuated Finger Movements. Cerebral Cortex. 2012 doi: 10.1093/cercor/bhs120. in press. [DOI] [PMC free article] [PubMed] [Google Scholar]
- Eger E, Michel V, Thirion B, Amadon A, Dehaene S, Kleinschmidt A. Deciphering Cortical Number Coding from Human Brain Activity Patterns. Current Biology. 2009;19:1608–1615. doi: 10.1016/j.cub.2009.08.047. [DOI] [PubMed] [Google Scholar]
- Etzel JA, Cole MW, Braver TS. Looking Outside The Searchlight. Lecture Notes in Artificial Intelligence LNAI 7263 Surveys of the State of the Art Machine Learning and Interpretation in Neuroimaging. MLINI. 2012;2011:29–37. [Google Scholar]
- Fogelson SV, Kohler PJ, Hanke M, Halchenko YO, Haxby JV, Granger RH, Tse PU. STMVPA: Spatiotemporal multivariate pattern analysis permits fine-grained visual categorization. Journal of Vision. 2011;11:814. [Google Scholar]
- Gaonkar B, Davatzikos C. Deriving Statistical Significance Maps for SVM Based Image Classification and Group Comparisons. In: Ayache N, Delingette H, Golland P, Mori K, editors. Medical Image Computing and Computer-Assisted Intervention - MICCAI 2012. Springer Berlin Heidelberg; 2012. pp. 723–730. [DOI] [PMC free article] [PubMed] [Google Scholar]
- Gonzalez-Castillo J, Saad ZS, Handwerker DA, Inati SJ, Brenowitz N, Bandettini PA. Whole-brain, time-locked activation with simple tasks revealed using massive averaging and model-free analysis. Proceedings of the National Academy of Sciences. 2012 doi: 10.1073/pnas.1121049109. in press. [DOI] [PMC free article] [PubMed] [Google Scholar]
- Haxby JV. Multivariate pattern analysis of fMRI: The early beginnings. Neuroimage. 2012;62:852–855. doi: 10.1016/j.neuroimage.2012.03.016. [DOI] [PMC free article] [PubMed] [Google Scholar]
- Haxby JV, Gobbini MI, Furey ML, Ishai A, Schouten JL, Pietrini P. Distributed and Overlapping Representations of Faces and Objects in Ventral Temporal Cortex. Science. 2001;293:2425–2430. doi: 10.1126/science.1063736. [DOI] [PubMed] [Google Scholar]
- Haynes J-D, Rees G. Predicting the orientation of invisible stimuli from activity in human primary visual cortex. Nat Neurosci. 2005;8:686–691. doi: 10.1038/nn1445. [DOI] [PubMed] [Google Scholar]
- Haynes J-D, Sakai K, Rees G, Gilbert S, Frith C, Passingham RE. Reading Hidden Intentions in the Human Brain. Current Biology. 2007;17:323–328. doi: 10.1016/j.cub.2006.11.072. [DOI] [PubMed] [Google Scholar]
- Heinzle J, Anders S, Bode S, Bogler C, Chen Y, Cichy RM, Hackmack K, Kahnt T, Kalberlah C, Reverberi C, Soon CS, Tusche A, Weygandt M, Haynes J-D. Multivariate decoding of fMRI data: Towards a content-based cognitive neuroscience. e-Neuroforum. 2012;3:1–16. [Google Scholar]
- Jain AK, Duin RPW, Jianchang M. Statistical pattern recognition: a review. Pattern Analysis and Machine Intelligence. IEEE Transactions. 2000;22:4–37. [Google Scholar]
- Jimura K, Poldrack RA. Analyses of regional-average activation and multivoxel pattern information tell complementary stories. Neuropsychologia. 2012;50:544–552. doi: 10.1016/j.neuropsychologia.2011.11.007. [DOI] [PubMed] [Google Scholar]
- Kamitani Y, Tong F. Decoding the visual and subjective contents of the human brain. Nat Neurosci. 2005;8:679–685. doi: 10.1038/nn1444. [DOI] [PMC free article] [PubMed] [Google Scholar]
- Kamitani Y, Tong F. Decoding Seen and Attended Motion Directions from Activity in the Human Visual Cortex. Current Biology. 2006;16:1096–1102. doi: 10.1016/j.cub.2006.04.003. [DOI] [PMC free article] [PubMed] [Google Scholar]
- Kay KN, Naselaris T, Prenger RJ, Gallant JL. Identifying natural images from human brain activity. Nature. 2008;452:352–356. doi: 10.1038/nature06713. [DOI] [PMC free article] [PubMed] [Google Scholar]
- Knops A, Thirion B, Hubbard EM, Michel V, Dehaene S. Recruitment of an Area Involved in Eye Movements During Mental Arithmetic. Science. 2009;324:1583–1585. doi: 10.1126/science.1171599. [DOI] [PubMed] [Google Scholar]
- Kriegeskorte N, Bandettini P. Analyzing for information, not activation, to exploit high-resolution fMRI. Neuroimage. 2007a;38:649–662. doi: 10.1016/j.neuroimage.2007.02.022. [DOI] [PMC free article] [PubMed] [Google Scholar]
- Kriegeskorte N, Bandettini P. Combining the tools: Activation- and information-based fMRI analysis. Neuroimage. 2007b;38:666–668. doi: 10.1016/j.neuroimage.2007.06.030. [DOI] [PubMed] [Google Scholar]
- Kriegeskorte N, Cusack R, Bandettini P. How does an fMRI voxel sample the neuronal activity pattern: Compact-kernel or complex spatiotemporal filter? Neuroimage. 2010;49:1965–1976. doi: 10.1016/j.neuroimage.2009.09.059. [DOI] [PMC free article] [PubMed] [Google Scholar]
- Kriegeskorte N, Goebel R, Bandettini P. Information-based functional brain mapping. PNAS. 2006;103:3863–3868. doi: 10.1073/pnas.0600244103. [DOI] [PMC free article] [PubMed] [Google Scholar]
- Kriegeskorte N, Simmons WK, Bellgowan PSF, Baker CI. Circular analysis in systems neuroscience: the dangers of double dipping. Nature Neuroscience. 2009;12:535–540. doi: 10.1038/nn.2303. [DOI] [PMC free article] [PubMed] [Google Scholar]
- Mitchell TM, Hutchinson R, Niculescu RS, Pereira F, Wang X. Learning to Decode Cognitive States from Brain Images. Machine Learning. 2004;57:145–175. [Google Scholar]
- Mitchell TM, Shinkareva SV, Carlson A, Chang KM, Malave VL, Mason RA, Just MA. Predicting Human Brain Activity Associated with the Meanings of Nouns. Science. 2008;320:1191. doi: 10.1126/science.1152876. [DOI] [PubMed] [Google Scholar]
- Mourao-Miranda J, Reynaud E, McGlone F, Calvert G, Brammer M. The impact of temporal compression and space selection on SVM analysis of single-subject and multi-subject fMRI data. Neuroimage. 2006;33:1055–1065. doi: 10.1016/j.neuroimage.2006.08.016. [DOI] [PubMed] [Google Scholar]
- Nestor A, Plaut DC, Behrmann M. Unraveling the distributed neural code of facial identity through spatiotemporal pattern analysis. Proceedings of the National Academy of Sciences. 2011;108:9998–10003. doi: 10.1073/pnas.1102433108. [DOI] [PMC free article] [PubMed] [Google Scholar]
- Norman KA, Polyn SM, Detre GJ, Haxby JV. Beyond mind-reading: multi-voxel pattern analysis of fMRI data. Trends In Cognitive Sciences. 2006;10:424–430. doi: 10.1016/j.tics.2006.07.005. [DOI] [PubMed] [Google Scholar]
- Oosterhof NN, Wiestler T, Downing PE, Diedrichsen J. A comparison of volume-based and surface-based multi-voxel pattern analysis. Neuroimage. 2011;56:593–600. doi: 10.1016/j.neuroimage.2010.04.270. [DOI] [PubMed] [Google Scholar]
- Oosterhof NN, Wiggett AJ, Diedrichsen J, Tipper SP, Downing PE. Surface-Based Information Mapping Reveals Crossmodal Vision-Action Representations in Human Parietal and Occipitotemporal Cortex. Journal of Neurophysiology. 2010;104:1077–1089. doi: 10.1152/jn.00326.2010. [DOI] [PMC free article] [PubMed] [Google Scholar]
- Op de Beeck HP. Against hyperacuity in brain reading: Spatial smoothing does not hurt multivariate fMRI analyses? Neuroimage. 2010;49:1943–1948. doi: 10.1016/j.neuroimage.2009.02.047. [DOI] [PubMed] [Google Scholar]
- Pereira F, Botvinick M. Information mapping with pattern classifiers: A comparative study. Neuroimage. 2011;56:476–496. doi: 10.1016/j.neuroimage.2010.05.026. [DOI] [PMC free article] [PubMed] [Google Scholar]
- Quadflieg S, Etzel JA, Gazzola V, Keysers C, Schubert TW, Waiter GD, Macrae CN. Puddles, Parties, and Professors: Linking Word Categorization to Neural Patterns of Visuospatial Coding. Journal Of Cognitive Neuroscience. 2011;23:2636–2649. doi: 10.1162/jocn.2011.21628. [DOI] [PubMed] [Google Scholar]
- Raizada RDS, Kriegeskorte N. Pattern-information fMRI: New questions which it opens up and challenges which face it. Int. J. Imaging Syst. Technol. 2010;20:31–41. [Google Scholar]
- Rao AR, Garg R, Cecchi GA. A spatio-temporal support vector machine searchlight for fMRI analysis. Biomedical Imaging: From Nano to Macro. 2011 IEEE International Symposium. 2011:1023–1026. [Google Scholar]
- Stelzer J, Chen Y, Turner R. Statistical inference and multiple testing correction in classification-based multi-voxel pattern analysis (MVPA): Random permutations and cluster size control. Neuroimage. 2013;65:69–82. doi: 10.1016/j.neuroimage.2012.09.063. [DOI] [PubMed] [Google Scholar]
- Stokes M, Thompson R, Cusack R, Duncan J. Top-Down Activation of Shape-Specific Population Codes in Visual Cortex during Mental Imagery. J. Neurosci. 2009;29:1565–1572. doi: 10.1523/JNEUROSCI.4657-08.2009. [DOI] [PMC free article] [PubMed] [Google Scholar]
- Tianhao Z, Davatzikos C. ODVBA: Optimally-Discriminative Voxel-Based Analysis. Medical Imaging. IEEE Transactions. 2011;30:1441–1454. doi: 10.1109/TMI.2011.2114362. [DOI] [PMC free article] [PubMed] [Google Scholar]
- Tong F, Pratte MS. Decoding Patterns of Human Brain Activity. Annual Review of Psychology. 2012;63:483–509. doi: 10.1146/annurev-psych-120710-100412. [DOI] [PMC free article] [PubMed] [Google Scholar]
- Van De Ville D, Lee S-W. Brain decoding: Opportunities and challenges for pattern recognition. Pattern Recognition. 2012;45:2033–2034. [Google Scholar]
- Viswanathan S, Cieslak M, Grafton ST. On the geometric structure of fMRI searchlight-based information maps. 2012 arXiv:1210.6317 [q-bio.NC] [Google Scholar]
- Yang Z, Fang F, Weng X. Recent developments in multivariate pattern analysis for functional MRI. Neuroscience Bulletin. 2012;28:399–408. doi: 10.1007/s12264-012-1253-3. [DOI] [PMC free article] [PubMed] [Google Scholar]
- Yarkoni T. Big Correlations in Little Studies: Inflated fMRI Correlations Reflect Low Statistical Power: a Commentary on Vul et al. (2009) Perspectives on Psychological Science. 2009;4:294–298. doi: 10.1111/j.1745-6924.2009.01127.x. [DOI] [PubMed] [Google Scholar]
- Zhang T, Satterthwaite TD, Elliott M, Gur RC, Gur RE, Davatzikos C. Multivariate fMRI Analysis Using Optimally-discriminative Voxel-based Analysis. Pattern Recognition in NeuroImaging (PRNI). 2012 International Workshop; London. 2012. pp. 33–36. [DOI] [PMC free article] [PubMed] [Google Scholar]
Associated Data
This section collects any data citations, data availability statements, or supplementary materials included in this article.