
Figure 7.
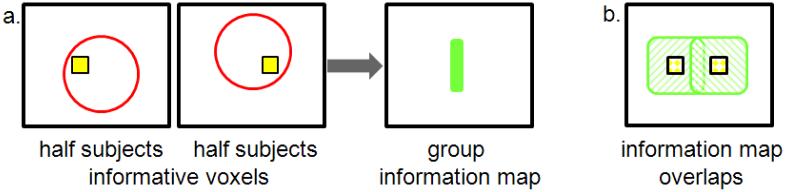
Illustration of how searchlight analysis (red circle) can produce a group information map misaligned to the informative clusters when spatial variability across subjects is present. a. Suppose half of the subjects have the cluster of informative voxels on the left side of the ROI (yellow) while the other half has the cluster on the right side of the ROI. The group map will locate the informative voxels between the two clusters (green), where no subjects had informative voxels. b. Information maps for each subject group, showing how the overlap of the subjects’ maps results in the distorted group map.