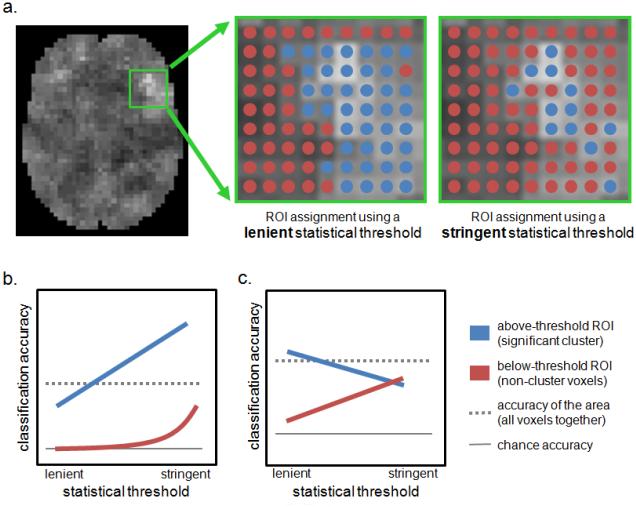
Figure 9.
Relationships between ROI accuracy and the statistical threshold applied to the searchlight map. a. Hypothetical information map resulting from a searchlight analysis (lighter shades indicate more accurate classification), with the area of interest outlined in green. Many voxels are considered part of the informative cluster at a lenient statistical threshold (left, marked by blue dots). Only the most significant voxels are included in the informative threshold at a stringent statistical threshold (right). b. Possible relationship when the above-threshold ROI contains the area’s informative voxels. The ROI’s accuracy increases as the statistical threshold becomes more stringent, since only the most informative voxels are retained in the cluster. The accuracy of the below-threshold ROI (i.e. the voxels not in the cluster) is near chance at lenient thresholds, but may increase at stringent thresholds if some moderately-informative voxels are no longer included in the above-threshold ROI. c. Schematic of an actual relationship observed in a circular analysis of an fMRI dataset, see Supplemental Example 10. The above-threshold ROI’s accuracy is slightly below that of the non-cluster voxels at the stringent statistical threshold, indicating that the voxels outside the cluster are approximately as informative as the cluster voxels.

