

Abstract
Experimental and epidemiological evidence suggest that dysregulation of proteins involved in iron metabolism plays a critical role in cancer. The mechanisms by which cancer cells alter homeostatic iron regulation are just beginning to be understood. Here we demonstrate that iron regulatory protein 2 (IRP2) plays a key role in iron accumulation in breast cancer. Although both IRP1 and IRP2 are over-expressed in breast cancer, the overexpression of IRP2, but not IRP1, is associated with decreased ferritin H and increased transferrin receptor 1 (TfR1). Knock-down of IRP2 in triple negative MDA-MB-231 human breast cancer cells increases ferritin H expression and decreases TfR1 expression, resulting in a decrease in the labile iron pool. Further, IRP2 knockdown reduces growth of MDA-MB-231 cells in the mouse mammary fat pad. Gene expression microarray profiles of breast cancer patients demonstrate that increased IRP2 expression is associated with high grade cancer. Increased IRP2 expression is observed in luminal A, luminal B and basal breast cancer subtypes, but not in breast tumors of the ERBB2 molecular subtype. These results suggest that dysregulation of IRP2 is an early nodal point underlying altered iron metabolism in breast cancer and may contribute to poor outcome of some breast cancer patients.
Keywords: breast cancer, iron, metabolism, iron regulatory proteins, molecular subtypes
Introduction
Iron is essential for normal cell growth and proliferation. A growing body of evidence suggests that iron dysregulation plays a role in the pathogenesis and progression of many common diseases, including cancer (1-3). The underlying mechanisms by which iron contributes to malignancy are incompletely understood, and include the production of reactive oxygen species (ROS); induction of oxidative-responsive transcription factors (AP-1, NFκB)(4, 5); stimulation of oncogenic pathways (6); and effects on DNA synthesis (7), DNA repair (8) and the cell cycle (9-11). Breast and other cancers are characterized by an increase in iron uptake and/or reduction in iron efflux, both of which favor iron sequestration (12). Iron deprivation has demonstrated inhibition of tumor growth and has been used to treat cancers in animal models and human clinical trials with some success (13-18).
There is a particularly close association between iron and breast cancer. Lifetime exposure to estrogen is a risk factor for breast cancer (19). Estrogen contributes to tumor formation in part by redox cycling, which promotes the formation of oxidized DNA bases(20). This DNA-damaging effect of estrogen is potentiated by iron (21, 22). In addition, estrogen and iron exert combined effects in stimulating proliferation of breast cancer cells in tissue culture (23), suggesting that iron may play both a tumor initiating and tumor promoting role in breast cancer. Recent studies using biopsy tissue demonstrate that breast cancer tissue has a higher level of iron than normal breast tissue (24).
Decreases in iron efflux and increases in iron influx both play a role in the increased accumulation of iron in malignant breast tissue (12, 25). Low levels of the Fe(II) export protein, ferroportin (SLC40A1), in breast cancers contributes to the breast cancer phenotype (12), and the combined expression of low ferroportin and high hepcidin (HAMP)(export dyad) predict poor outcome in breast cancer patients after definitive surgery. Breast cancers that express high transferrin receptor 1 and low HFE (the hemochromatosis gene, a negative regulator of TfR1[TFRC]), and are thus predicted to exhibit high iron uptake, are also associated with poor outcome (25).
What mechanisms underlie the altered expression of proteins that regulate iron import and efflux in breast cancer? Because iron regulatory proteins (IRPs), IRP1 (ACO1) and IRP2 (IREB2), play a central role in the regulation of intracellular iron metabolism (26), we examined the role of IRP1 and IRP2 in breast cancer. IRPs regulate iron by binding to IREs, iron responsive elements present in the untranslated region of mRNAs encoding iron-related proteins, such as ferritin H (FTH1)(27, 28), ferritin L (FTL)(29), transferrin receptor 1(TfR1)(30, 31), and ferroportin(32). The role of IREs in ferritin and TfR1 have been particularly well studied (26). When IRPs bind to the IRE in the 5′-UTR of ferritin, they inhibit translation. When IRPs bind to the IREs in the 3′-UTR of TfR1, they stabilize the mRNA. Because decreased ferritin decreases iron storage, whereas increased TfR1 increases iron uptake, enhanced binding of IRPs to IRE leads to increased metabolically available iron (the labile iron pool).
In this study, we report that IRP2 plays a predominant role in regulation of proteins of iron metabolism in breast cells and is overexpressed in breast cancer cells. Knockdown of IRP2 retards breast tumor growth in vivo. Further, high IRP2 expression is associated with high tumor grade and breast cancer molecular subtypes. These results demonstrate that IRP2 plays an important role in breast cancer by enhancing iron accumulation in tumor cells.
Materials and Methods
Chemicals and cell cultures
Human mammary epithelial cells (HME) cells were purchased from Lonza and used at less than passage 10. R5 cells were a kind gift from R. Weinberg (12, 33). R5 cells are tumor-forming variants of HME cells established by sequential transformation of HME cells with telomerase catalytic subunit, SV40 T antigen, and oncogenic H-ras. HME and R5 cells were maintained in the same medium (DMEM–F12 supplemented with l-glutamine, insulin, human epidermal growth factor, and hydrocortisone) for 24 hours before harvest. MCF10A and MCF7 cells were obtained from the Wake Forest University Comprehensive Cancer Center Tissue Culture Core facility. MDA-MB-231-Luc cells were obtained from Caliper and maintained in DMEM medium. T47D, MDA-MB-175, MDA-MB-361, and MDA-MB-453 breast cancer cell lines were obtained from the American Type Culture Collection (ATCC) and cultured according to ATCC guidelines. All cell lines were thawed from early-passage frozen stocks and were passaged less than 30 times prior to use. The cell lines were regularly examined for morphology and Mycoplasma contamination was checked by the Tissue Culture Core facility of the Wake Forest Comprehensive Cancer Center.
Cell proliferation assay
Cell proliferation was measured using a WST-1 assay kit following the manufacture's instruction (Roche Applied Science).
Apoptosis assays
The luminescent-based Caspase-Glo 3/7 assay kit (Promega) was used according to the manufacturer's instructions. Annexin V and 7-AAD permeability were analyzed using an apoptotic detection kit (BD Bioscience), a MACSQuant Analyzer (Miltenyi Biotec), and FlowJo software (Treestar).
DNA construction and lentivirus infection
The target sequences for gene silencing of IRP1 and IRP2 are: IRP2-shRNA-1(GATCTTACAGTTGACCATTCT), IRP2-shRNA-2(GGAGTGGCTGGAAAGTTTGTT), IRP1-shRNA-1(GTAATAGCATATGCAATTGCT), IRP1-shRNA-2(GAACGATACACTATCATTATT). The shRNA cassettes were cloned into the lentiviral vector plu-EGFP as previously described (34, 35). For IRP2 rescue experiment, a PCR-based mutagenesis method was used and IRP2 shRNA-2 targeting sequence in IRP2 expression vector was converted from GGAGTGGCTGGAAAGTTTGTT to GGAGTGGCaGGtAAaTTcGTc (lower case indicating mutation site). The detailed procedure of virus collection and infection has been previously described(34).
Establishment of inducible IRP2 knockdown clones
Tet-inducible IRP2 knockdown clones were established in MDA-MB-231-Luc cells by lentiviral transduction of pLenti6/TR (Invitrogen) and blastidin (10 μg/ml) selection followed by introduction of a lentiviral vector containing an IRP2 shRNA sequence under the control of TRE and selection with puromycin (0.8 μg/ml). The shRNA sequence used to knockdown IRP2 was described previously (36).
Labile iron pool assay
The cellular labile iron pool was measured using calcein as a fluorescent probe, essentially as previously described (12).
Clonogenic assay
After infection with shRNA expressing lentivirus, cells were seeded in 6-well plates at 600, 400, and 200 cells per well. 20 days later, cells were fixed in 10% formalin and stained with 0.25% crystal violet to detect colony formation.
Real-time RT-PCR
Real-time PCR was performed on the ABI Prism 7000 sequence detection system (Applied Biosystems, Foster City, CA) as described previously(36). PCR Primers were designed with IDT PrimerQuest software (Integrated DNA Technologies, Inc.), and are listed in Supplemental Table 1.
Western blotting
Western blotting was performed as described previously(37). Whole cellular protein was extracted using NP-40 lysis buffer containing a protease inhibitor cocktail (Roche Diagnostics). Antibodies used for detection were glyceraldehyde-3-phosphate dehydrogenase (GAPDH) (Fitzgerald), TfR1(Invitrogen), ferritin H(38), IRP1 (MediMabs) and IRP2 (Santa Cruz).
RNA bandshift assay
RNA bandshift assays were performed as previously described (36) using a ferritin H IRE probe prepared from in vitro transcription of BamHI linearized pST18 plasmid (a kind gift of Dr. P. Ponka).
Xenograft experiments
Animal protocols were approved by the Wake Forest School of Medicine Animal Care and Use Committee. MDA-MB-231-Luc cells (infected with lentiviruses encoding control scrambled or IRP2 shRNA) were inoculated into the fourth inguinal mammary fat pad of 8-10-week old female athymic NCrnu/nu mice (strain code 01B74, Frederick National Laboratory for Cancer Research, Frederick, MD). Tumor growth was monitored twice a week using digital calipers; bioluminescent imaging was performed once weekly from day 11 to day 32 post-inoculation. Mice were removed from the study when tumor volume reached 10% of total body weight, and the study was terminated at day 102.
Statistical analysis
Survival times were compared using Kaplan-Meier curves and Log-Rank tests. Tumor volumes and luciferase (flux) values were compared using a repeated measures model taking into account the multiple measurements on each animal. All analyses were performed using SAS version 9.3. Significance levels were set at 0.0167 to allow for 3 pair-wise comparisons to be made among the 3 treatment groups (IRP2KD1, IRP2KD2 and control).
Gene expression analysis in breast tumors
A cohort of primary breast cancer cases previously profiled on Affymetrix GeneChip microarrays (39) was analyzed for correlations between IRP2 gene expression and clinico-pathological characteristics of breast cancer. Microarray data were downloaded from the Gene Expression Omnibus (accession number GSE3494). Raw data were normalized using the MAS5 global mean method, scaled to a mean target intensity value of 500, and log(2) transformed. Expression intensity values of the Affymetrix probe set 225892_at corresponding to IRP2 was used for statistical analyses. Of 251 tumors profiled, 249 were assigned histologic grade (according to the Nottingham modification of the Scarff-Bloom-Richardson grading system) (39) and 228 were assigned to Sorlie-Perou intrinsic subtypes with centroid correlation of at least 0.10 (40). Statistical associations between IRP2 expression and histologic grade or intrinsic subtype were assessed using Student's t-test.
Results
Transferrin receptor 1 is increased and ferritin H is decreased in breast cancer cells compared to non-malignant mammary epithelial cells
Ferritin and TfR1 play major roles in the modulation of cellular iron levels. Ferritin sequesters iron in an inactive form and thus decreases labile iron pool (LIP), while TfR1 transports diferric transferrin into cells to increase LIP. To explore whether these proteins were altered in breast cancer cells, we compared ferritin H and TfR1 protein levels in breast cancer cells versus non-malignant breast epithelial cells. Two pairs of cells were used: 1) normal human mammary epithelial cells (HME) compared to a transformed version of these cells derived by sequential addition of immortalizing and oncogenic proteins (termed R5 here – see Materials and Methods); 2) MCF10A , an immortalized diploid cell line, compared to MCF-7, a cell line generated from a patient with metastatic breast cancer. As shown in Figure 1A, TfR1 is increased, while ferritin H is reduced in breast cancer cell lines (R5 and MCF7) when compared to their non-malignant counterparts (HME and MCF10A), consistent with an iron sequestration phenotype in cancer cells.
Figure 1. Expression of Ferritin, TfR1 and Iron Regulatory Proteins in normal and breast cancer cells.
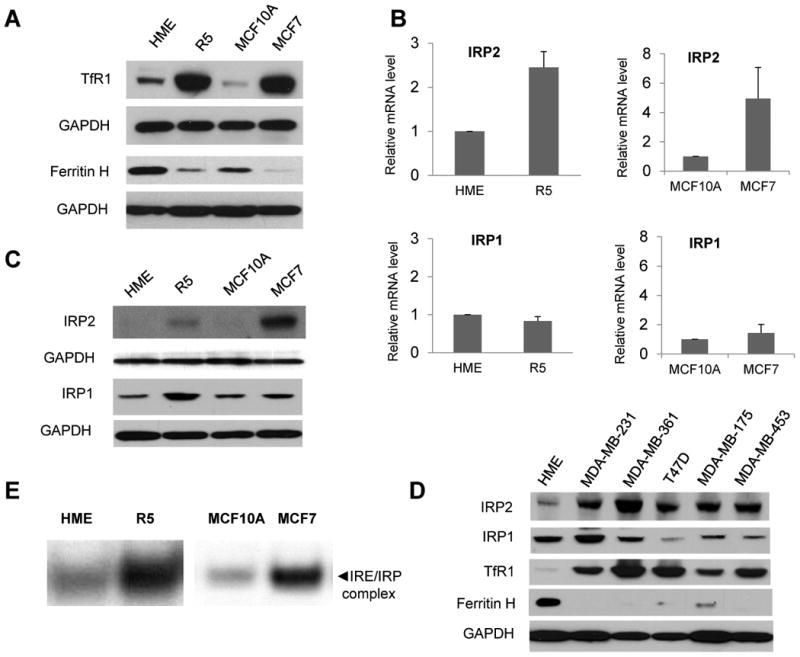
A. Western blots of ferritin H and TfR1 levels in primary human mammary epithelial cells (HME); tumorigenic mammary epithelial cells derived from HME cells (R5); a non-tumorigeneic immortalized breast cell line (MCF10A), and a breast cancer cell line (MCF7). GAPDH was used as a loading control. B. IRP1 and IRP2 mRNA levels measured by real-time RT-PCR. The mean and standard deviations of three independent experiments are shown. C. IRP1 and IRP2 protein levels assessed by western blot. D. Protein levels of IRP2 and other iron metabolic proteins in several breast cancer cell lines. E. IRE RNA gel shift assay. A representative experiment of three independent experiments is shown.
IRP2 is consistently increased in breast cancer cells
Since both ferritin H and TfR1 are controlled by the IRP-IRE system, we tested whether altered expression of either IRP1 or IRP2 was responsible for the change in ferritin and TfR1 observed in breast cancer cells. As shown in Figure 1B, IRP2 mRNA was increased 2-fold in R5 and 4-fold in MCF-7 cells compared to their non-malignant counterparts, HME and MCF10A, while IRP1 mRNA levels were unchanged. Western blots were performed to assess IRP1 and IRP2 protein levels. In contrast to what was observed at the mRNA level, both IRP1 and IRP2 protein levels were increased in R5 and MCF7 breast cancer cells compared to their normal counterparts (Figure 1C).
To assess the generality of these results, we analyzed expression of ferritin H, TfR1, IRP1 and IRP2 in five additional breast cancer cell lines. As shown in Figure 1D, western blot analysis demonstrated a consistent pattern of ferritin H decrease, TfR1 increase, and IRP2 increase in these breast cancer cell lines when compared to normal mammary epithelial cells. In contrast, IRP1 levels were variable. IRP2 mRNA was increased relative to HME cells in all except one cell line (MDA-MB-453), suggesting that both transcriptional and post-transcriptional mechanisms drive the enhanced expression of IRP2 in breast cancer cells (Supplemental Figure 1). As anticipated, transcript levels of TfR1 were increased in these breast cancer cell lines. Levels of ferritin H mRNA were decreased (Supplemental Figure 1), suggesting that reduction in ferritin H transcripts may amplify the effects of IRP2-mediated translational repression. Levels of IRP1 mRNA were variable (Supplemental Figure 1), consistent with the variable levels of IRP1 protein seen in Figure 1D.
Because IRPs regulate ferritin H and TfR1 expression by binding to IREs, we next tested whether increased IRP expression in R5 and MCF7 breast cancer cells correlated with IRE binding activity using an RNA bandshift assay that measures binding to a radio-labeled IRE RNA probe. As shown in Figure 1E, IRE binding activity was greatly enhanced in R5 and MCF7 breast cancer cells when compared to their non-malignant counterparts. Thus, increased IRP expression in breast cancer cells is functional, in that the IRP proteins engage their IRE sequences. The enhanced binding of IRPs to IREs is consistent with the inhibition of ferritin H expression and increases in TfR1 expression seen in Figure 1A and 1D.
Transient knockdown of IRP2, not IRP1, alters ferritin H and TfR1 expression
As protein levels of both IRP1 and IRP2 were increased in MCF7, R5 and MDA-MB-231breast cancer cells (Figure 1C,D), we next assessed whether IRP1 and IRP2 were equally important in regulating ferritin H and TfR1 expression in breast cancer. IRP1 and IRP2 were transiently knocked down in MDA-MB-231-Luc breast cancer cells using lentivirus shRNA expression vectors. As shown in Figure 2A, knockdown of IRP1 had little effect on ferritin H or TfR1, whereas knockdown of IRP2 dramatically increased ferritin H expression and moderately decreased TfR1 expression. An inducible IRP2 knockdown system showed a similar reduction inTfR1 and increase in ferritin following IRP2 knockdown (Figure 2B). As anticipated, the decrease in TfR1 and increase in ferritin was accompanied by a reduction in the labile iron pool (Figure 2C). Consistent with the known role of IRPs in regulating TfR1 mRNA stability and ferritin H translation efficiency (26), knockdown of IRP2 decreased TfR1 but not ferritin H mRNA (Supplemental Figure 2). These results indicate that IRP2 exerts its classic function as an iron regulator in breast cancer cells, and that IRP2 may play a more important role than IRP1 in regulating iron metabolism in breast cancer.
Figure 2. Effect of IRP knockdown on ferritin H and TfR1 expression.
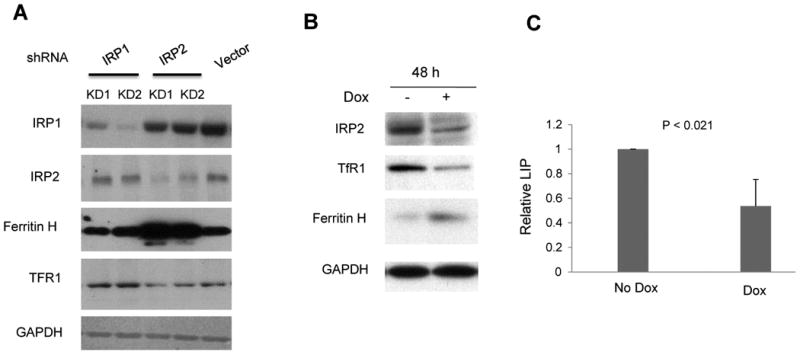
A. MDA-MD-231-Luc cells were infected with lentivirus expressing IRP1 shRNA (lane 1,2), IRP2 shRNA (lane 3, 4) and scrambled shRNA (lane 5). KD1 and KD2 refer to two independent infections with knockdown lentiviral vectors. IRP1, IRP2,ferritin H, TfR1 and GAPDH protein levels were measured by western blot. B. MDA-MB-231 cells were used to establish a stable cell line in which IRP2 shRNA expression is controlled by doxycycline. 48 hours after doxycycline treatment (1 μg/ml), western blots of IRP2, ferritin H and TfR1 were performed. GAPDH was used as a loading control. C. labile iron pool (LIP) was measured after IRP2 was conditionally knocked down. The mean and standard deviations of three independent experiments are shown.
Knockdown of IRP2, not IRP1, inhibits cancer cell growth in vitro
To determine the role of IRP overexpression in breast cancer, we first examined the effect of IRP knockdown on cancer cell growth in vitro. As shown in Figure 3A, knockdown of IRP2 significantly decreased cell growth as measured by a metabolic assay. To confirm that this inhibitory effect is specifically attributable to IRP2 knockdown, a rescue experiment was performed by transfecting IRP2 knockdown cells with an IRP2 expression vector that is not recognized by IRP2 shRNA (Figure 3B). After IRP2 protein was restored, the inhibition of cell growth was abolished, and cells grew at a similar rate as controls (Figure 3B). To confirm the effect of IRP2 knockdown on cell survival, a clonogenic assay was performed. In accord with metabolic assays, IRP2 shRNA significantly inhibited colony formation (Figure 3C,D). IRP2 knockdown similarly inhibited the growth of MCF7 cells, another breast cancer cell line (Supplemental Figure 3). In contrast to results obtained with IRP2 knockdown, IRP1 knockdown did not appreciably inhibit cell growth (Figure 3E). We tested whether IRP2 overexpression was sufficient to stimulate proliferation of MCF10A cells, a non-malignant breast cell line. As shown in Supplemental Figure 4, IRP2 overexpression did not enhance the growth of these cells, suggesting that the increased level of IRP2 in breast cancer cells is necessary but not sufficient to drive malignant growth.
Figure 3. Effect of IRP knockdown on tumor cell growth in vitro.
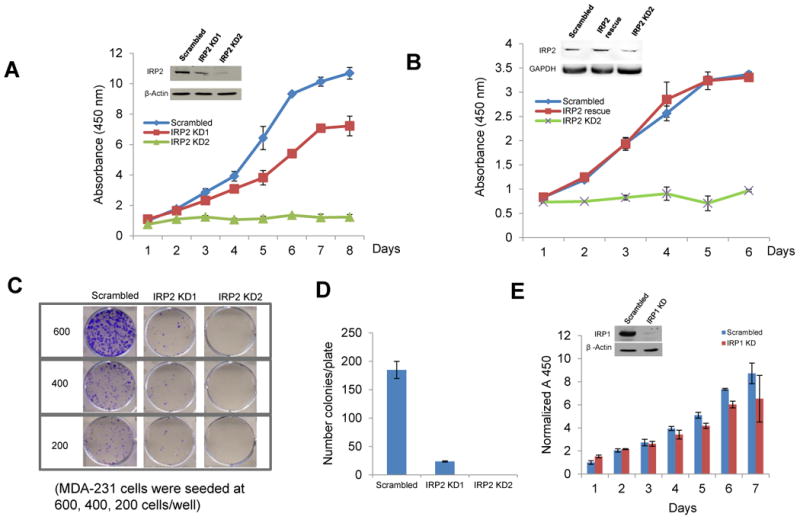
A. Following infection of MDA-MB-231 Luc cells with lentivirus expressing IRP2 shRNA or scrambled control shRNA, a WST-1 cell proliferation assay was performed to measure cell growth. KD1 and KD2 refer to two independent infections with knockdown lentiviral vectors. B. A WST-1 cell proliferation assay was performed on cells infected with scrambled shRNA, IRP2 shRNA, or cells rescued from IRP2 knockdown by co-infection with a lentivirus expressing IRP2 shRNA and a lentivirus expressing IRP2 mRNA that does not bind to shRNA. IRP2 rescue was confirmed by western blot (inset). C. After infection with IRP2 shRNA lentivirus, cells were seeded at 600, 400 and 200 cells/well in 6-well plates and a clonogenic assay was performed. D. The number of colonies per well were quantified. E. Cells were infected with lentivirus expressing scrambled shRNA and IRP1 shRNA and proliferation measured using a WST-1 assay. Shown in panels A-E are means and standard deviations of three replicate determinations in a representative experiment of three independent experiments.
IRP2 knockdown induces apoptosis
As shown in Figure 2, IRP2 knockdown increases ferritin, decreases TfR1, and decreases metabolically available iron, creating an iron deficient condition. As iron deficiency has previously been shown to trigger apoptosis (41, 42), we examined whether the inhibitory effect of IRP2 knockdown on cell growth is related to apoptosis by measuring the activity of caspase 3/7, proteases that are selectively activated during apoptosis (43). As shown in Figure 4A, caspase activity was significantly increased after IRP2 knockdown. To confirm these results, we used flow cytometry to assess levels of annexin V as well as uptake of 7-AAD following IRP2 knockdown. Annexin V measures exposure of phosphatidylserine on the cell surface and is a marker of early apoptosis(44), whereas 7-AAD permeability is an indicator of plasma membrane integrity and is associated with late-stage apoptosis(45). As shown in Figure 4B, both these markers were elevated following IRP2 knockdown.
Figure 4. IRP2 knockdown induces apoptosis.

MDA-MB-231 cells were infected with lentivirus expressing scrambled or IRP2 shRNA. A. Caspase activity was measured using a Caspase-Glo 3/7 assay kit. Shown are means and standard deviations of four replicate determinations in a representative experiment of three independent experiments (**, p<0.01). B. Cells were stained with APC-Annexin V and 7-AAD at 5-7 days after infection and analyzed by flow cytometry. Shown is a representative experiment of two independent experiments.
Knockdown of IRP2 in breast cancer cells suppresses tumor growth in vivo
We next assessed the role of IRP2 in breast tumor growth in vivo using a xenograft model. Triple-negative MDA-MB-231-Luc breast cancer cells were infected with lentivirus expressing IRP2 shRNA or a control scrambled shRNA and injected orthotopically in the mammary fat pad of female nude mice. Two separate infections of MDA-MB-231-Luc cells with IRP2 knockdown lentiviruses were performed (termed IRP2 KD1 and IRP2 KD2); cells were implanted into mice five days following infection. Tumor growth was monitored by optical imaging beginning at day 11 following implantation and by calipers when tumors became palpable (day 14). As shown in Figure 5A-C, expression of IRP2 shRNA significantly decreased the rate of tumor growth compared to control as measured both by tumor volume and luciferase activity (p<0.0001); this interaction remained significant if time was treated as a continuous variable (p<0.0001). IRP2 KD1 and IRP2 KD2 did not differ significantly from each other. The magnitude of the inhibitory effect of IRP2 knockdown was substantial, and at day 35, tumor volume in knockdown mice averaged less than 20% of control. When followed over a longer term, IRP2 knockdown significantly prolonged survival (Figure. 5D, Log Rank Statistic Chi-Square value of 18.64 (2 degrees of freedom), p<0.0001).
Figure 5. Effect of IRP2 knockdown on tumor growth in vivo.
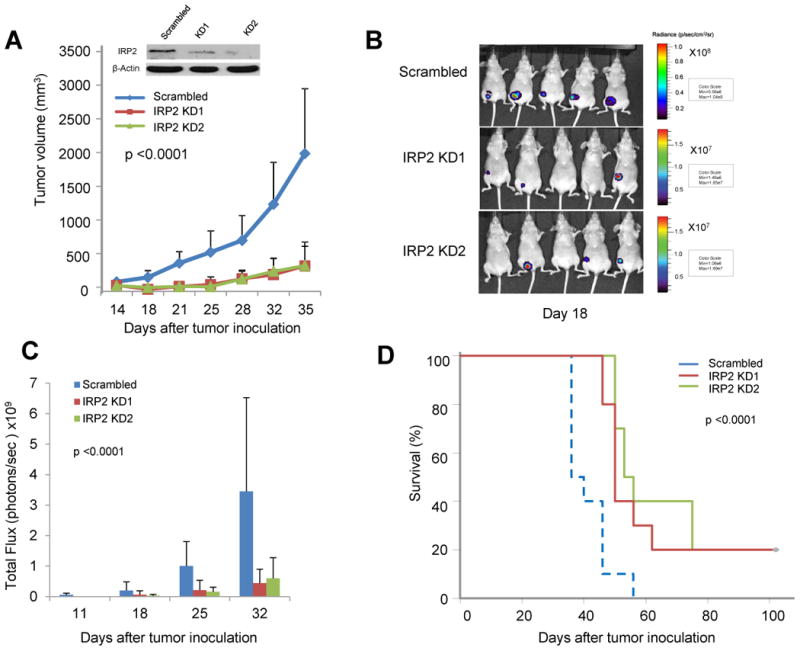
After infection with lentivirus expressing control shRNA or IRP2 shRNA, equal numbers of MDA-MB-231 Luc cells were injected into the mouse mammary fat pad of nude mice (n=10/group). A. Tumor volumes were monitored twice a week. B. Luciferase activity was monitored weekly for 4 weeks; shown are images taken at day 18. C. Total flux was quantified; means and standard deviations are shown. D. Kaplan-Meier plot showing survival of tumor-bearing mice over the 108 day timeframe of the experiment. In all cases, the difference between control (scrambled) and IRP2 knockdown was significant (p <0.0001).
IRP2 expression is correlated with histologic grade and molecular subtype of human breast cancer
We next assessed the relationship between IRP2 expression and known prognostic features in breast cancer by analyzing expression data from surgically resected human breast tumors in a cohort of 251 consecutive breast cancer patients from Uppsala Sweden (39). As shown in Figure 6A, IRP2 mRNA transcript level is associated with tumor grade and is highest in Grade III poorly differentiated tumors. Sorlie et al. classified breast cancers into five intrinsic subtypes with significantly different outcomes: normal-like, luminal A (LumA), HER2-enriched, luminal B (LumB), and basal (46). We analyzed the distributions of IRP2 mRNA levels according to subtype. As shown in Figure 6B, IRP2 mRNA is lower in the normal-like subtype, which has a favorable prognosis, and higher in the LumB and Basal subtypes, which have a poorer prognosis. IRP2 mRNA was also higher in the LumA subtype than in the normal-like subtype. Median IRP2 levels were higher in the ERBB2 subtype, although the difference between IRP2 expression in normal-like and ERBB2 subtypes did not attain statistical significance (Figure 6B). IRP2 expression was not associated with distant metastasis-free survival (not shown).
Figure 6. Correlation between IRP2 expression and tumor grades and molecular subtypes.

A. Box-and-whisker plots of the relationship between IRP2 gene expression and histologic grade (G1, G2, G3) are shown. P value from Student's t test is shown above the bridge linking different histologic grades. B. IRP2 and tumor subtypes. Box-and-whisker plots of the relationship between IRP2 gene expression and Sorlie-Perou molecular subtypes are shown. P value from Student's t test is shown above the bridge linking different molecular subtypes.
To obtain insight into mechanisms responsible for IRP2 reduction in breast tumors, we performed a pathway analysis on a large cohort of 759 breast tumors(25). We ranked tumors based on IRP2 expression and selected the upper and low deciles (i.e. 76 tumors per group) for analysis of differential expression. We then ranked the genes by false-discovery adjusted p-value (FDR) and selected the top 1% of probe sets on the array (q<0.001; 448 probe sets) for further analysis. Of these, 369 were overexpressed in the IRP2 overexpressors (IRP2 “high” genes), and 79 were overexpressed in the IRP2 underexpressors (IRP2 “low” genes). We analyzed each group of genes by DAVID pathway analysis (47, 48). The “low” genes showed no enrichment of biological terms after FDR adjustment. By contrast, the “high” genes showed highly significant term enrichment after FDR correction. We examined the Gene Ontology (GO) biological process (GOTERM_BP) terms on this list (Supplemental Table 2). The 7 top GO BP categories involved cellular catabolic processes. Although genes in these categories showed some overlap, they included cellular macromolecule catabolic process (p=2.6 × 10⁻⁷), proteolysis involved in cellular protein catabolic process (p=1.6×10⁻⁵), and modification-dependent macromolecule catabolic process (p=2.1×10⁻⁵), suggesting that genes involved in protein catabolism, such as ubiquitin-dependent proteolysis, are highly upregulated in the IRP2 overexpressors. Genes involved in protein transport and RNA processing also showed significant enrichment.
Discussion
In this report, we identify IRP2 as an iron regulatory protein upregulated in breast cancer (Figure 1, 6). The increase in IRP2 had functional consequences, leading to an increase in IRE binding activity, which in turn was associated with a decrease in ferritin, an increase in TfR1, and an increase in labile iron (Figure 1,2). These findings are consistent with the classical function of IRP2 in iron regulation, and suggest that enhanced IRP2 expression in breast cancer increases intracellularly available iron by increasing iron uptake and decreasing iron storage. Taken together with our previous observations that breast cancer cells have diminished expression of the Fe(II) exporter ferroportin (12), our results suggest a model in which decreased iron storage (low ferritin), increased iron uptake (high TfR1), and decreased iron export (low ferroportin) all contribute to supporting high levels of labile iron in breast cancer (Figure 7). The results presented in this manuscript further suggest that at least in some breast cancers, this pathway may be driven by increased expression of IRP2.
Figure 7. Model of the role of IRP2 in breast cancer.

The increased level of IRP2 in breast cancer cells inhibits ferritin H translation and stabilizes TfR1 mRNA. Decreased ferritin H reduces iron storage while increased TfR1 increases iron uptake, increasing the metabolically available labile iron pool. Breast cancer cells have diminished expression of the Fe(II) exporter ferroportin (14). Overall, the level of intracellular iron is increased in breast cancer cells. The increased iron contributes to breast cancer growth.
Our studies suggest that IRP2 may be functionally more important than IRP1 in controlling iron metabolism in breast cells. Thus knockdown of IRP2 but not IRP1 increased ferritin and decreased TfR1 in breast cells (Figure 2). The non-redundant activity of IRP1 and IRP2 in breast cells is consistent with previous work demonstrating tissue-specific variations in the activity of IRP1 and IRP2 (49), as well as the different phenotypes of IRP1 and IRP2 knockout mice (50-52). Because IRP1 levels did not appear to affect cell growth (Figure 3E) or proteins of iron metabolism in breast cancer cells in vitro (Figure 2A), we did not pursue the role of IRP1 further. However, we note that effects of IRP1 in vitro do not always mirror their effects in vivo (53), and it remains possible that IRP1 may contribute to iron metabolism and/or breast tumor growth in vivo.
To examine the consequence of IRP2 on breast cancer growth, we reduced IRP2 expression in breast cancer cells and monitored the effect on tumor growth in vitro and in vivo. We hypothesized that by limiting bioreactive (labile) iron, IRP2 knockdown would retard tumor growth. Results showed that knockdown of IRP2 did indeed reduce cell number and induce apoptosis in cell culture (Figures 3 and 4). It is possible that IRP2 also exerts an effect on the cell cycle, although we did not study this directly. IRP2 knockdown similarly decreased the growth of breast cancer cells in mouse mammary fat pad xenografts, and prolonged the survival of tumor-bearing mice (Figure 5). Two different vectors were used to knockdown IRP2 (KD1 and KD2). Greater knockdown was reproducibly achieved with KD2 (Figures 3, 5), which led to a greater reduction in growth of IRP2 KD cells in vitro (Figure 3). The more modest reduction in IRP2 attained in KD1 cells was nonetheless sufficient to inhibit tumor growth in vivo, and both MDA-MB-231 KD1 and MDA-MB-231 KD2 cells exhibited a profound reduction in tumor growth in vivo (Figure 5). We speculate that the enhanced effect of IRP2 knockdown on tumor growth in vivo may reflect an increased dependence of tumor cells on the IRP2 regulatory axis in the in vivo environment.
The effect of IRP2 overexpression on tumor growth has been studied in lung cancer using a tet-off system to overexpress IRP2 in H1299 lung cancer cells (54). Consistent with our observations, overexpression of IRP2 stimulated tumor growth when H1299 cells were injected subcutaneously in nude mice. However, in contrast to our observations, only a slight increase in TfR1 expression, and no change in ferritin H expression was observed, leading to the suggestion that the tumorigenic properties of IRP2 may not depend on its classic iron regulatory function (54). In contrast, our results suggest that changes in expression of IRP2 are associated with changes in levels of the classic IRP2 targets TfR1 and ferritin. Differences between the two studies may be attributable to the different cancers investigated (lung vs breast), or to differences in experimental design (overexpression vs knockdown in the current report). It is also possible that chronic overexpression may engender an adaptive response enabling ferritin to escape IRP2 regulation, or that IRP2 levels may already be saturating in cancer cells, such that further upregulation does not lead to an incremental repression of ferritin.
To explore the relevance of these findings to human breast cancer, we examined the association between IRP2 expression and tumor grade using expression microarray data from a cohort study of 251 consecutive breast cancer patients. The results demonstrate a strong association between IRP2 expression and tumor grade, with IRP2 gene expression highest in Grade III (poorly differentiated) tumors (Figure 6).
We also assessed the expression of IRP2 in molecular subtypes of breast cancer. Breast cancer is a heterogeneous disease, comprising several subtypes that differ considerably in prognosis (46). Recent work has shown that these can be divided according to molecular profile into intrinsic subtypes termed normal-like, luminal A (LumA), luminal B (LumB), ERBB2, and basal (55). We observed that when compared to the normal-like subtype, IRP2 is upregulated in LumA, LumB and basal subtypes, but not in the ERBB2 subtype (Figure 6) (which comprises approximately 20% of all breast cancers (56)). In contrast, we previously observed that ferroportin is downregulated in all breast cancer molecular subtypes (12). Thus, upregulation of IRP2 may drive changes in ferroportin and iron metabolism in some but not all breast cancers. This interpretation is in line with our recent work demonstrating that there are multiple pathways through which breast tumors modulate expression of ‘iron genes’ to acquire and retain more iron (25). For example, we previously reported that two separate gene dyads were particularly important in determining patient outcome: TfR1 and HFE (which control iron import), and ferroportin and hepcidin (which control iron export). Patients with a good prognosis frequently exhibited either a favorable iron import or iron export prognosis profile, but not both (25).
Our analysis did not demonstrate an association of IRP2 expression with distant metastasis-free survival, perhaps suggesting that IRP2 is important in tumor cell growth but does not influence processes involved in metastasis, such as migration and invasion. Alternatively, effects of IRP2 on metastasis-free survival may only become apparent when expression of another gene is simultaneously affected. For example, we previously demonstrated that expression of hepcidin is only correlated with survival in patients with tumors that express elevated levels of ferroportin; in tumors with low levels of ferroportin, expression of hepcidin did not affect DMFS (25).
Experiments directed at identifying such potential IRP2 partner genes are ongoing. Since metastases were not evident at the last timepoint imaged in our xenograft model (Supplementary Figure 5), the question of the role of IRP2 on metastases could not be directly addressed in these experiments, and will require additional evaluation in the future.
Mechanisms underlying altered regulation of IRP2 in breast cancer may be complex. Our in vitro results demonstrate that increased levels of IRP2 mRNA are usually not but uniformly associated with an increase in IRP2 protein (Figure 1 and Supplemental Figure 1), suggesting that both transcriptional and post-transcriptional mechanisms may contribute to elevated levels of IRP2 in breast cancer. Gene ontology analysis of biological processes altered in breast tumors unexpectedly showed that elevated IRP2 mRNA was strongly associated with alterations in catabolic processes, suggesting that IRP2 expression may be linked to larger transcriptional programs in breast cancer that drive catabolic biological processes. Future experiments will be directed at interrogating how these processes are linked to increases in IRP2.
Taken together, our results demonstrate that IRP2 plays an important role in regulating iron metabolism and tumor growth in breast cancer. Changes in the proteins of iron metabolism in breast cancer might be explained by a primary modulation of IRP2 in cancer cells (Figure 7), driven, at least in some tumors, by primary alterations in mRNA of IRP2. Knockdown of IRP2 dramatically inhibits tumor growth both in vitro and in vivo, further suggesting that IRP2 might be useful as a therapeutic target in breast cancer.
Supplementary Material
Acknowledgments
This work was supported by a grant from the National Institutes of Health (R01 CA171101, FMT).
Footnotes
The authors declare no conflict of interest.
References
- 1.Torti SV, Torti FM. Iron and cancer: more ore to be mined. Nature reviews Cancer. 2013 doi: 10.1038/nrc3495. [DOI] [PMC free article] [PubMed] [Google Scholar]
- 2.Torti SV, Torti FM. Ironing out cancer. Cancer research. 2011;71:1511–4. doi: 10.1158/0008-5472.CAN-10-3614. [DOI] [PMC free article] [PubMed] [Google Scholar]
- 3.Huang X. Iron overload and its association with cancer risk in humans: evidence for iron as a carcinogenic metal. Mutat Res. 2003;533:153–71. doi: 10.1016/j.mrfmmm.2003.08.023. [DOI] [PubMed] [Google Scholar]
- 4.Kaomongkolgit R, Cheepsunthorn P, Pavasant P, Sanchavanakit N. Iron increases MMP-9 expression through activation of AP-1 via ERK/Akt pathway in human head and neck squamous carcinoma cells. Oral Oncol. 2008;44:587–94. doi: 10.1016/j.oraloncology.2007.08.005. [DOI] [PubMed] [Google Scholar]
- 5.Lin M, Rippe RA, Niemela O, Brittenham G, Tsukamoto H. Role of iron in NF-kappa B activation and cytokine gene expression by rat hepatic macrophages. Am J Physiol. 1997;272:G1355–64. doi: 10.1152/ajpgi.1997.272.6.G1355. [DOI] [PubMed] [Google Scholar]
- 6.Brookes MJ, Boult J, Roberts K, Cooper BT, Hotchin NA, Matthews G, et al. A role for iron in Wnt signalling. Oncogene. 2008;27:966–75. doi: 10.1038/sj.onc.1210711. [DOI] [PubMed] [Google Scholar]
- 7.Thelander L, Graslund A, Thelander M. Continual presence of oxygen and iron required for mammalian ribonucleotide reduction: possible regulation mechanism. Biochemical and biophysical research communications. 1983;110:859–65. doi: 10.1016/0006-291x(83)91040-9. [DOI] [PubMed] [Google Scholar]
- 8.Rudolf J, Makrantoni V, Ingledew WJ, Stark MJ, White MF. The DNA repair helicases XPD and FancJ have essential iron-sulfur domains. Molecular cell. 2006;23:801–8. doi: 10.1016/j.molcel.2006.07.019. [DOI] [PubMed] [Google Scholar]
- 9.Kulp KS, Green SL, Vulliet PR. Iron deprivation inhibits cyclin-dependent kinase activity and decreases cyclin D/CDK4 protein levels in asynchronous MDA-MB-453 human breast cancer cells. Experimental cell research. 1996;229:60–8. doi: 10.1006/excr.1996.0343. [DOI] [PubMed] [Google Scholar]
- 10.Lucas JJ, Szepesi A, Domenico J, Takase K, Tordai A, Terada N, et al. Effects of iron-depletion on cell cycle progression in normal human T lymphocytes: selective inhibition of the appearance of the cyclin A-associated component of the p33cdk2 kinase. Blood. 1995;86:2268–80. [PubMed] [Google Scholar]
- 11.Nurtjahja-Tjendraputra E, Fu D, Phang JM, Richardson DR. Iron chelation regulates cyclin D1 expression via the proteasome: a link to iron deficiency-mediated growth suppression. Blood. 2007;109:4045–54. doi: 10.1182/blood-2006-10-047753. [DOI] [PubMed] [Google Scholar]
- 12.Pinnix ZK, Miller LD, Wang W, D'Agostino R, Jr, Kute T, Willingham MC, et al. Ferroportin and iron regulation in breast cancer progression and prognosis. Science translational medicine. 2010;2:43ra56. doi: 10.1126/scisignal.3001127. [DOI] [PMC free article] [PubMed] [Google Scholar]
- 13.Rao VA, Klein SR, Agama KK, Toyoda E, Adachi N, Pommier Y, et al. The iron chelator Dp44mT causes DNA damage and selective inhibition of topoisomerase IIalpha in breast cancer cells. Cancer research. 2009;69:948–57. doi: 10.1158/0008-5472.CAN-08-1437. [DOI] [PMC free article] [PubMed] [Google Scholar]
- 14.Buss JL, Greene BT, Turner J, Torti FM, Torti SV. Iron chelators in cancer chemotherapy. Curr Top Med Chem. 2004;4:1623–35. doi: 10.2174/1568026043387269. [DOI] [PubMed] [Google Scholar]
- 15.Yamasaki T, Terai S, Sakaida I. Deferoxamine for advanced hepatocellular carcinoma. The New England journal of medicine. 2011;365:576–8. doi: 10.1056/NEJMc1105726. [DOI] [PubMed] [Google Scholar]
- 16.Whitnall M, Howard J, Ponka P, Richardson DR. A class of iron chelators with a wide spectrum of potent antitumor activity that overcomes resistance to chemotherapeutics. Proceedings of the National Academy of Sciences of the United States of America. 2006;103:14901–6. doi: 10.1073/pnas.0604979103. [DOI] [PMC free article] [PubMed] [Google Scholar]
- 17.Kovacevic Z, Chikhani S, Lovejoy DB, Richardson DR. Novel thiosemicarbazone iron chelators induce up-regulation and phosphorylation of the metastasis suppressor N-myc down-stream regulated gene 1: a new strategy for the treatment of pancreatic cancer. Molecular pharmacology. 2011;80:598–609. doi: 10.1124/mol.111.073627. [DOI] [PubMed] [Google Scholar]
- 18.Yuan J, Lovejoy DB, Richardson DR. Novel di-2-pyridyl-derived iron chelators with marked and selective antitumor activity: in vitro and in vivo assessment. Blood. 2004;104:1450–8. doi: 10.1182/blood-2004-03-0868. [DOI] [PubMed] [Google Scholar]
- 19.Yager JD, Davidson NE. Estrogen carcinogenesis in breast cancer. The New England journal of medicine. 2006;354:270–82. doi: 10.1056/NEJMra050776. [DOI] [PubMed] [Google Scholar]
- 20.Roy D, Floyd RA, Liehr JG. Elevated 8-hydroxydeoxyguanosine levels in DNA of diethylstilbestrol-treated Syrian hamsters: covalent DNA damage by free radicals generated by redox cycling of diethylstilbestrol. Cancer research. 1991;51:3882–5. [PubMed] [Google Scholar]
- 21.Liehr JG, Jones JS. Role of iron in estrogen-induced cancer. Curr Med Chem. 2001;8:839–49. doi: 10.2174/0929867013372931. [DOI] [PubMed] [Google Scholar]
- 22.Kabat GC, Rohan TE. Does excess iron play a role in breast carcinogenesis? An unresolved hypothesis. Cancer Causes Control. 2007;18:1047–53. doi: 10.1007/s10552-007-9058-9. [DOI] [PubMed] [Google Scholar]
- 23.Shi Z, Hu X, Yuan B, Pan X, Dai Y, Holmboe-Ottesen G, et al. Strong negative association between intake of tofu and anemia among Chinese adults in Jiangsu, China. Journal of the American Dietetic Association. 2008;108:1146–53. doi: 10.1016/j.jada.2008.04.036. [DOI] [PubMed] [Google Scholar]
- 24.Ionescu JG, Novotny J, Stejskal V, Latsch A, Blaurock-Busch E, Eisenmann-Klein M. Increased levels of transition metals in breast cancer tissue. Neuro Endocrinol Lett. 2006;27(Suppl 1):36–9. [PubMed] [Google Scholar]
- 25.Miller LD, Coffman LG, Chou JW, Black MA, Bergh J, D'Agostino R, Jr, et al. An iron regulatory gene signature predicts outcome in breast cancer. Cancer research. 2011;71:6728–37. doi: 10.1158/0008-5472.CAN-11-1870. [DOI] [PMC free article] [PubMed] [Google Scholar]
- 26.Hentze MW, Muckenthaler MU, Andrews NC. Balancing acts: molecular control of mammalian iron metabolism. Cell. 2004;117:285–97. doi: 10.1016/s0092-8674(04)00343-5. [DOI] [PubMed] [Google Scholar]
- 27.Hentze MW, Caughman SW, Rouault TA, Barriocanal JG, Dancis A, Harford JB, et al. Identification of the iron-responsive element for the translational regulation of human ferritin mRNA. Science. 1987;238:1570–3. doi: 10.1126/science.3685996. [DOI] [PubMed] [Google Scholar]
- 28.Rouault TA, Hentze MW, Caughman SW, Harford JB, Klausner RD. Binding of a cytosolic protein to the iron-responsive element of human ferritin messenger RNA. Science. 1988;241:1207–10. doi: 10.1126/science.3413484. [DOI] [PubMed] [Google Scholar]
- 29.Aziz N, Munro HN. Iron regulates ferritin mRNA translation through a segment of its 5′ untranslated region. Proceedings of the National Academy of Sciences of the United States of America. 1987;84:8478–82. doi: 10.1073/pnas.84.23.8478. [DOI] [PMC free article] [PubMed] [Google Scholar]
- 30.Casey JL, Hentze MW, Koeller DM, Caughman SW, Rouault TA, Klausner RD, et al. Iron-responsive elements: regulatory RNA sequences that control mRNA levels and translation. Science. 1988;240:924–8. doi: 10.1126/science.2452485. [DOI] [PubMed] [Google Scholar]
- 31.Koeller DM, Casey JL, Hentze MW, Gerhardt EM, Chan LN, Klausner RD, et al. A cytosolic protein binds to structural elements within the iron regulatory region of the transferrin receptor mRNA. Proceedings of the National Academy of Sciences of the United States of America. 1989;86:3574–8. doi: 10.1073/pnas.86.10.3574. [DOI] [PMC free article] [PubMed] [Google Scholar]
- 32.McKie AT, Marciani P, Rolfs A, Brennan K, Wehr K, Barrow D, et al. A novel duodenal iron-regulated transporter, IREG1, implicated in the basolateral transfer of iron to the circulation. Molecular cell. 2000;5:299–309. doi: 10.1016/s1097-2765(00)80425-6. [DOI] [PubMed] [Google Scholar]
- 33.Elenbaas B, Spirio L, Koerner F, Fleming MD, Zimonjic DB, Donaher JL, et al. Human breast cancer cells generated by oncogenic transformation of primary mammary epithelial cells. Genes & development. 2001;15:50–65. doi: 10.1101/gad.828901. [DOI] [PMC free article] [PubMed] [Google Scholar]
- 34.Deng Z, Wan M, Cao P, Rao A, Cramer SD, Sui G. Yin Yang 1 regulates the transcriptional activity of androgen receptor. Oncogene. 2009;28:3746–57. doi: 10.1038/onc.2009.231. [DOI] [PMC free article] [PubMed] [Google Scholar]
- 35.Sui G, Shi Y. Gene silencing by a DNA vector-based RNAi technology. Methods in molecular biology. 2005;309:205–18. doi: 10.1385/1-59259-935-4:205. [DOI] [PubMed] [Google Scholar]
- 36.Wang W, Di X, D'Agostino RB, Jr, Torti SV, Torti FM. Excess capacity of the iron regulatory protein system. The Journal of biological chemistry. 2007;282:24650–9. doi: 10.1074/jbc.M703167200. [DOI] [PubMed] [Google Scholar]
- 37.Wang W, Di X, Torti SV, Torti FM. Ferritin H induction by histone deacetylase inhibitors. Biochemical pharmacology. 2010;80:316–24. doi: 10.1016/j.bcp.2010.04.008. [DOI] [PMC free article] [PubMed] [Google Scholar]
- 38.Pietsch EC, Chan JY, Torti FM, Torti SV. Nrf2 mediates the induction of ferritin H in response to xenobiotics and cancer chemopreventive dithiolethiones. The Journal of biological chemistry. 2003;278:2361–9. doi: 10.1074/jbc.M210664200. [DOI] [PubMed] [Google Scholar]
- 39.Miller LD, Smeds J, George J, Vega VB, Vergara L, Ploner A, et al. An expression signature for p53 status in human breast cancer predicts mutation status, transcriptional effects, and patient survival. Proceedings of the National Academy of Sciences of the United States of America. 2005;102:13550–5. doi: 10.1073/pnas.0506230102. [DOI] [PMC free article] [PubMed] [Google Scholar]
- 40.Calza S, Hall P, Auer G, Bjohle J, Klaar S, Kronenwett U, et al. Intrinsic molecular signature of breast cancer in a population-based cohort of 412 patients. Breast cancer research : BCR. 2006;8:R34. doi: 10.1186/bcr1517. [DOI] [PMC free article] [PubMed] [Google Scholar]
- 41.Greene BT, Thorburn J, Willingham MC, Thorburn A, Planalp RP, Brechbiel MW, et al. Activation of caspase pathways during iron chelator-mediated apoptosis. The Journal of biological chemistry. 2002;277:25568–75. doi: 10.1074/jbc.M110345200. [DOI] [PubMed] [Google Scholar]
- 42.Abeysinghe RD, Greene BT, Haynes R, Willingham MC, Turner J, Planalp RP, et al. p53-independent apoptosis mediated by tachpyridine, an anti-cancer iron chelator. Carcinogenesis. 2001;22:1607–14. doi: 10.1093/carcin/22.10.1607. [DOI] [PubMed] [Google Scholar]
- 43.Zimmermann KC, Bonzon C, Green DR. The machinery of programmed cell death. Pharmacology & therapeutics. 2001;92:57–70. doi: 10.1016/s0163-7258(01)00159-0. [DOI] [PubMed] [Google Scholar]
- 44.Wlodkowic D, Skommer J, Darzynkiewicz Z. Cytometry of apoptosis. Historical perspective and new advances. Experimental oncology. 2012;34:255–62. [PMC free article] [PubMed] [Google Scholar]
- 45.Lecoeur H, de Oliveira-Pinto LM, Gougeon ML. Multiparametric flow cytometric analysis of biochemical and functional events associated with apoptosis and oncosis using the 7-aminoactinomycin D assay. Journal of immunological methods. 2002;265:81–96. doi: 10.1016/s0022-1759(02)00072-8. [DOI] [PubMed] [Google Scholar]
- 46.Sorlie T, Perou CM, Tibshirani R, Aas T, Geisler S, Johnsen H, et al. Gene expression patterns of breast carcinomas distinguish tumor subclasses with clinical implications. Proceedings of the National Academy of Sciences of the United States of America. 2001;98:10869–74. doi: 10.1073/pnas.191367098. [DOI] [PMC free article] [PubMed] [Google Scholar]
- 47.Huang da W, Sherman BT, Lempicki RA. Bioinformatics enrichment tools: paths toward the comprehensive functional analysis of large gene lists. Nucleic acids research. 2009;37:1–13. doi: 10.1093/nar/gkn923. [DOI] [PMC free article] [PubMed] [Google Scholar]
- 48.Huang da W, Sherman BT, Lempicki RA. Systematic and integrative analysis of large gene lists using DAVID bioinformatics resources. Nature protocols. 2009;4:44–57. doi: 10.1038/nprot.2008.211. [DOI] [PubMed] [Google Scholar]
- 49.Sanchez M, Galy B, Schwanhaeusser B, Blake J, Bahr-Ivacevic T, Benes V, et al. Iron regulatory protein-1 and -2: transcriptome-wide definition of binding mRNAs and shaping of the cellular proteome by iron regulatory proteins. Blood. 2011;118:e168–79. doi: 10.1182/blood-2011-04-343541. [DOI] [PubMed] [Google Scholar]
- 50.Galy B, Holter SM, Klopstock T, Ferring D, Becker L, Kaden S, et al. Iron homeostasis in the brain: complete iron regulatory protein 2 deficiency without symptomatic neurodegeneration in the mouse. Nature genetics. 2006;38:967–9. doi: 10.1038/ng0906-967. discussion 9-70. [DOI] [PubMed] [Google Scholar]
- 51.LaVaute T, Smith S, Cooperman S, Iwai K, Land W, Meyron-Holtz E, et al. Targeted deletion of the gene encoding iron regulatory protein-2 causes misregulation of iron metabolism and neurodegenerative disease in mice. Nature genetics. 2001;27:209–14. doi: 10.1038/84859. [DOI] [PubMed] [Google Scholar]
- 52.Meyron-Holtz EG, Ghosh MC, Iwai K, LaVaute T, Brazzolotto X, Berger UV, et al. Genetic ablations of iron regulatory proteins 1 and 2 reveal why iron regulatory protein 2 dominates iron homeostasis. The EMBO journal. 2004;23:386–95. doi: 10.1038/sj.emboj.7600041. [DOI] [PMC free article] [PubMed] [Google Scholar]
- 53.Chen G, Fillebeen C, Wang J, Pantopoulos K. Overexpression of iron regulatory protein 1 suppresses growth of tumor xenografts. Carcinogenesis. 2007;28:785–91. doi: 10.1093/carcin/bgl210. [DOI] [PMC free article] [PubMed] [Google Scholar]
- 54.Maffettone C, Chen G, Drozdov I, Ouzounis C, Pantopoulos K. Tumorigenic properties of iron regulatory protein 2 (IRP2) mediated by its specific 73-amino acids insert. PloS one. 2010;5:e10163. doi: 10.1371/journal.pone.0010163. [DOI] [PMC free article] [PubMed] [Google Scholar]
- 55.Cancer Genome Atlas N. Comprehensive molecular portraits of human breast tumours. Nature. 2012;490:61–70. doi: 10.1038/nature11412. [DOI] [PMC free article] [PubMed] [Google Scholar]
- 56.Sircoulomb F, Bekhouche I, Finetti P, Adelaide J, Hamida A, Bonansea J, et al. Genome profiling of ERBB2-amplified breast cancers. BMC Cancer. 2010;10:539. doi: 10.1186/1471-2407-10-539. [DOI] [PMC free article] [PubMed] [Google Scholar]
Associated Data
This section collects any data citations, data availability statements, or supplementary materials included in this article.