Abstract
Human ether-a-go-go-related gene (HERG) K+ channel underlies the rapidly activating delayed rectifier K+ conductance (IKr) during normal cardiac repolarization. Also, it may regulate excitability in many neuronal cells. Recently, we showed that enrichment of cell membrane with cholesterol inhibits HERG channels by reducing the levels of phosphatidylinositol 4,5-bisphosphate [PtdIns(4,5)P2] due to the activation of phospholipase C (PLC). In this study, we further explored the effect of cholesterol enrichment on HERG channel kinetics. When membrane cholesterol level was mildly increased in human embryonic kidney (HEK) 293 cells expressing HERG channel, the inactivation and deactivation kinetics of HERG current were not affected, but the activation rate was significantly decelerated at all voltages tested. The application of PtdIns(4,5)P2 or inhibitor for PLC prevented the effect of cholesterol enrichment, while the presence of antibody against PtdIns(4,5)P2 in pipette solution mimicked the effect of cholesterol enrichment. These results indicate that the effect of cholesterol enrichment on HERG channel is due to the depletion of PtdIns(4,5)P2. We also found that cholesterol enrichment significantly increases the expression of β1 and β3 isoforms of PLC (PLCβ1, PLCβ3) in the membrane. Since the effects of cholesterol enrichment on HERG channel were prevented by inhibiting transcription or by inhibiting PLCβ1 expression, we conclude that increased PLCβ1 expression leads to the deceleration of HERG channel activation rate via downregulation of PtdIns(4,5)P2. These results confirm a crosstalk between two plasma membrane-enriched lipids, cholesterol and PtdIns(4,5)P2, in the regulation of HERG channels.
Keywords: HERG; K+ channel; cholesterol; long QT syndrome; methyl-β-cyclodextrin; phosphatidylinositol 4,5-bisphosphate; phospholipase C
Introduction
The kinetic behavior of human ether-a-go-go-related gene (HERG) K+ channel is characterized by slow activation and deactivation, on the order of hundreds of milliseconds to seconds. Inactivation kinetics are very rapid, on the order of milliseconds to tens of milliseconds.1,2 These unusual kinetics enable HERG channels to serve as a rapidly activating delayed rectifier K+ conductance (IKr) during normal cardiac repolarization.3 Long QT syndrome (LQTS), which is marked by delayed cardiac repolarization, is a clinical condition for the cardiac ventricular tachyarrhythmia and sudden death. The importance of HERG channel is underscored by the fact that over 250 HERG channel mutations and polymorphisms are linked or suspected in LQTS.4 In addition, blockade of HERG channel by various prescription drugs causes LQTS.5 These include antihistamines (terfenadine), gastrointestinal prokinetic agents (cisapride) and many psychoactive agents (amitryptiline, chlorpromazine, haloperidol and thioridazine). Hence, the early recognition of potential LQTS liability is an essential component of drug discovery,6 and any physiological inhibitory factors need to be thoroughly studied. The functional significance of HERG channel is suggested, not only in cardiac cells but also in various neuronal cells, such as hippocampal glial cells7 and Purkinje cells.8
Phosphatidylinositol 4,5-bisphosphate [PtdIns(4,5)P2] plays a fundamental role in the plasma membrane, where it regulates signal transduction, exocytosis/endocytosis, actin dynamics and ion channel and transporter functions.9,10 HERG channel is one of the ion channels under the regulation of PtdIns(4,5)P2. When internally dialyzed, PtdIns(4,5)P2 accelerates the activation and slows the inactivation kinetics of HERG channel.11 Also, the presence of anti-PtdIns(4,5)P2 antibody in whole-cell pipette solution produces the opposite effects of PtdIns(4,5)P2. The C terminus of HERG channel contains cluster of basic residues, which is proposed as a PtdIns(4,5)P2 binding domain, since some deletion at this segment abolishes the effects of PtdIns(4,5)P2.12 Similar to PtdIns(4,5)P2, cholesterol is enriched in the plasma membrane, influencing structural and physical properties, such as fluidity, curvature and stiffness. Therefore, cholesterol levels may affect the function of various ion channels and receptors in the plasma membrane. Recently, we showed that the increased membrane cholesterol level negatively regulates PtdIns(4,5)P2-sensitive channels including HERG channel.13 The effect of cholesterol enrichment on HERG channel is by the downregulation of PtdIns(4,5)P2 level due to the activation of phospholipase C (PLC).
In this study, we further explored the effect of cholesterol on HERG channel kinetics. We found that HERG current amplitudes were reduced without any changes in the voltage-dependence of the activation when HERG-transfected HEK293 cells were mildly enriched with cholesterol. The inclusion of PtdIns(4,5)P2 in the pipette solution or pre-treating with PLC inhibitors prevented the effects of cholesterol suggesting that increased cholesterol level activates the PLC pathway to downregulate the PtdIns(4,5)P2 level. We also found that cholesterol enrichment specifically increased the expression of the β1 and β3 isoforms of PLC (PLCβ1, PLCβ3) in the membrane. Specific inhibition of PLCβ1 expression prevented the effect of cholesterol on HERG channel, which may suggest a close link between PLCβ1 and HERG channel activity. From these results, we conclude that one of the novel functions of cholesterol is to modulate HERG channel by regulating the expression of PLC.
Results
Inhibition of HERG K+ currents by cholesterol
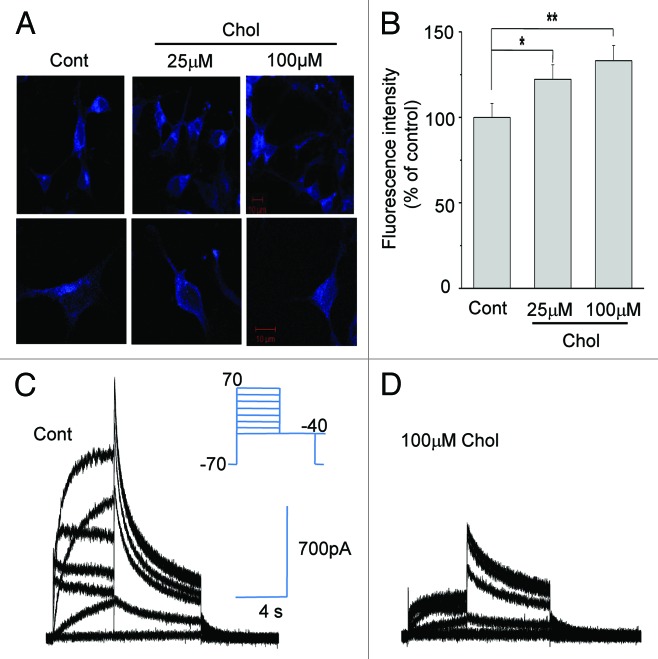
MβCD, a water-soluble cyclic oligosaccharide, has a hydrophobic cavity encapsulating the insoluble cholesterol. MβCD saturated with cholesterol (MβCD-cholesterol) can act as a cholesterol donor and is used to increase cholesterol level in the plasma membrane.14-16 We incubated HERG-transfected HEK293 cells with MβCD-cholesterol for 1 h and monitored the changes of cholesterol levels using the fluorescence dye filipin. Typical staining results in Figure 1A show that free cholesterol levels in the plasma membrane were increased by MβCD-cholesterol. Quantification of filipin staining indicated that the cholesterol levels in the plasma membrane increased by 22.2 ± 8.5% (n = 38) and 33.2 ± 8.8% (n = 38) when cells were incubated with 25 μM and 100 μM MβCD-cholesterol, respectively (Fig. 1B).
Figure 1. Increasing membrane cholesterol levels inhibits HERG K+ currents. (A and B) Incubating HERG-transfected HEK293 cells with MβCD-cholesterol increased cholesterol levels in the plasma membrane. Cells were incubated with 25 μM or 100 μM MβCD-cholesterol for 1 h at 37 °C. Filipin staining was performed for 30 min at room temperature after cholesterol enrichment. Typical fluorescent images are shown (A). The scale bars represent 10 μm. Fluorescent intensities from plasma membrane were quantified as described in Materials and Methods (B; n = 38). *p < 0.05; **p < 0.01 (C and D) HERG K+ currents were inhibited by cholesterol enrichment. Cells were incubated with 100 μM MβCD-cholesterol for 1 h before recordings. Representative families of HERG K+ currents from control cells (C) and from cholesterol-enriched cells (D) were recorded using the voltage protocol shown in the inset. Depolarizing steps were applied from a holding potential of −70 mV to between −60 and +50 mV for 4 sec, followed by a step to −40 mV to elicit currents.
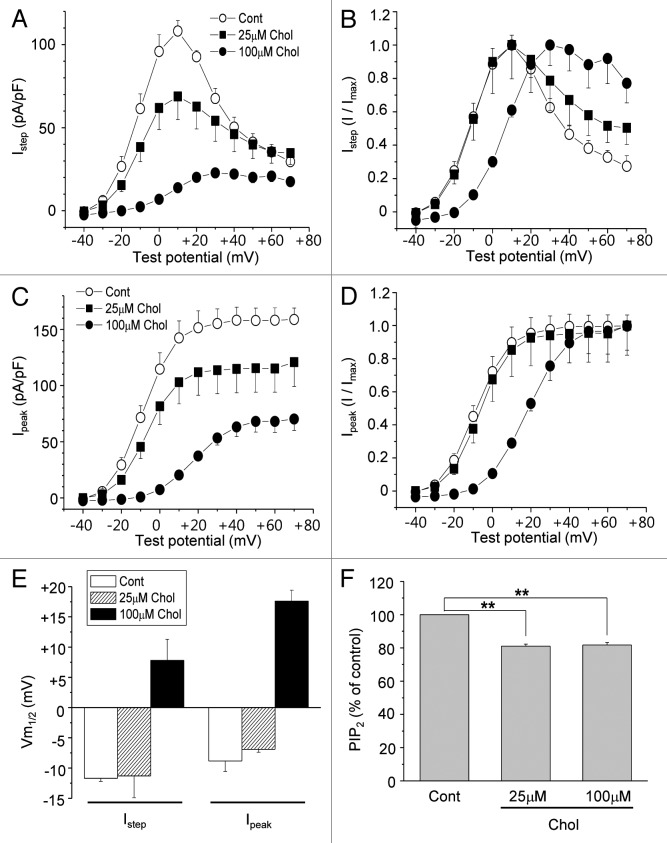
To elicit HERG currents, depolarizing steps were applied from a holding potential of −70 mV to between −60 and +70 mV for 4 sec, followed by a step to −40 mV. HERG currents gave rise to very slow activation behavior (Fig. 1C), consistent with a prior report.11 When cells were incubated with 100 μM MβCD-cholesterol for 1 h, the amplitudes of the HERG current decreased, as shown in the typical recording depicted in Figure 1D, which was consistent with our previous result.13 Cells were incubated with 25 μM or 100 μM MβCD-cholesterol, and the maximum currents (Istep), and the tail currents (Ipeak) were measured at different voltages (Fig. 2A and C). Since HERG current activates slowly and inactivates rapidly, Ipeak measured by a repolarizing step pulse to −40 mV was combinations of activation and recovery from the fast inactivation. First, the effect of cholesterol enrichment was observed at all voltages tested. Also, the inhibitory effect of MβCD-cholesterol was larger at 100 μM than at 25 μM. Istep and Ipeak were normalized to obtain the voltage-dependent activation curves for HERG current, as shown in Figure 2B and D. MβCD-cholesterol at 25 μM did not change the voltage-dependence of the activation curve, while 100 μM MβCD-cholesterol induced a right shift. The curves in Figure 2B and D were fit with Boltzmann equations, and the resulting half voltages to maximal activation (Vm1/2) were compared (Fig. 2E). MβCD-cholesterol at 100 μM induced shifts in Vm1/2 by 18.5 ± 0.3 mV (n = 7) for Istep and by 22.0 ± 0.3 mV (n = 7) for Ipeak, respectively.
Figure 2. Mild augmentation of membrane cholesterol levels inhibits HERG K+ currents without changing the voltage dependence curve. (A and C) Averaged current-voltage relations obtained for HERG K+ currents (n = 7). Cells were incubated with 25 μM or 100 μM MβCD-cholesterol for 1–2 h at 37 °C before recordings. Currents were measured at the end of the depolarizing step (A; Istep) or peak tail current amplitude (C; I peak) following the step to −40 mV as described in Figure 1C. (B and D) The voltage-dependent activation curves for Istep and Ipeak were obtained by normalizing the data at (A) and (C), respectively. (E) Voltage-dependent activation curves at (B) and (D) were fit with Boltzmann equations, and the resulting half voltages to maximal activation (Vm1/2) were compared. (F) PtdIns(4,5)P2 levels in the membrane fractions were measured by using PtdIns(4,5)P2 ELISA kit as described in Materials and Methods. Cells were treated with 25 μM or 100 μM MβCD-cholesterol for 1 h at 37 °C. **p < 0.01
Inhibition of HERG currents by cholesterol enrichment via downregulation of PtdIns(4,5)P2 level
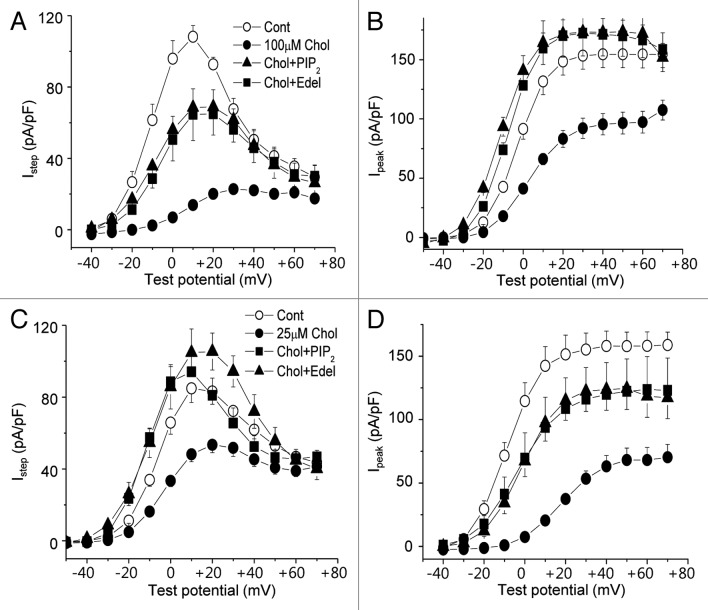
In an earlier report, we showed that the inhibitory effect of cholesterol enrichment on HERG channel is due to the downregulation of PtdIns(4,5)P2 level, which is caused by the activation of PLC.13 To validate this observation in the current system, the PtdIns(4,5)P2 level in the membrane was measured using ELISA method. PtdIns(4,5)P2 levels were downregulated by 19.0 ± 1.3% (n = 5) and 18.2 ± 1.6% (n = 5) when cells were treated for 1 h with 25 μM and 100 μM MβCD-cholesterol, respectively (Fig. 2F). To confirm that the downregulation of PtdIns(4,5)P2 level was the underlying mechanism for the effect of cholesterol enrichment on HERG channel, we included 25 μM PtdIns(4,5)P2 in the whole-cell pipette solution. The presence of PtdIns(4,5)P2 partially recovered Istep and Ipeak from the effects of 100 μM MβCD-cholesterol (Fig. 3A and B). On the other hand, the presence of PtdIns(4,5)P2 not only prevented the effects of 25 μM MβCD-cholesterol on Istep and Ipeak, but also increased current amplitudes further than in control cells (Fig. 3C and D). These results were consistent with a previous report.11
Figure 3. The inhibitory effect of cholesterol on HERG K+ currents is blocked by intracellular PtdIns(4,5)P2 or edelfosine. Cells were incubated with 25 μM or 100 μM MβCD-cholesterol for 1–2 h at 37 °C before recordings. In some recordings cells were treated with MβCD-cholesterol along with PLC inhibitor, 5 μM edelfosine (Chol+Edel) or 25 μM PtdIns(4,5)P2 was included in the pipette solution (Chol+PtdIns(4,5)P2). (A and C) Averaged current-voltage relations obtained for HERG K+ currents (n = 7), measured at the end of the depolarizing step following the step to −40 mV as described in Figure 1 (Istep). (B and D) The peak tail HERG K+ currents amplitude were measured (n = 7) following the step to −40 mV (I peak).
We also pre-incubated cells with MβCD-cholesterol along with 5 μM of the PLC inhibitor, edelfosine, for 1–2 h before recordings. Edelfosine itself had no effect on HERG current (data not shown). The presence of edelfosine partially prevented the effect of 100 μM MβCD-cholesterol on Istep and Ipeak of HERG currents (Fig. 3A and B). However, it completely prevented the inhibitory effect of 25 μM MβCD-cholesterol on HERG currents (Fig. 3C and D). In this condition, the recovered HERG current level by edelfosine was very similar to the current level obtained with PtdIns(4,5)P2 in pipette solution. Together, these results may indicate that most of the effect of 25 μM MβCD-cholesterol on HERG channel can be attributed to the downregulation of PtdIns(4,5)P2 level via the activation of PLC, and that some part of inhibitory effect of 100 μM MβCD-cholesterol is due to a pathway other than the downregulation of PtdIns(4,5)P2. For this reason, further experiments in the present study focused on the effect of 25 μM MβCD-cholesterol on HERG channel.
Deceleration of HERG current activation by cholesterol enrichment by PLC activation
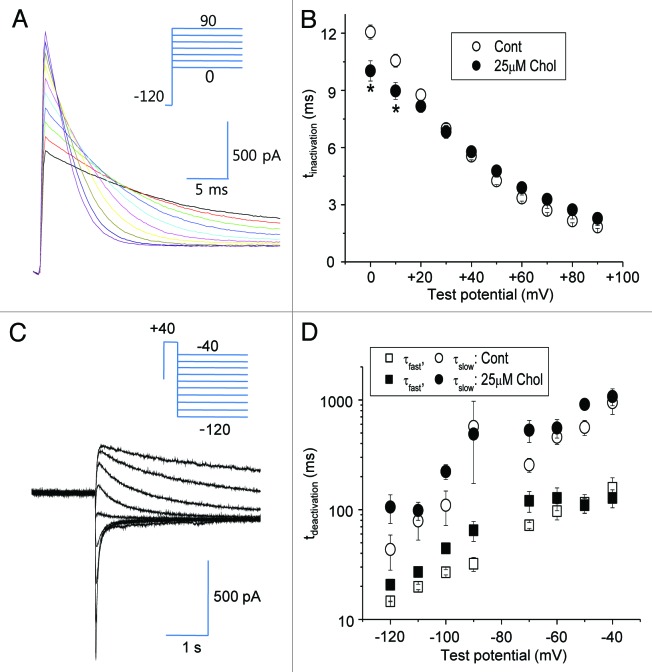
To test whether cholesterol enrichment altered the inactivation kinetics of HERG channel, we measured the voltage-dependence of steady-state inactivation as described previously.17Figure 4A shows a typical recording. As shown in Figure 4B, 25 μM MβCD-cholesterol increased the inactivation rate (τinactivation) only at depolarizing test potentials to 0 or −10 mV. We also tested the effect of 25 μM MβCD-cholesterol on deactivation of HERG current using relaxation of tail current analysis (Fig. 4C). Deactivation of HERG current (τdeactivation) was well fit with two exponentials. The measured relaxation time constants (τfast, τslow) showed no changes by cholesterol enrichment (Fig. 4D). These results indicated that altering either inactivation or deactivation kinetics of HERG channel cannot be the underlying mechanism for the downregulation of HERG channel by mild cholesterol enrichment.
Figure 4. Steady-state inactivation and deactivation of HERG currents are not affected by mild cholesterol enrichment. Cells were incubated with 25 μM MβCD-cholesterol for 1–2 h at 37 °C before recordings. (A) To measure the voltage-dependence of steady-state inactivation, channels were activated by prolonged depolarization to +20 mV followed by a brief hyperpolarizing step to -120 mV and then depolarization to various potentials. The voltage protocol is shown in the inset. Current traces were fit with single exponential equation to obtain τinactivation. (B) Summary data of voltage-dependence of rates of inactivation showing that the mild cholesterol enrichment slows the rate of inactivation only at depolarizing voltage over +10 mV (n = 5). Open circles: control cells. Closed circles: cells treated with 25 μM MβCD-cholesterol. *p < 0.05 (C) Deactivation of HERG current was measured. Currents were stimulated by a 2 sec prepulse to −40 mV, followed by test pulses ranging from −120 to −20 mV for 3 sec. The voltage protocol is shown in the inset. Current traces were fit with two exponential equations to obtain τdeactivation. (D) Summary of deactivation kinetic analysis shows that mild cholesterol enrichment induced no significant changes in both the fast time constant (τfast), and the fast time constant (τslow) (n = 5).
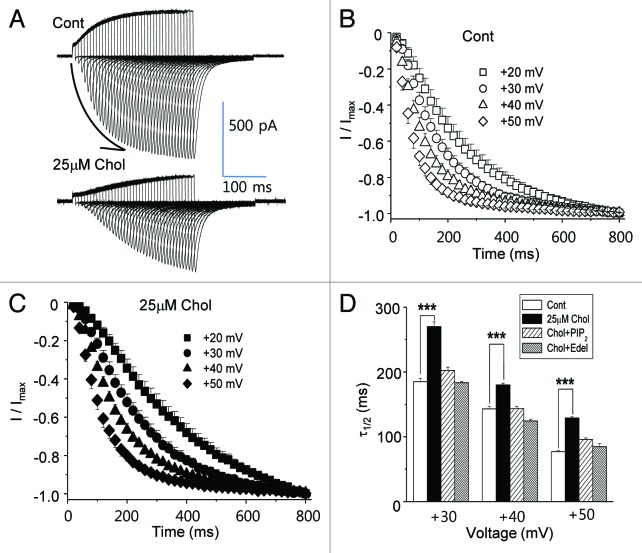
Next, we examined the activation kinetics of HERG current by varying the duration of the depolarizing pulse at different testing voltages and measuring the peak inward tail current on repolarizing to −110 mV as previously described.11 A typical recording at +40 mV testing voltage is shown in Figure 5A. The accumulated peak inward tail currents were elicited by increasing the duration of the depolarizing pulses as indicated by the arrow in the figure. The kinetic time course of the activation at different testing voltage is shown in Figure 5B for control HERG current. The rate of current activation accelerates as the testing voltage depolarized from +20 mV to +50 mV, which may indicate faster channel openings as membrane potential depolarized. When the half times to maximal rise (τ1/2) were obtained by fitting the curves with exponential decays, they were 185 ± 5 ms at +30 mV, 143 ± 4 ms at +40 mV and 77 ± 2 ms at +50 mV (Fig. 5D; n = 6). Cholesterol enrichment with 25 μM MβCD-cholesterol decelerated the kinetic time course of the activation, as shown in the typical recording depicted in Figure 5A. The effect of cholesterol enrichment on the time course of the activation was observed at different testing voltages (Fig. 5C; n = 6). Cholesterol increased τ1/2 to 271 ± 7 ms at +30 mV, 180 ± 3 ms at +40 mV and 129 ± 2 ms at +50 mV (Fig. 5D). Thus, mild cholesterol enrichment slowed HERG channel openings at all voltages tested.
Figure 5. Activation kinetics of HERG current are slowed by mild cholesterol enrichment due to the activation of PLC. HERG current was activated by varying the duration of the depolarizing pulse at different testing voltages. The peak inward tail current was recorded following repolarization to −110 mV. (A) A typical recording at +40 mV testing voltage is shown from control cells and from cells incubated with 25 μM MβCD-cholesterol for 1–2 h at 37 °C before recordings. The arrow in the figure represents the accumulation of peak inward tail currents elicited by increasing the duration of the depolarizing pulses. (B and C) Summary of activation kinetic analysis as determined by time constants fitted to depolarization-induced outward currents shows that mild cholesterol enrichment decelerated channel activation. Each symbol represents time constants from different testing voltages (+20, +30, +40 or +50 mV; n = 6). (D) The half times to maximal rise (τ1/2) were obtained by fitting the curves at (B), and (C) with single exponential decays. τ1/2 obtained at different testing voltages (+20, +30 or +40 mV) show that the mild cholesterol enrichment decelerated channel activation. In some recordings, cells were treated with MβCD-cholesterol along with the PLC inhibitor, 5 μM edelfosine (Chol+Edel; n = 7), or 25 μM PtdIns(4,5)P2 was included in the pipette solution [Chol+PtdIns(4,5)P2; n = 6]. ***p < 0.001.
Since the presence of PtdIns(4,5)P2 recovered HERG current amplitudes for Istep and Ipeak from the effects of 25 μM cholesterol enrichment (Fig. 3C and D), we tested whether it was also able to recover the time course of the activation. The presence of PtdIns(4,5)P2 in the pipette solution recovered τ1/2 values similar to those of control cells at all of tested voltages from cholesterol-enriched cells [Chol+ PtdIns(4,5)P2; Fig. 5D]. We also tested the effect of edelfosine on the time course of the activation. Edelfosine itself was without effect on HERG channel activation (data not shown). Similar to PtdIns(4,5)P2, edelfosine recovered τ1/2 values even in cholesterol-enriched cells (Chol+Edel; Fig. 5D). From these results, we confirmed that enriching plasma membrane with cholesterol using 25 μM MβCD-cholesterol decelerated the activation rate of HERG K+ current by the downregulation of PtdIns(4,5)P2 level via PLC activation.
Deceleration of HERG current activation by depletion of PtdIns(4,5)P2
To further confirm that the downregulation of PtdIns(4,5)P2 level was the underlying mechanism for the effect of mild cholesterol enrichment on HERG channel, we included anti-PtdIns(4,5)P2 antibody in the intracellular pipette solution. The antibody sequestered PtdIns(4,5)P2 from plasma membranes, effectively reducing PtdIns(4,5)P2 level without interfering with PtdIns(4,5)P2 metabolism.12 The presence of anti-PtdIns(4,5)P2 antibody (PtdIns(4,5)P2 Ab), but not that of control antibody (Cont Ab), resulted in the inhibition of HERG currents in these cells (Fig. 6A). The voltage-dependent activation curve for Istep was not changed by the antibody (inset of Fig. 6A), consistent with our previous conclusion that the mild cholesterol treatment induces the downregulation of PtdIns(4,5)P2 without affecting the voltage-dependency of the channel.
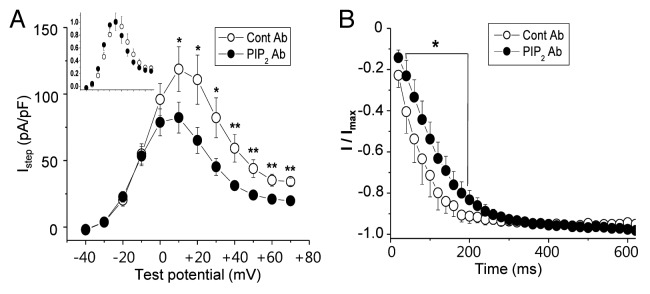
Figure 6. Depletion of PtdIns(4,5)P2 mimics the effect of the mild cholesterol enrichment. (A) Averaged current-voltage relations were measured at the end of the depolarizing step following the step to −40 mV as described in Figure 1C (Istep). Either control antibody (Cont Ab; n = 4) or anti-PtdIns(4,5)P2 antibody [PtdIns(4,5)P2 Ab; n = 7] was included in the intracellular pipette solution (1/100 dilution). For the effective sequestering of PtdIns(4,5)P2 by anti-PtdIns(4,5)P2 antibody, recordings of HERG current were started 10 min after obtaining whole-cell configuration. The inset shows voltage-dependent activation curve for Istep obtained by normalizing the current by the maximum currents. (B) The time course of HERG channel activation was analyzed as described in Figure 5B. *p < 0.05; **p < 0.01.
The presence of anti-PtdIns(4,5)P2 antibody in the pipette solution also induced changes in the time course of the activation as shown in Figure 6B. When control antibody was present in the pipette solution at testing voltage of +50 mV, τ1/2 value was 70 ± 3 ms (n = 4), while it was 115 ± 5 ms (n = 7) when anti-PtdIns(4,5)P2 antibody was present. Thus, the changes induced by sequestering PtdIns(4,5)P2 from membranes were very similar to the effects of 25 μM MβCD-cholesterol. These results may suggest that most of 25 μM MβCD-cholesterol effect on HERG channel can be attributed to the downregulated PtdIns(4,5)P2 level.
Increase of PLCβ1 and β3 expression by cholesterol enrichment
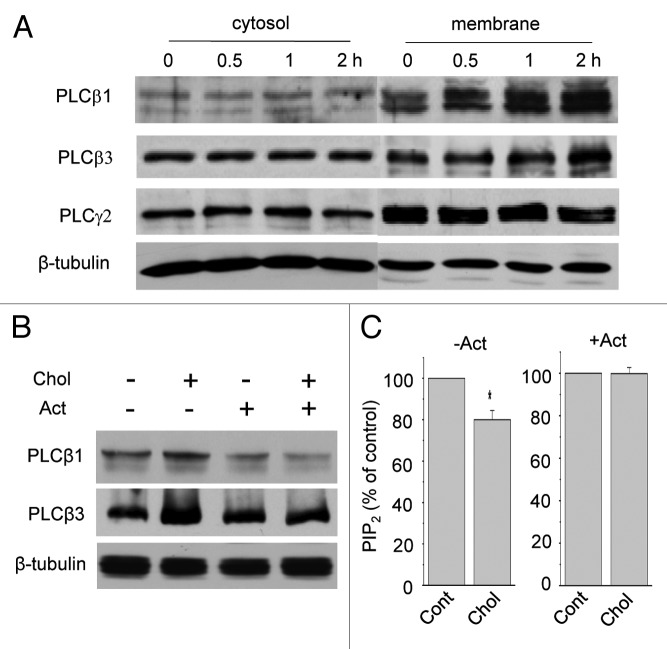
The major catabolic pathway for PtdIns(4,5)P2 is the hydrolysis by PLC in the plasma membrane. We already showed that cholesterol enrichment increased the expressions of β1 and β3 PLC isoforms in HeLa cells.18 To validate this observation in the current system, the expression levels of PLC isoforms were compared in membrane and cytosol fractions from HERG-transfected HEK293 cells using western blot analysis. Cells were incubated with 25 μM MβCD-cholesterol for 0.5–2 h. Then cells were homogenized and membrane and cytosol fractions were obtained. PLC proteins were probed with a polyclonal antibody raised against rabbit PLCβ1, PLCβ3 and PLCγ2. The expression levels of PLCβ1 and PLCβ3 were significantly increased by cholesterol enrichment only in membrane fractions, as shown in Figure 7A for a typical result. Densitometry analysis of the bands indicated that cholesterol increased PLCβ1 level in membrane fraction by about 26% (n = 3) after 0.5 h incubation time. The PLCβ3 level was increased only after 1 h. Cholesterol did not induce the translocation of these proteins from cytosol to membrane since the expression levels of PLCβ1 and PLCβ3 in cytosol fractions were not reduced at all. Instead, the levels of PLCβ1 and PLCβ3 increased only in membrane fractions. Cholesterol did not change the expression levels of other PLC isoform such as PLCγ2, as shown in Figure 7A. Similarly, the expression level of PLCγ1 was not changed by cholesterol enrichment (Fig. S1). These results suggest that mild cholesterol enrichment specifically increases the levels of PLCβ1 and PLCβ3 in the membrane.
Figure 7. Mild cholesterol enrichment increases PLCβ1 and PLCβ3 expressions. (A) Representative western blotting results show that mild cholesterol enrichment increased PLCβ1 and PLCβ3 expressions from HERG-transfected cells. Cells were incubated with 25 μM MβCD-cholesterol for 0.5, 1 and 2 h. Membrane and cytosol fractions were obtained as described in Materials and Methods. Similar results were obtained from four different experiments. Note that PLCβ1 and PLCβ3 expressions were increased in time-dependent manner by cholesterol from membrane fraction but not from cytosol fraction. In contrast, PLCγ2 expression was not changed by cholesterol. β-tubulin was used to confirm the amount of proteins loaded. Similar results were obtained from three different experiments. (B) Transcription inhibitor prevented the effects of mild cholesterol enrichment on PLCβ1 and PLCβ3 expressions. Cells were pre-treated with the transcription inhibitor, 10 μM actinomycin-D (Act) for 10 min, which was followed by the additional 0.5 h incubation with 25 μM MβCD-cholesterol. In the presence of Act, the effect of cholesterol on PLCβ1 and PLCβ3 expressions in membrane fractions was prevented. Similar results were obtained from three different experiments. β-tubulin was used to confirm the amount of proteins loaded. (C) Transcription inhibitor prevented the effect of mild cholesterol enrichment on PtdIns(4,5)P2 levels. Cells were incubated in the absence (−Act) or presence (+Act) of 10 μM Act with 25 μM MβCD-cholesterol for 1 h. PtdIns(4,5)P2 levels in membrane fractions were measured by using a PtdIns(4,5)P2 ELISA kit as described in Materials and Methods. In the absence of Act, cholesterol decreased PtdIns(4,5)P2 levels by 20.0 ± 4.5% (n = 5). However, the presence of Act prevented the effect of cholesterol on PtdIns(4,5)P2 levels (n = 5). *p < 0.05
We used MβCD-cholesterol to enrich cholesterol in the plasma membrane. However, we feared that the effects of cholesterol enrichment might be due to the non-specific effects of MβCD.19 To avoid the use of MβCD, cholesterol was solubilized by sonication in DMEM. When cells were incubated with 25 μM solubilized cholesterol for 1 h, the expression of PLCβ1 in the membrane fraction was increased, while the expression of PLCβ3 was not changed (data not shown). We also measured PtdIns(4,5)P2 level in the membrane after cells were treated with 25 μM solubilized cholesterol for 1 h by ELISA. PtdIns(4,5)P2 level was downregulated significantly by 13 ± 2.1% (n = 4) compared with control cells. Thus, these results indicated that the effects of MβCD-cholesterol on PLCβ1 expression was not due to the non-specific effect of MβCD.
To determine whether the effect of cholesterol enrichment on PLC expression was due to the increased transcription, we performed semi-quantitative RT-PCR for PLCβ1 and PLCβ4. HERG-transfected HEK293 cells were incubated with cholesterol for 0.5 and 1 h. PLCβ1 mRNA level was increased while PLCβ4 mRNA level was not affected by cholesterol (Fig. S2). We also used the selective pharmacological inhibitor, actinomycin-D (Act, 10 μΜ). Cells were pre-incubated for 10 min with Act before additional incubation with 25 μM MβCD-cholesterol for 1 h. Representative western blots for PLCβ1 and PLCβ3 from three different experiments are shown in Figure 7B. The increased PLCβ1 and PLCβ3 expression by mild cholesterol enrichment was completely prevented by Act. These results indicate that the effect of cholesterol enrichment on the expression of PLC was via the upregulation of transcription. In the absence of Act, incubating cells with 25 μM MβCD-cholesterol downregulated PtdIns(4,5)P2 level by 20.0 ± 4.5% (Fig. 7C; n = 5). However, when cells were pre-incubated for 10 min with Act before the additional incubation with 25 μM MβCD-cholesterol for 1 h, the downregulation of PtdIns(4,5)P2 level was prevented (Fig. 7C; n = 5). Thus, these results demonstrated that cholesterol increases the expression of PLCβ1 and PLCβ3 and consequently downregulates PtdIns(4,5)P2 level.
Preventing the effect of cholesterol enrichment on HERG K+ current activation by inhibition of PLCβ1 expression
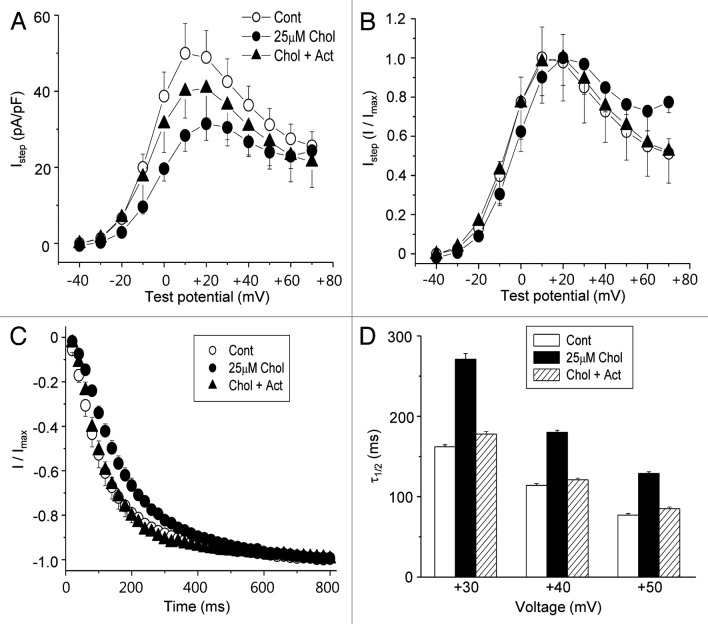
Having demonstrated that the downregulation of PtdIns(4,5)P2 level by mild cholesterol enrichment was due to the increased transcription of PLCβ1 and PLCβ3, we next examined whether the inhibition of transcription prevented the effects of mild cholesterol enrichment on HERG current. For this purpose, cells were incubated for 1 h with 25 μM MβCD-cholesterol with or without Act. As shown in Figure 8A, the effect of 25 μM MβCD-cholesterol on HERG current amplitudes was partially prevented by Act (Chol+Act), while Act alone had no effect on HERG current (data not shown). MβCD-cholesterol at 25 μM did not change the voltage-dependence of HERG current (Fig. 8B), as previously shown in Figure 2B. We also tested the effect of Act on the time course of the activation at +40 mV testing voltage. As expected, the activation was decelerated by 25 μM MβCD-cholesterol (Fig. 8C). However, the effect of MβCD-cholesterol was prevented by the presence of Act (Chol+Act). τ1/2 was decreased from 114 ± 3 ms (n = 6) in control cells to 180 ± 4 ms (n = 6) in cholesterol-enriched cells. It was recovered to 121 ± 3 ms (n = 7) by the presence of Act. The effect of Act at different testing voltage is as shown in Figure 8D. These results indicate that the increased PLC transcription by mild cholesterol enrichment induces the downregulation of PtdIns(4,5)P2 level, which caused the deceleration of HERG channel activation.
Figure 8. The effect of mild cholesterol enrichment on HERG channel is prevented by transcription inhibitor. Cells were incubated with 25 μM MβCD-cholesterol for 1 h in the presence or in the absence of 10 μM Act. (A) Averaged current-voltage relations obtained for HERG K+ currents (n = 6), measured at the end of the depolarizing step following the step to −40 mV as described in Figure 1C (Istep). The inhibitory effect of cholesterol on HERG K+ currents was partially blocked by Act (Chol+Act). (B) Voltage-dependent activation curve for Istep obtained by normalizing the currents in (A) by the maximum currents. No changes were observed by 25 μM MβCD-cholesterol or Act. (C) The time course of HERG channel activation was analyzed from cells incubated with 25 μM MβCD-cholesterol for 1 h in the presence or in the absence of 10 μM Act as described in Figure 5B. *p < 0.05 (D) The half times to maximal rise (τ1/2) were compared in different conditions. They were obtained by fitting the curves from the time course of HERG channel activation shown in (C) at different testing voltages.
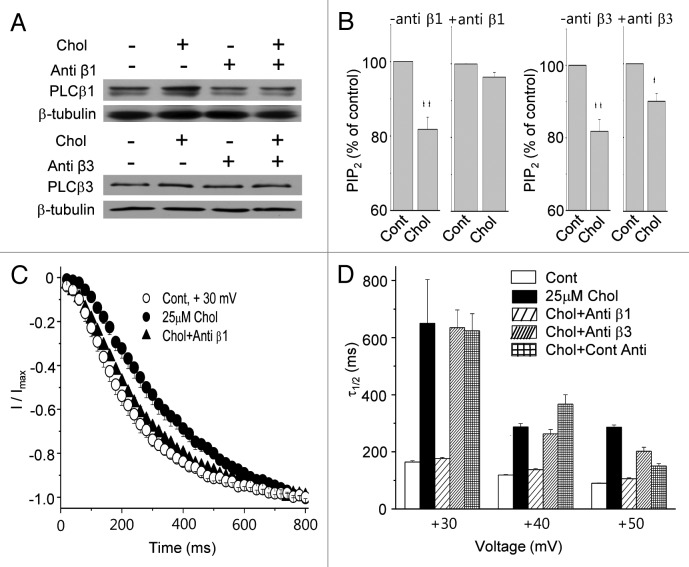
To specifically prevent the increase of PLCβ1 or PLCβ3 expressions without further transfection, we utilized antisense oligonucleotides. Cells were pretreated with serum-free DMEM containing 10 μM antisense oligonucleotides against PLC isoforms for 2 h. Then cells were incubated for additional 1 h with or without 25 μM MβCD-cholesterol. Antisense oligonucleotides having no target were used in the same concentration for controls in all experiments. Typical western blots for PLCβ1 and PLCβ3 obtained from three independent experiments are shown in Figure 9A. The effect of cholesterol on PLCβ1 and PLCβ3 expressions was blocked by the specific antisense oligonucleotides against PLCβ1 (anti β1) and PLCβ3 (anti β3). Next, we tested the effect of these antisense oligonucleotides on the PtdIns(4,5)P2 levels. When cells were pre-incubated with control antisense oligonucleotides, followed by 25 μM MβCD-cholesterol treatment for 1 h, PtdIns(4,5)P2 levels were decreased by 18.2 ± 3.5% (n = 5; Fig. 9B), similar to the result in Figure 2F. In the presence of antisense oligonucleotide against PLCβ1, 25 μM MβCD-cholesterol decreased PtdIns(4,5)P2 levels only by 3.6 ± 1.3% (n = 5). In contrast, cholesterol decreased PtdIns(4,5)P2 levels by 10.2 ± 2.1% (n = 5) in the presence of antisense oligonucleotide against PLCβ3. Thus, inhibiting PLCβ1 expression, but not inhibiting PLCβ3 expression, completely prevented the effect of mild cholesterol enrichment on PtdIns(4,5)P2 levels. These results may suggest that the downregulation of PtdIns(4,5)P2 levels by cholesterol enrichment is specifically via the increased expression of PLCβ1.
Figure 9. Suppression of PLCβ1 expression prevents the effects of the mild membrane cholesterol enrichment on HERG channel. (A) The effect of the mild membrane cholesterol enrichment on PLCβ1 and PLCβ1 expression was blocked in the presence of antisense oligonucleotides directed against PLCβ1 and PLCβ3, respectively. Cells were incubated with or without 25 μM MβCD -soluble cholesterol for 1 h, and the expression levels of PLCβ1 and PLCβ3 were tested using western blotting. Before cholesterol enrichment, some cells were pre-treated with 10 μM antisense oligonucleotides for 2 h directed against PLCβ1 (anti β1) or PLCβ3 (anti β3). Similar results were obtained from four different experiments. Antisense oligonucleotides having no specific target were used for controls in all of experiments. (B) Anti β1 prevented the effect of cholesterol on PtdIns(4,5)P2 levels. Cells were incubated with anti β1 or anti β3 for 2 h and then incubated with or without 25 μM MβCD-cholesterol for the additional 1 h. PtdIns(4,5)P2 levels in the membrane were measured by using PtdIns(4,5)P2 ELISA kit. The effect of cholesterol on PtdIns(4,5)P2 levels was blocked in the presence of anti β1 (n = 5). However, anti β3 was not able to block the effect of cholesterol (n = 5). *p < 0.05; **p < 0.01 (C) The time course of HERG channel activation was analyzed from cells incubated with 25 μM MβCD-cholesterol for 1 h in the presence or in the absence of Anti β1 as described in Figure 5B. (D) The half times to maximal rise (τ1/2) were obtained by fitting the curves from the time course of HERG channel activation at different testing voltages.
Then, we tested the effect of mild cholesterol enrichment on HERG current activation in the presence of these antisense oligonucleotides. The activation was decelerated by 25 μM MβCD-cholesterol as expected (Fig. 9C), and the presence of Anti β1 prevented the effect of mild cholesterol enrichment completely (Chol+Anti β1). This was clearly demonstrated by comparing the half times to maximal rise of HERG channel, τ1/2, at different testing in Figure 9D. However, anti β3(Chol+Anti β3) or control antisense oligonucleotides (Chol+Cont Anti) were not able to prevent the effect of 25 μM MβCD-cholesterol. These results suggest that cholesterol enrichment specifically increased PLCβ1 expression, leading to a decelerated rate of HERG channel activation.
Discussion
Presently, cholesterol enrichment inhibited PtdIns(4,5)P2-sensitive HERG channels by downregulating PtdIns(4,5)P2 levels due to the activation of PLC. MβCD-cholesterol at 100 μM shifted the voltage-dependent activation curve to the depolarizing direction (Fig. 2B and D) and decelerated the time course of the activation (data not shown). On the other hand, 25 μM MβCD-cholesterol did not induce a shift of the voltage-dependent activation curve (Fig. 2B and D) while decelerating the time course of the activation (Fig. 5C and D). The effect of 25 μM MβCD-cholesterol could be explained solely by the downregulation of PtdIns(4,5)P2. This conclusion was supported by reversal of the effect of 25 μM MβCD-cholesterol by supplying PtdIns(4,5)P2 and by the presence of PLC inhibitor (Fig. 3C and D). In addition, the presence of anti-PtdIns(4,5)P2 antibody in intracellular pipette solution mimicked the effects of 25 μM MβCD-cholesterol on channel activation (Fig. 6A and B). These results show that the downregulation of PtdIns(4,5)P2 specifically decelerated the time course of the activation without affecting any other kinetic parameters of the channel. Our finding is consistent with previous results concerning the role of PtdIns(4,5)P2 on HERG channel, in which PtdIns(4,5)P2 accelerated the activation of HERG channel when it was dialyzed internally.11 On the other hand, the presence of anti-PtdIns(4,5)P2 antibody in whole-cell pipette solution produced the opposite effects of PtdIns(4,5)P2, which was reproduced in our study. The putative PtdIns(4,5)P2 binding domain containing a cluster of basic residues exists in the HERG channel C terminus.12 When this domain is deleted the effect of PtdIns(4,5)P2 is abolished.
We concluded that the increased PLCβ1 transcription by mild cholesterol enrichment induces the downregulation of PtdIns(4,5)P2 level, which causes the deceleration of HERG channel activation. Alternative interpretations are possible for the effect of cholesterol on HERG channel. Cholesterol may act directly on the channel in a manner that is antagonistic to PtdIns(4,5)P2, and its effects on PLC and PtdIns(4,5)P2 metabolism may be separate events. For this scenario, cholesterol should bind either to the same binding site as PtdIns(4,5)P2 or to another site that competitively interacts with the PtdIns(4,5)P2 binding site. Also, cholesterol may affect HERG channel independently of its effects on PLC by disrupting communication among HERG tetramers. This interpretation could explain the reduction of current density and the change of gating of HERG current by cholesterol. However, in our experiments, inhibiting PLCβ1 expression either by transcription inhibitor or by antisense oligonucleotides, specifically prevented the effect of cholesterol on PtdIns(4,5)P2 level as well as HERG channel. These results show an indispensible role of PLCβ1 linking cholesterol enrichment to the regulation of HERG channel.
Structural information for the regulation of HERG channel by PtdIns(4,5)P2 is currently unavailable. However, in the case of the classical inward rectifier (Kir2.2) K+ channel, PtdIns(4,5)P2 binds at an interface between the transmembrane domain and the cytoplasmic domain of the channel, affecting channel gating.20 In a previous report, cholesterol was depleted or loaded in HERG-transfected HEK293 cells.21 Voltage-dependent activation curve is shifted to the depolarizing direction in both conditions, and the fast component of deactivation of HERG current (τfast) is faster only in cholesterol-depleted cells. The time course of the activation, which was the most affected kinetic parameters in our hand, was not tested in their experiment. However, direct comparison of the results was not possible due to the difference in the way cells were enriched with cholesterol.
Since numerous drugs capable to block HERG channel causes LQTS,6 inhibition of HERG channel by mild cholesterol enrichment may be potential LQTS liability. However, the connection of hypercholesterolemia to LQTS is not reported yet. Similar to what we observed in HEK293 cells, we observed clear increase of PLCβ1 expression from the isolated rat heart cells by mild cholesterol enrichment (Fig. S3). Unfortunately, dissecting HERG current (IKr) from the various endogenous currents was almost impossible. Further studies will be needed for the pathophysiological significance of HERG channel regulation by cholesterol enrichment.
PtdIns(4,5)P2 has been implicated in many physiological functions, such as rearrangement of the cytoskeleton and membrane trafficking.10 There is growing evidence pointing to the role of PtdIns(4,5)P2 in the spatially selective regulation of the actin cytoskeleton and in plasma membrane-cytoskeleton interaction.22 Since PtdIns(4,5)P2 is enriched in cholesterol- and sphingolipid-rich rafts within the plasma membrane, partitioning of PtdIns(4,5)P2 into these rafts would provide the restricted signaling mechanism of local PtdIns(4,5)P2 hydrolysis by PLC.23,24 The concerted action of phosphoinositide kinases and phosphatases within this confined domain may maintain or regulate the steady-state level of PtdIns(4,5)P2. Since we demonstrated the existence of an important crosstalk between two plasma membrane-enriched lipids, cholesterol and PtdIns(4,5)P2, cholesterol may function as a regulatory factor for PtdIns(4,5)P2 levels via PLC activity in such specific microdomains. Very extensive studies are reviewed regarding structure, function and control of PLCβ1.25 However, the regulation of its expression by lipids such as cholesterol is not known. A recent report described the localization of PLCβ1 on detergent-resistant membrane microdomains from the synaptic plasma membrane fraction of rat brain.26 Interestingly, human Kv11.1 (hERG1) is localized in cholesterol and sphingolipid enriched membranes, and membrane cholesterol can modulate Kv11.1 channel.21 Since we showed that the increase of PLCβ1 expression, but not that of PLCβ3, affected the HERG channel, these results may indicate a close link between PLCβ1 and HERG channel activity. Further study is needed to elucidate the mechanism of specific regulation of HERG channel by PLCβ1.
The gating of HERG channel was found to be very similar to that of large conductance, Ca2+-activated K+ (BK) channel. BK channel is activated by membrane depolarization. At a given intracellular Ca2+ concentration [(Ca2+)i], depolarization opens the channel. Because BK channel is also a ligand-gated channel, the conductance-voltage (G-V) relationship of BK channel shifts to the hyperpolarizing directions by increasing (Ca2+)i.27 Thus, binding of the ligand, Ca2+, to its sensor facilitates the opening of the gate. However, the coupling between the gate and ligand sensors is arranged such that the BK channel may open even in the absence of the activation of sensors.28 Similar to BK channel, the activation rate of HERG channel is voltage dependent. At a given PtdIns(4,5)P2 level, HERG channel takes less time for the activation as membrane potential depolarizes (Fig. 5B). Thus, by analogy to G-V relationship of BK channel, “conductance-time (G-T)” relationship of HERG channel in Figure 5B shifts to the left as membrane potential depolarizes, which means a more rapid opening of the channel. In another analogy to (Ca2+)i of BK channel, PtdIns(4,5)P2 in HERG channel may act as a ligand. Downregulation of PtdIns(4,5)P2 level by mild enrichment of cholesterol slows the activation time of HERG channel at the same membrane potentials, shifting the G-T curve to the right (Fig. 5C and D). This result is consistent with the previous observations that the application of PtdIns(4,5)P2 accelerates HERG channel activation,11 and that PtdIns(4,5)P2 stabilizes the channel open state.29
Materials and Methods
Chemicals
All chemicals were purchased from Sigma-Aldrich, except for edelfosine (Calbiochem) and antibody against PtdIns(4,5)P2 (Santa Cruz Biotechnology). PtdIns(4,5)P2 acid was dissolved in pipette solutions for whole-cell recordings and sonicated for 10 min at ice-cold temperature just before use.
Cell culture
Stable HEK293 cells expressing HERG channel were obtained from Dr. Eckhard Ficker (Case Western Reserve University) and were maintained as described previously.30 To enrich the cells with cholesterol, we exposed them to Dulbecco’s modified Eagle’s medium (DMEM) containing cholesterol water-solubilized with methyl-β-cyclodextrin (MβCD-cholesterol) for 1–2 h. During the incubation, cells were maintained in a humidified CO2 incubator at 37 °C. In some experiments, cholesterol was solubilized using sonication to avoid the use of MβCD. For this purpose, cholesterol in methanol/chloroform mixture (1:1 v/v) was dried under nitrogen gas and sonicated for 2 min in DMEM.
Cholesterol enrichment of membrane
Cells were incubated for 1–2 h with MβCD-cholesterol. To confirm the changes of free cholesterol levels at the plasma membrane, filipin staining of cells (0.05%, dimethylsulfoxide 1%) was performed for 30 min at room temperature after cholesterol enrichment. Fluorescence images were obtained using a LSM 710 confocal microscope (Carl Zeiss) using a laser emission wavelength of 351 nm. Images were quantified to obtain the mean fluorescence density values of plasma membrane from the edge of the cell to 500 nm inside the cell using the Image J program. To obtain cell membrane enriched with cholesterol, cells were incubated for 1–2 h with MβCD-cholesterol. Then cells were washed twice with ice-cold phosphate-buffered saline and homogenized with a hypotonic buffer (10 mM TRIS-HCl, pH 7.5, 5 mM MgCl2, 2 mM EGTA, 25 mM β-glycerol phosphate, 5 mM sodium fluoride, 2 mM sodium pyrophosphate and 1 mM sodium orthovandate) using a 22-gauge needle. The samples were then centrifuged at 1,000 × g for 10 min to remove nuclei and cell debris. Membranes were pelleted from the post-nuclear supernatants by centrifugation for 1 h at 100,000 ×.
Electrophysiology
Patch pipettes were fabricated from borosilicate glass (TW150-4; World Precision Instrument) using a model P-97 Flaming/Brown micropipette puller (Sutter Instrument). Patch-clamp experiments were conducted in a standard whole-cell recording configuration at room temperature. Junction potentials were zeroed with the electrode in the standard bath solution. Currents were amplified using an Axopatch 1D patch-clamp amplifier (Axon Instruments). Data were analyzed using pClamp7 (Axon Instruments) and the Origin 6.0 program (OriginLab). To ensure the voltage-clamp quality, the electrode resistance was kept from 2.5 MΩ to 3.5 MΩ. Typical peak HERG currents were less than 1500 pA. For all experiments with individual cells, at least three independent batches of cells were used in different experimental days.
ELISA for PtdIns(4,5)P2
The amount of PtdIns(4,5)P2 extracted from HEK293 cells were measured by using PtdIns(4,5)P2 Mass ELISA kit (Echelon Biosciences). PtdIns(4,5)P2 was extracted from control or cholesterol-treated cell for 1 h. Cellular PtdIns(4,5)P2 quantities were estimated by comparing the values from standard curve, which showed linear relationship in the concentration range of 0.5–1000 pM.
Antisense oligonucleotides
The antisense oligonucleotides (IDT) targeting the PLCβ1 and PLCβ3 were designed to be complementary to the 5′ sequences, and were phosphorothionated at all positions to enhance their stability and to minimize intracellular cleavage by enzymes (5′-actccgggttgagccccggc-3′ for PLCβ1 and 5′-tccaactgcagcgcgtggac-3′ for PLCβ3). Antisense oligonucleotide (5′-gccccgtatgaccgcgccgg-3′) having no target was used as control. The cells were plated at a density of 2 × 10⁶ cells per 60 mm dish and then treated with the 10 μM antisense oligonucleotides for 2 h in serum-free DMEM. After treatment, the medium was replaced by a new medium containing 10 μM antisense oligonucleotides with or without water-soluble cholesterol for 1 h. Cells were homogenized to confirm PtdIns(4,5)P2 levels and PLC expression levels.
Western blot analysis
Equal amounts of protein for each sample were separated by SDS-PAGE and transferred to nitrocelluose membranes. After blocking in 5% nonfat milk for 1 h at room temperature, membranes were incubated with rabbit polyclonal anti-PLCβ1 (SC-9050), PLCβ3 (SC-13958), PLCγ2 (SC-9015), mouse monoclonal anti-PLCγ1 (SC-7290) antibodies (Santa Cruz Biotechnology) and rabbit anti β-tubulin (T2200; Sigma-Aldrich) overnight at 4 °C. After washing, membranes were incubated for 1 h at room temperature with horseradish peroxidase-conjugated goat anti-rabbit IgG (1:2000 dilution; Zymed) and washed. Peroxidase activity was visualized with enhanced chemiluminescence. Blots were quantified with the Multi Gauge software using a LAS-3000 system (Fugi Film).
RNA isolation and RT-PCR
RNA was harvested from HERG-transfected HEK293 cells incubated with 25 μM water-soluble cholesterol for 0.5 and 1 h using the RNeasy Mini kit (74104; Qiagen). RNA was quantitated and used in a semi-quantitative RT-PCR to synthesize cDNA (18080-051; Invitrogen). For amplification of the cDNA, primer for PLCβ1 (forward: AGCTCTCAGAACAAGCCTCCAACA, reverse: ATCATCGTCGTCGTCACTTTCCGT) and primer for PLCβ4 (forward: GCACAGCACACAAAGGAATGGTCA, reverse: CGCATTTCCTTGCTTTCCCTGTCA) were used. PCR amplification was performed by 35 cycles consisting of a denaturation at 94 °C for 30 sec, an annealing at 58 °C for 30 sec and an extension at 72 °C for 60 sec, and ended by terminal extension at 72 °C for 10 min.
Statistical analysis
Data are expressed as mean ± SEM. Statistical comparisons between controls and treated experimental groups were performed using the Student’s t test. p < 0.05 was considered statistically significant.
Supplementary Material
Acknowledgments
This work was supported by Samsung Biomedical Research Grant (B-A8-003) and the National Research Foundation of Korea (NRF) funded by the Ministry of Education, Science and Technology (2009-0072220) to S.C.
Glossary
Abbreviations:
- HERG
human ether-a-go-go-related gene
- IKr
rapidly activating delayed rectifier K+ conductance
- PIP2
phosphatidylinositol 4,5-bisphosphate
- PLC
phospholipase C
- HEK
human embryonic kidney
- LQTS
Long QT syndrome
- MβCD
methyl-β-cyclodextrin
- MβCD-cholesterol
MβCD saturated with cholesterol
- Act
actinomycin-D
- anti β1
antisense oligonucleotides against PLCβ1
- anti β3
antisense oligonucleotides against PLCβ3
Disclosure of Potential Conflicts of Interest
No potential conflicts of interest were disclosed.
Footnotes
Previously published online: www.landesbioscience.com/journals/channels/article/25122
References
- 1.Wang S, Liu S, Morales MJ, Strauss HC, Rasmusson RL. A quantitative analysis of the activation and inactivation kinetics of HERG expressed in Xenopus oocytes. J Physiol. 1997;502:45–60. doi: 10.1111/j.1469-7793.1997.045bl.x. [DOI] [PMC free article] [PubMed] [Google Scholar]
- 2.Zhou Z, Gong Q, Ye B, Fan Z, Makielski JC, Robertson GA, et al. Properties of HERG channels stably expressed in HEK 293 cells studied at physiological temperature. Biophys J. 1998;74:230–41. doi: 10.1016/S0006-3495(98)77782-3. [DOI] [PMC free article] [PubMed] [Google Scholar]
- 3.Spector PS, Curran ME, Zou A, Keating MT, Sanguinetti MC. Fast inactivation causes rectification of the IKr channel. J Gen Physiol. 1996;107:611–9. doi: 10.1085/jgp.107.5.611. [DOI] [PMC free article] [PubMed] [Google Scholar]
- 4.Bian JS, McDonald TV. Phosphatidylinositol 4,5-bisphosphate interactions with the HERG K(+) channel. Pflugers Arch. 2007;455:105–13. doi: 10.1007/s00424-007-0292-5. [DOI] [PubMed] [Google Scholar]
- 5.Vandenberg JI, Walker BD, Campbell TJ. HERG K+ channels: friend and foe. Trends Pharmacol Sci. 2001;22:240–6. doi: 10.1016/S0165-6147(00)01662-X. [DOI] [PubMed] [Google Scholar]
- 6.Brown AM. Drugs, hERG and sudden death. Cell Calcium. 2004;35:543–7. doi: 10.1016/j.ceca.2004.01.008. [DOI] [PubMed] [Google Scholar]
- 7.Emmi A, Wenzel HJ, Schwartzkroin PA, Taglialatela M, Castaldo P, Bianchi L, et al. Do glia have heart? Expression and functional role for ether-a-go-go currents in hippocampal astrocytes. J Neurosci. 2000;20:3915–25. doi: 10.1523/JNEUROSCI.20-10-03915.2000. [DOI] [PMC free article] [PubMed] [Google Scholar]
- 8.Sacco T, Bruno A, Wanke E, Tempia F. Functional roles of an ERG current isolated in cerebellar Purkinje neurons. J Neurophysiol. 2003;90:1817–28. doi: 10.1152/jn.00104.2003. [DOI] [PubMed] [Google Scholar]
- 9.Suh BC, Hille B. Regulation of ion channels by phosphatidylinositol 4,5-bisphosphate. Curr Opin Neurobiol. 2005;15:370–8. doi: 10.1016/j.conb.2005.05.005. [DOI] [PubMed] [Google Scholar]
- 10.Di Paolo G, De Camilli P. Phosphoinositides in cell regulation and membrane dynamics. Nature. 2006;443:651–7. doi: 10.1038/nature05185. [DOI] [PubMed] [Google Scholar]
- 11.Bian J, Cui J, McDonald TV. HERG K(+) channel activity is regulated by changes in phosphatidyl inositol 4,5-bisphosphate. Circ Res. 2001;89:1168–76. doi: 10.1161/hh2401.101375. [DOI] [PubMed] [Google Scholar]
- 12.Bian JS, Kagan A, McDonald TV. Molecular analysis of PIP2 regulation of HERG and IKr. Am J Physiol Heart Circ Physiol. 2004;287:H2154–63. doi: 10.1152/ajpheart.00120.2004. [DOI] [PubMed] [Google Scholar]
- 13.Chun YS, Shin S, Kim Y, Cho H, Park MK, Kim T-W, et al. Cholesterol modulates ion channels via down-regulation of phosphatidylinositol 4,5-bisphosphate. J Neurochem. 2010;112:1286–94. doi: 10.1111/j.1471-4159.2009.06545.x. [DOI] [PMC free article] [PubMed] [Google Scholar]
- 14.Christian AE, Haynes MP, Phillips MC, Rothblat GH. Use of cyclodextrins for manipulating cellular cholesterol content. J Lipid Res. 1997;38:2264–72. [PubMed] [Google Scholar]
- 15.Romanenko VG, Rothblat GH, Levitan I. Modulation of endothelial inward-rectifier K+ current by optical isomers of cholesterol. Biophys J. 2002;83:3211–22. doi: 10.1016/S0006-3495(02)75323-X. [DOI] [PMC free article] [PubMed] [Google Scholar]
- 16.Toselli M, Biella G, Taglietti V, Cazzaniga E, Parenti M. Caveolin-1 expression and membrane cholesterol content modulate N-type calcium channel activity in NG108-15 cells. Biophys J. 2005;89:2443–57. doi: 10.1529/biophysj.105.065623. [DOI] [PMC free article] [PubMed] [Google Scholar]
- 17.Smith PL, Baukrowitz T, Yellen G. The inward rectification mechanism of the HERG cardiac potassium channel. Nature. 1996;379:833–6. doi: 10.1038/379833a0. [DOI] [PubMed] [Google Scholar]
- 18.Chun YS, Oh HG, Park MK, Kim T-W, Chung S. Augmentation of membrane cholesterol level increases the amyloidogenic peptide by enhancing the expression of phospholipase C. J Neurodeg Dis. 2013 doi: 10.1155/2013/407903. in press. [DOI] [PMC free article] [PubMed] [Google Scholar]
- 19.Zidovetzki R, Levitan I. Use of cyclodextrins to manipulate plasma membrane cholesterol content: evidence, misconceptions and control strategies. Biochim Biophys Acta. 2007;1768:1311–24. doi: 10.1016/j.bbamem.2007.03.026. [DOI] [PMC free article] [PubMed] [Google Scholar]
- 20.Hansen SB, Tao X, MacKinnon R. Structural basis of PIP2 activation of the classical inward rectifier K+ channel Kir2.2. Nature. 2011;477:495–8. doi: 10.1038/nature10370. [DOI] [PMC free article] [PubMed] [Google Scholar]
- 21.Balijepalli RC, Delisle BP, Balijepalli SY, Foell JD, Slind JK, Kamp TJ, et al. Kv11.1 (ERG1) K+ channels localize in cholesterol and sphingolipid enriched membranes and are modulated by membrane cholesterol. Channels (Austin) 2007;1:263–72. doi: 10.4161/chan.4946. [DOI] [PubMed] [Google Scholar]
- 22.Janmey PA, Lindberg U. Cytoskeletal regulation: rich in lipids. Nat Rev Mol Cell Biol. 2004;5:658–66. doi: 10.1038/nrm1434. [DOI] [PubMed] [Google Scholar]
- 23.Pike LJ, Miller JM. Cholesterol depletion delocalizes phosphatidylinositol bisphosphate and inhibits hormone-stimulated phosphatidylinositol turnover. J Biol Chem. 1998;273:22298–304. doi: 10.1074/jbc.273.35.22298. [DOI] [PubMed] [Google Scholar]
- 24.Hur EM, Park YS, Lee BD, Jang IH, Kim HS, Kim TD, et al. Sensitization of epidermal growth factor-induced signaling by bradykinin is mediated by c-Src. Implications for a role of lipid microdomains. J Biol Chem. 2004;279:5852–60. doi: 10.1074/jbc.M311687200. [DOI] [PubMed] [Google Scholar]
- 25.Rebecchi MJ, Pentyala SN. Structure, function, and control of phosphoinositide-specific phospholipase C. Physiol Rev. 2000;80:1291–335. doi: 10.1152/physrev.2000.80.4.1291. [DOI] [PubMed] [Google Scholar]
- 26.Taguchi K, Kumanogoh H, Nakamura S, Maekawa S. Localization of phospholipase C beta 1 on the detergent-resistant membrane microdomain prepared from the synaptic plasma membrane fraction of rat brain. J Neurosci Res. 2007;85:1364–71. doi: 10.1002/jnr.21243. [DOI] [PubMed] [Google Scholar]
- 27.Cui J, Yang H, Lee US. Molecular mechanisms of BK channel activation. Cell Mol Life Sci. 2009;66:852–75. doi: 10.1007/s00018-008-8609-x. [DOI] [PMC free article] [PubMed] [Google Scholar]
- 28.Hou S, Heinemann SH, Hoshi T. Modulation of BKCa channel gating by endogenous signaling molecules. Physiology (Bethesda) 2009;24:26–35. doi: 10.1152/physiol.00032.2008. [DOI] [PMC free article] [PubMed] [Google Scholar]
- 29.Rodriguez N, Amarouch MY, Montnach J, Piron J, Labro AJ, Charpentier F, et al. Phosphatidylinositol-4,5-bisphosphate (PIP(2)) stabilizes the open pore conformation of the Kv11.1 (hERG) channel. Biophys J. 2010;99:1110–8. doi: 10.1016/j.bpj.2010.06.013. [DOI] [PMC free article] [PubMed] [Google Scholar]
- 30.Ficker E, Dennis AT, Wang L, Brown AM. Role of the cytosolic chaperones Hsp70 and Hsp90 in maturation of the cardiac potassium channel HERG. Circ Res. 2003;92:e87–100. doi: 10.1161/01.RES.0000079028.31393.15. [DOI] [PubMed] [Google Scholar]
Associated Data
This section collects any data citations, data availability statements, or supplementary materials included in this article.


