

Abstract
Adults with type 1 diabetes have lower serum uric acid levels compared with nondiabetic adults. Little is known about the relationship between serum uric acid and blood pressure in type 1 diabetes and whether it differs from the positive relationship found in nondiabetic adults. The authors assessed the cross‐sectional and longitudinal relationships over 6 years between serum uric acid and blood pressure in adults with (35±9 years [n=393]) and without (38±9 years [n=685]) type 1 diabetes in the Coronary Artery Calcification in Type 1 Diabetes study. In nondiabetic adults, serum uric acid was associated with systolic blood pressure in multivariable models adjusted for cardiovascular risk factors. In adults with type 1 diabetes, a negative association was observed between serum uric acid and systolic blood pressure after multivariable adjustments. A positive association was observed between serum uric acid and systolic blood pressure in nondiabetic adults. In contrast, an inverse relationship was demonstrated after multivariable adjustments in type 1 diabetes.
Hypertension is an important worldwide public health challenge and remains a leading cause of morbidity and mortality.1 The association between hyperuricemia and hypertension is well recognized in people without diabetes,2 and elevated serum uric acid (SUA) levels have been shown to predict the development of high blood pressure (BP).3, 4 SUA may contribute to increased BP by several mechanisms such as inflammatory and vascular changes in the renal microvasculature, increased renin expression, and endothelial dysfunction.5, 6 Furthermore, SUA has been associated with other cardiovascular risk factors including increased body mass index (BMI) and insulin resistance.7, 8, 9
SUA levels in adult patients with type 1 diabetes tend to be lower than in the general population but are still strongly related to development of diabetic kidney disease and cardiovascular disease.10, 11, 12, 13 The reduced SUA levels in patients with type 1 diabetes may also change the nature of the relationship between SUA and BP. Therefore, there is a need to better understand the association between SUA and BP in adults with and without type 1 diabetes.
The Coronary Artery Calcification in Type 1 Diabetes (CACTI) cohort, a longitudinal study of adults with type 1 diabetes designed to investigate the determinants of early and accelerated atherosclerosis in type 1 diabetes, provides us with an opportunity to examine the longitudinal relationship between SUA and BP in patients with and without type 1 diabetes. We hypothesized that SUA would be positively associated with BP cross‐sectionally and that SUA at baseline would predict progression of BP longitudinally over 6 years of follow‐up. Moreover, we predicted the relationship between SUA and BP would be stronger in nondiabetic patients than in patients with type 1 diabetes.
Methods
The CACTI study enrolled patients aged 19 to 56 years, with and without type 1 diabetes, who were asymptomatic for cardiovascular disease (CVD) at the baseline visit in 2000–2002 and were then re‐examined 3 and 6 years later, as previously described.14 Patients with serum creatinine >2 mg/dL, on therapy for gout and/or taking antihypertensive treatment were excluded at baseline. Of 1416 patients, 5 were excluded because of current treatment of gout and 333 (246 with type 1 diabetes) because of current antihypertensive treatment. The remaining patients with data available for uric acid and BP included in this analysis were 393 with type 1 diabetes and 685 nondiabetic controls. The study was approved by the Colorado Multiple Institutional Review Board and all participants provided informed consent.
Study participants who completed the baseline screening visit were asked to fill out a validated15 self‐administered food‐frequency questionnaire, from which we obtained sodium and protein intake (Harvard, 1988); 1306 study participants completed the questionnaire, as previously described in detail.16 We measured height and weight, and calculated BMI in kg/m2. Resting systolic BP (SBP) and fifth‐phase diastolic BP (DBP) were measured 3 times while the patient was seated, and the second and third measurements were averaged. Hypertension was defined as BP ≥140/90 mm Hg at the time of the study visit. Progression of BP was defined as a >1 step increase in the Seventh Report of the Joint National Committee on Prevention, Detection, Evaluation, and Treatment of High Blood Pressure (JNC 7) BP stage17 or going on antihypertension medication between visits. Antihypertension medication use was determined by a medication inventory as previously described.14
After an overnight fast, blood was collected, centrifuged, and separated. Plasma was stored at 4°C until assayed. SUA levels were measured on stored baseline samples via a clinical analyzer utilizing a uricase‐based commercial kit. These samples had been thawed twice in the past. The results were reported in milligrams per deciliter. Total plasma cholesterol and triglyceride levels were measured using standard enzymatic methods, high‐density lipoprotein cholesterol (HDL‐C) was separated using dextran sulfate and low‐density lipoprotein cholesterol (LDL‐C) was calculated using the Friedewald formula. High performance liquid chromatography was used to measure glycated hemoglobin (HbA1c) (high‐performance liquid chromatography VARIANT, BioRad, Hercules, CA).
Glomerular filtration rate (GFR) (mL/min/1.73 m2) was determined using the Chronic Kidney Disease Epidemiology Collaboration (CKD‐EPI) serum cystatin C formula.18 Cystatin C was measured in the University of Colorado Hospital clinical laboratoy using the commercially available Dade‐Behring assay following package insert instructions on a BNII or Prospec instrument as previously described in detail.19 Serum creatinine was measured according to package insert instructions using a Roche Mira Plus II analyzer until 2006 and then an Olympus AU400e (r=0.9999 between methodologies) traceable to the National Institutes of Standards and Technology Standard Reference Material in the University of Colorado Clinical Translational Research (CTRC) laboratory as previously described.19 Two timed overnight urine samples were collected in duplicate and urine creatinine and albumin were measured and averaged.
Statistical Analysis
Analyses were performed using SAS software (version 9.3 for Windows; SAS Institute, Cary, NC). Differences between patients with type 1 diabetes and healthy control patients were assessed using chi‐square for categorical variables and t test for continuous variables. Non‐normally distributed variables (eg, SUA and serum creatinine) were log‐transformed. Linear regression and analysis of covariance were employed to fit 3 models with baseline LnSUA as a continuous predictor and then quartiles of LnSUA as categorical predictors of SBP and DBP and BP progression: unadjusted model, model 1 adjusted for age, sex, race; model 2(a) adjusted for model 1 plus Ln serum creatinine (LnSCR); model 2(b) adjusted for model 1 plus Ln albumin‐creatinine ratio (LnACR), model 3 adjusted for model 2(a) plus waist circumference, smoking status; and model 4 adjusted for model 3 plus HbA1c and sodium intake. Since SUA concentrations are affected by GFR, we further evaluated the independence of the association of SUA to SBP/DBP by adjusting for estimated GFR (eGFR) calculated by CKD‐EPI cystatin C in place of LnSCR, as the agreement between cystatin C and creatinine in eGFR has been reported to be as low as 62% in patients with type 1 diabetes.20
To explore the longitudinal association between baseline SUA and BP progression in CACTI, we employed ordinal logistic regression. BP status was defined ordinally as follows per JNC 7: SBP <120 mm Hg and DBP <80 mm Hg then group=0, if SBP ≥120 mm Hg or DBP ≥80 mm Hg then group=1, if SBP ≥130 mm Hg or DBP ≥85 mm Hg then group=2, and if SBP ≥140 mm Hg or DBP ≥90 mm Hg then group=3.17 Progression of BP was defined as a >1 step increase in JNC 7 stage or going on antihypertension medication between visits. All analyses were stratified by type 1 diabetes status, as there was an interaction between SUA and type 1 diabetes, and significance was based on an α level of 0.05.
Results
Adults with type 1 diabetes had higher HbA1c and triglyceride levels and lower total cholesterol, LDL‐C, SUA, and DBP levels (Table 1) than controls. Adults with and without type 1 diabetes had mean SBPs and DBPs within the normal range at baseline (114/77 mm Hg vs 113/78 mm Hg) and follow‐up (116/74 mm Hg vs 115/78 mm Hg) (Figure). The proportion of adults with clinical hypertension (BP ≥140/90 mm Hg not taking antihypertensive medications) was similar among those with and without type 1 diabetes at baseline (Table 1).
Table 1.
Patient Characteristics
| Type 1 Diabetes (n=393) | Controls (n=685) | P Value | |
|---|---|---|---|
| Age, y | 35±9 | 38±9.0 | <.0001 |
| Female sex, No. (%) | 223 (56.7%) | 342 (49.9%) | .03 |
| Diabetes duration, y | 22±9 | – | – |
| HbA1c, % | 7.9±1.2 | 5.5±0.4 | <.0001 |
| Waist circumference, cm | 83±12 | 85±14 | .10 |
| Cholesterol, mg/dL | 175±35 | 190±38 | <.0001 |
| LDL, mg/dL | 100±30 | 115±33 | <.0001 |
| HDL, mg/dL | 57±17 | 51±15 | <.0001 |
| Triglycerides, mg/dL | 90±59 | 125±92 | <.0001 |
| SUA at baseline, mg/dL | 4.86±1.00 | 5.72±1.35 | <.0001 |
| SBP at baseline, mm Hg | 114±12 | 113±12 | .30 |
| DBP at baseline, mm Hg | 77±8 | 78±8 | .01 |
| SBP at follow‐up, mm Hg | 116±14 | 115±12 | .14 |
| DBP at follow‐up, mm Hg | 74±9 | 78±9 | .0001 |
| eGFR cystatin C, mL/min/1.73 m2/y | 112.7±13.9 | 109.4±12.1 | .0002 |
| Sodium intake | 1975±970 | 1847±795 | .03 |
| Log‐ACR | 1.90±1.1 | 1.44±0.59 | <.0001 |
| LnSCR | 0.12±0.14 | 0.16±0.14 | <.0001 |
| Hypertension, No. (%)a | 35 (8.91) | 59 (8.61) | .87 |
| Hypertension at 6 years, No. (%)b | 119 (34.9) | 105 (18.6) | .0001 |
Abbreviations: ACR, albumin‐creatinine ratio; DBP, diastolic blood pressure; eGFR, estimated glomerular filtration rate; HbA1c, glycated hemoglobin; HDL, high‐density lipoprotein; LDL, low‐density lipoprotein; LnSCR, serum creatinine; SBP, systolic blood pressure; SUA, serum uric acid.
Hypertension was defined as untreated hypertension (blood pressure ≥140/90 mm Hg).
Hypertension was defined as untreated hypertension or current antihypertensive therapy.
Figure .
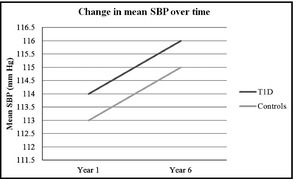
Change in systolic blood pressure (SBP) in adults with and without type 1 diabetes over time.
Cross‐sectionally, there was a relationship between SUA and SBP in control patients in all models: model 1 (β±standard error [SE]: 12.1±2.3 per 1.0 mg/dL of SUA, P<.0001), model 2(a) (β±SE: 12.0±2.4, P<.0001), model 2(b) (β±SE: 11.7±2.3, P<.0001), model 3 (β±SE: 5.4±2.5, P=.03), and model 4 (β±SE: 5.4±2.6, P=.04) (Table 2). This suggests that in the fully adjusted model, a natural log increase in SUA (equivalent to approximately 2.72 mg/dL) was associated with an increase in SBP by 5.4±2.6 mm Hg. When replacing serum creatinine with eGFRCYSTATIN C in the fully adjusted model the association between SUA and SBP became attenuated (β±SE: =5.1±2.6, P=.052). To further test the independence, we adjusted models with LnSUA, age, sex, race, and LnACR for the following additional variables or set of variables, respectively: LDL‐C, HDL‐C, and triglycerides (P=.0001) and BMI (P=.02), which did not significantly change the associations between SUA and SBP. In contrast, additional adjustment for visceral fat attenuated the significance of the association between SUA and SBP (P=.07). The pattern was similar for DBP with model 1, 2(a), and 2(b), but was no longer significant when adjusting for waist circumference, smoking status, sodium intake, and HbA1c (models 3 and 4).
Table 2.
Regression of SBP and DBP on LnSUA in Adults With and Without Type 1 Diabetes
| Regression Models | SBP | DBP | ||
|---|---|---|---|---|
| βa±SE | P Value | βa±SE | P Value | |
| Controls | ||||
| Model 1: age, sex, race, LnSUA | 12.08±2.32 | <.0001 | 7.45±1.58 | <.0001 |
| Model 2(a): model 1+Ln serum creatinine | 11.96±2.35 | <.0001 | 7.16±1.60 | <.0001 |
| Model 2(b): model 1+LnACR | 11.70±2.33 | <.0001 | 7.41±1.61 | <.0001 |
| Model 3: model 2(a)+waist circumference and current smoking status | 5.35±2.50 | .03 | 2.18±1.69 | .19 |
| Model 4: model 3+HbA1c and sodium intake | 5.42±2.60 | .04 | 2.18±1.74 | .21 |
| Type 1 diabetes | ||||
| Model 1: age, sex, race, LnSUA | −4.82±3.44 | .16 | 2.60±2.34 | .27 |
| Model 2(a): model 1+Ln serum creatinine | −4.45±3.58 | .21 | 3.24±2.44 | .18 |
| Model 2(b): model 1+LnACR | −7.75±3.72 | .04 | 0.66±2.55 | .79 |
| Model 3: model 2(a)+waist circumference and current smoking status | −7.22±3.62 | .05 | 1.40±2.46 | .57 |
| Model 4: model 3+HbA1c and sodium intake | −8.64±4.05 | .03 | 2.27±2.77 | .42 |
Abbreviations: ACR, albumin‐creatinine ratio; HbA1c, glycated hemoglobin; SE, standard error; SUA, serum uric acid.
β‐coefficient represents the difference in systolic blood pressure (SBP) or diastolic blood pressure (DBP) for every 1‐unit difference in the independent variable.
Cross‐sectionally, in patients with type 1 diabetes, there was no relationship between SUA and SBP in model 1 (β±SE: −4.82±3.44 P=.16) and model 2(a) (β=−4.45±3.58, P=.21), but, in the additional models, significant negative associations between SUA and SBP became evident; model 2(b) (β±SE: −7.8±3.7, P=.04), model 3 (β±SE: −7.2±3.6, P=.047), and model 4 (β±SE: −8.6±4.0, P=.03) (Table 2). Moreover, the associations remained significant when adjusting for eGFRCYSTATIN C in place of serum creatinine in the fully adjusted models (β±SE: −7.9±3.8, P=.04). To further test independence, we adjusted models with LnSUA, age, sex, race, and LnACR for the following additional variables or set of variables, respectively: LDL‐C, HDL‐C, and triglycerides (P=.03), BMI (P=.004), and visceral fat (P=.02), which did not significantly change the associations between SUA and SBP. None of the models regressed on DBP showed a significant association with LnSUA in adults with type 1 diabetes.
Progression of BP Stage
Progression in BP or initiation of antihypertensive medications occurred in 349 (39.5%) of all participants. In controls, the fourth compared with the first quartile of SUA was associated with higher odds for progression of BP after adjusting for age, sex, and race in model 1 (odds ratio [OR], 2.1; 95% confidence interval [CI], 1.32–3.30; P=.002), Ln serum creatinine in model 2(a) (OR, 2.0; 95% CI, 1.28–3.20; P=.003) and LnACR in model 2(b) (OR, 1.9; 95% CI, 1.22–3.08; P=.005), but was not significant after adjusting for waist circumference, smoking status, sodium intake, and HbA1c in models 3 and 4. The fourth quartile of SUA was not related to progression of BP in any of the models in patients with type 1 diabetes (Table 3).
Table 3.
Ordinal Logistic Regression of Hypertensive Status on the Fourth Quartile of SUA Compared With the First Quartile in Adults With and Without Type 1 Diabetes
| Logistic Regression Models | OR (95% CI) | P Value |
|---|---|---|
| Controls | ||
| Model 1: age, sex, race, LnSUA | 2.09 (1.32–3.29) | .002 |
| Model 2(a): model 1+Ln serum creatinine | 2.02 (1.28–3.20) | .003 |
| Model 2(b): model 1+LnACR | 1.93 (1.22–3.08) | .005 |
| Model 3: model 2(a)+waist circumference and current smoking status | 1.23 (0.75–2.02) | .42 |
| Model 4: model 3+HbA1c+sodium intake | 1.23 (0.75–2.02) | .42 |
| Type 1 diabetes | ||
| Model 1: age, sex, race, LnSUA | 1.13 (0.56–2.29) | .73 |
| Model 2(a): model 1+Ln serum creatinine | 1.21 (0.59–2.50) | .60 |
| Model 2(b): model 1+LnACR | 0.72 (0.33–1.57) | .41 |
| Model 3: model 2(a)+waist circumference and current smoking status | 0.99 (0.47–2.08) | .97 |
| Model 4: model 3+HbA1c+sodium intake | 0.99 (0.47–2.08) | .97 |
Abbreviations: ACR, albumin‐creatinine ratio; CI, confidence interval; HbA1c, glycated hemoglobin; OR, odds ratio; SUA, serum uric acid.
Discussion
We demonstrated independent relationships between SUA and BP at baseline and with progression of BP stages over 6 years in nondiabetic adults, which is consistent with existing data.4, 21 In contrast, SUA was not associated with BP in adults with type 1 diabetes in univariate analysis. However, we reported an unexpected inverse association between SUA and SBP in adults with type 1 diabetes after multivariable adjustments. This unexpected observation suggests that the relationship between SUA and BP may differ in people with type 1 diabetes. Levels of SUA in patients with type 1 diabetes are lower than in nondiabetic adults, which may change the nature of the relationship between SUA and BP. This is, to our knowledge, the first study exploring the relationship between SUA and BP in adults with type 1 diabetes.
There is evidence that supports SUA in the causation of hypertension in nondiabetic patients, but it is not a recent discovery and not without controversy. SUA was first related to primary hypertension in the 19th century.22, 23 During the past decade, there has been increasing evidence suggesting SUA is likely a causal contributor to hypertension.4, 21 More recently, a study of 6036 adolescents (aged 12–17 years) from the National Health and Nutrition Examination Survey (1999–2006) found that an SUA level >5.5 mg/dL carries a 2‐fold greater risk for having hypertension.2 Lowering SUA with either allopurinol or probenacid has been shown to markedly reduce BP in pilot studies of adolescents with hypertension or prehypertension,24, 25 whereas effects on adults with primary hypertension are less prominent.26, 27
Experimental studies suggest that SUA might play a role in initiating the development of hypertension through multiple mechanisms, including induction of oxidative stress, activation of renin‐angiotensin system (RAS) and inhibition of nitric oxide via oxidants. A plausible common pathway for the above mechanisms is the development of renal arteriolar disease with interstitial macrophage and T‐cell infiltration,28, 29, 30 eventually leading to renal vasoconstriction and ischemia.31, 32 There are also studies that suggest SUA may not play a role in hypertension.33, 34 One of the strongest arguments is based on gene wide association studies (GWAS), which have been able to link polymorphisms in urate transporters with hyperuricemia and gout but not hypertension.35 One proposed explanation for this discordance is that SUA may not be the critical determinant of hypertension, but rather intracellular uric acid may be the key factor, and this may be dissociated from SUA in the various GWAS studies.36 Interestingly, Kosugi and colleagues37 showed in type 2 diabetic mice with normal to low SUA levels that allopurinol administration lowered BP, suggesting that intracellular uric acid rather than extracellular uric acid (eg, SUA) might be driving the pathogenesis of increased BP in diabetes.
We do not yet fully understand the paradoxical relationship between SUA and SBP in type 1 diabetes, and our observational, longitudinal data should be considered hypothesis‐generating. The reason the association between SUA and SBP is not statistically significant in univariate analysis and becomes significant after multivariable adjustments is likely caused by clustering according to a covariate. Moreover, over time the fourth quartile of SUA in patients with type 1 diabetes decreased compared with the first, second, and third quartiles, which may explain why we did not observe an increased odds of progression of BP stages over time in our ordinal logistic regression models for this group. Furthermore, we know from past research in patients with type 1 diabetes in CACTI that there was an overall trend of improvement in estimated insulin sensitivity from baseline to 6‐year follow‐up, which could confound the longitudinal association between SUA and progression of BP stages.38 Under most conditions, an elevated SUA is in equilibrium with intracellular levels, and hence elevated SUA reflects a high intracellular level. However, one confounding aspect is that SUA levels are known to fall in diabetic patients, as glycosuria can lead to proximal tubular dysfunction and uricosuria.39 SUA levels have also been reported to be higher in those with better diabetes control.40 For that reason, SUA may actually decrease in diabetic patients, especially if they are poorly controlled, despite high intracellular levels. Thus, one possible mechanism is that patients with poor glycemic control may have reduced SUA levels, which could alter the SUA‐BP relationship. In our multivariable model, however, adjusting for HbA1c did not change the relationship between SUA and BP.
One hypothesis is that a positive relationship between SUA and BP in type 1 diabetes may only manifest once eGFR <60 mL/min/1.73 m2 and SUA becomes elevated. Our study does not have the power to explore this hypothesis as participants with type 1 diabetes had lower SUA concentrations and higher eGFR than nondiabetic controls. Another hypothesis is that SUA may not be driving the BP progression in type 1 diabetes. One could also speculate that in type 1 diabetes, the pathway by which SUA induces vascular dysfunction in nondiabetic patients is altered. However, this is not consistent with recent data that demonstrated that SUA predicted endothelial dysfunction in type 1 diabetes,11 but in agreement with a study performed by Waring and colleagues33 that demonstrated improved endothelial function in type 1 diabetes with uric acid administration. We clearly need more studies to address mechanistic differences among patients with and without type 1 diabetes, to dissect the pathways explaining the paradoxical relationship between SUA and BP in type 1 diabetes. Exploring this difference might also provide important mechanistic data on the link between SUA and BP in nondiabetic patients. The longitudinal relationship between SUA and SBP in nondiabetic adults remained significant after adjusting for age, sex, race, and serum creatinine, but dissipated after adjusting for waist circumference and smoking status. We have demonstrated in the same cohort that SUA is associated with insulin sensitivity both cross‐sectionally and longitudinally in nondiabetic adults.9 For that reason, one could argue that adjusting for waist circumference, a strong surrogate marker of insulin sensitivity, masks one possible mechanism whereby SUA can predict BP progression in nondiabetic adults. In contrast, in adults with type 1 diabetes, we reported a very weak association between SUA and insulin sensitivity cross‐sectionally and no longitudinal relationship.9
Study Limitations
The limitations of our study also deserve comment, including the observational design. We examined the association of SUA at baseline with progression of BP. BP progression was defined as ≥1 step increase in JNC stage17 or going on antihypertension medication. We acknowledge that the latter definition presents a limitation of our study, as other indications including renal protection for microalbuminuria exist for antihypertensive medications in type 1 diabetes. Moreover, having only 2 (V1–V3) snapshots of medication use over 6 years is another limitation. The participants with type 1 diabetes taking antihypertensive medication (n=246) at baseline who were excluded from the analysis had higher BP and lipid panels and this may bias our results to the null as fewer healthy patients with type 1 diabetes were not included in the analyses. Although we adjusted for a variety of important confounding variables of hypertension, we cannot rule out the presence of unknown risk factors of uric acid metabolism that may have biased or confounded the present analyses. Furthermore, results from this study may not be generalizable to younger or older patients with type 1 diabetes and especially those with overt diabetic nephropathy, as our cohort consisted of adults with a mean age of 35±9 years with mean BP and eGFR within the normal ranges.
Conclusions
Our data provide further evidence that SUA may play a role in driving hypertension in adult nondiabetic patients, but, more importantly, we display a novel inverse relationship between SUA and SBP after multivariable adjustments in adults with type 1 diabetes. Further research is required to better understand why the relationship is different in patients with type 1 diabetes and also explore the evolution of the relationship over time and across different age groups.
Disclosures
Drs Bjornstad, Wadwa, Sirota, Snell‐Bergeon, McFann, Rewers, Rivard, Jalal, Chonchol, and Maahs have no conflicts of interest to disclose. Dr Johnson has patent applications related to the lowering of uric acid and or blocking fructose metabolism as a means for slowing diabetic nephropathy or improving insulin resistance, and has shares with XORT Therapeutics related to these patents.
Author Contributions
PB researched, wrote, contributed to discussion, and reviewed/edited the manuscript; RPW researched, contributed to the discussion, reviewed/edited the manuscript; JCS contributed to the discussion, reviewed/edited the manuscript; JKSB researched, contributed to the discussion, reviewed/edited the manuscript; KM analyzed data, contributed to discussion and reviewed/edited the manuscript; MR designed the CACTI study, researched, contributed to the discussion, and reviewed/edited the manuscript; CJR was responsible for the laboratory analyses, contributed to the discussion, and reviewed/edited the manuscript; DJ contributed to the discussion and reviewed/edited the manuscript; MC contributed to the discussion and reviewed/edited the manuscript; RJJ contributed to the discussion and reviewed/edited the manuscript; DMM researched, contributed to discussion, and reviewed/edited the manuscript.
Acknowledgments
Support for this study was provided by NHLBI grant R01 HL61753, HL79611, and DERC Clinical Investigation Core P30 DK57516. The study was performed at the Adult CTRC at UCD support by NIH‐M01‐RR00051, at the Barbara Davis Center for Childhood Diabetes, and at Colorado Heart Imaging Center in Denver, CO. Dr Maahs was supported by a JDRF cardio‐renal grant and Dr Snell‐Bergeon by an American Diabetes Association Junior Faculty Award (1‐10‐JF‐50). RJJ has patent applications related to the lowering of uric acid and or blocking fructose metabolism as a means for slowing diabetic nephropathy or improving insulin resistance, and has shares with XORT Therapeutics related to these patents. Drs Bjornstad, Wadwa, Sirota, Snell‐Bergeon, McFann, Rewers, Rivard, Jalal, Chonchol, and Maahs have no conflict of interest to disclose.
Drs David M Maahs, Janet Snell‐Bergeon, Kim McFann, and Petter Bjornstad are the guarantors of this work and, as such, had full access to all the data in the study and take responsibility for the integrity of the data and the accuracy of the data analysis.
J Clin Hypertens (Greenwich). 2014:283–288. DOI: 10.1111/jch.12305. ©2014 Wiley Periodicals, Inc.
References
- 1. Egan BM, Zhao Y, Axon RN. US trends in prevalence, awareness, treatment, and control of hypertension, 1988‐2008. JAMA. 2010;303:2043–2050. [DOI] [PubMed] [Google Scholar]
- 2. Loeffler LF, Navas‐Acien A, Brady TM, et al. Uric acid level and elevated blood pressure in US adolescents: National Health and Nutrition Examination Survey, 1999‐2006. Hypertension. 2012;59:811–817. [DOI] [PMC free article] [PubMed] [Google Scholar]
- 3. Perlstein TS, Gumieniak O, Williams GH, et al. Uric acid and the development of hypertension: the normative aging study. Hypertension. 2006;48:1031–1036. [DOI] [PubMed] [Google Scholar]
- 4. Mellen PB, Bleyer AJ, Erlinger TP, et al. Serum uric acid predicts incident hypertension in a biethnic cohort: the atherosclerosis risk in communities study. Hypertension. 2006;48:1037–1042. [DOI] [PubMed] [Google Scholar]
- 5. Johnson RJ, Segal MS, Srinivas T, et al. Essential hypertension, progressive renal disease, and uric acid: a pathogenetic link? J Am Soc Nephrol. 2005;16:1909–1919. [DOI] [PubMed] [Google Scholar]
- 6. Feig DI, Madero M, Jalal DI, et al. Uric acid and the origins of hypertension. J Pediatr. 2013;162:896–902. [DOI] [PMC free article] [PubMed] [Google Scholar]
- 7. Lanaspa MA, Sanchez‐Lozada LG, Cicerchi C, et al. Uric acid stimulates fructokinase and accelerates fructose metabolism in the development of fatty liver. PLoS ONE. 2012;7:e47948. [DOI] [PMC free article] [PubMed] [Google Scholar]
- 8. Perez‐Pozo SE, Schold J, Nakagawa T, et al. Excessive fructose intake induces the features of metabolic syndrome in healthy adult men: role of uric acid in the hypertensive response. Int J Obes (Lond). 2010;34:454–461. [DOI] [PubMed] [Google Scholar]
- 9. Bjornstad P, Snell‐Bergeon JK, McFann K, et al. Serum uric acid and insulin sensitivity in adolescents and adults with and without type 1 diabetes. J Diabetes Complications. 2013 Dec 27. [Epub ahead of print] [DOI] [PMC free article] [PubMed] [Google Scholar]
- 10. Jalal DI, Rivard CJ, Johnson RJ, et al. Serum uric acid levels predict the development of albuminuria over 6 years in patients with type 1 diabetes: findings from the Coronary Artery Calcification in Type 1 Diabetes study. Nephrol Dial Transplant. 2010;25:1865–1869. [DOI] [PMC free article] [PubMed] [Google Scholar]
- 11. Rodrigues TC, Maahs DM, Johnson RJ, et al. Serum uric acid predicts progression of subclinical coronary atherosclerosis in individuals without renal disease. Diabetes Care. 2010;33:2471–2473. [DOI] [PMC free article] [PubMed] [Google Scholar]
- 12. Erdberg A, Boner G, van Dyk DJ, Carel R. Urine uric acid excretion in patients with insulin‐dependent diabetes mellitus. Nephron. 1992;60:134–137. [DOI] [PubMed] [Google Scholar]
- 13. Hovind P, Rossing P, Tarnow L, et al. Serum uric acid as a predictor for development of diabetic nephropathy in type 1 diabetes: an inception cohort study. Diabetes. 2009;58:1668–1671. [DOI] [PMC free article] [PubMed] [Google Scholar]
- 14. Maahs DM, Kinney GL, Wadwa P, et al. Hypertension prevalence, awareness, treatment, and control in an adult type 1 diabetes population and a comparable general population. Diabetes Care. 2005;28:301–306. [DOI] [PubMed] [Google Scholar]
- 15. Rimm EB, Giovannucci EL, Stampfer MJ, et al. Reproducibility and validity of an expanded self‐administered semiquantitative food frequency questionnaire among male health professionals. Am J Epidemiol. 1992;135:1114–1126. [DOI] [PubMed] [Google Scholar]
- 16. Snell‐Bergeon JK, Chartier‐Logan C, Maahs DM, et al. Adults with type 1 diabetes eat a high‐fat atherogenic diet that is associated with coronary artery calcium. Diabetologia. 2009;52:801–809. [DOI] [PMC free article] [PubMed] [Google Scholar]
- 17. Chobanian AV, Bakris GL, Black HR, et al. The Seventh Report of the Joint National Committee on Prevention, Detection, Evaluation, and Treatment of High Blood Pressure: the JNC 7 report. JAMA. 2003;289:2560–2572. [DOI] [PubMed] [Google Scholar]
- 18. Inker LA, Schmid CH, Tighiouart H, et al. Estimating glomerular filtration rate from serum creatinine and cystatin C. N Engl J Med. 2012;367:20–29. [DOI] [PMC free article] [PubMed] [Google Scholar]
- 19. Maahs DM, Jalal D, McFann K, et al. Systematic shifts in cystatin C between 2006 and 2010. Clin J Am Soc Nephrol. 2011;6:1952–1955. [DOI] [PMC free article] [PubMed] [Google Scholar]
- 20. Krolewski AS, Warram JH, Forsblom C, et al. Serum concentration of cystatin C and risk of end‐stage renal disease in diabetes. Diabetes Care. 2012;35:2311–2316. [DOI] [PMC free article] [PubMed] [Google Scholar]
- 21. Alper AB Jr, Chen W, Yau L, et al. Childhood uric acid predicts adult blood pressure: the Bogalusa Heart Study. Hypertension. 2005;45:34–38. [DOI] [PubMed] [Google Scholar]
- 22. Mahomed FA. The etiology of bright's disease and the prealbuminuric stage. Med Chir Trans. 1874;57:197–228. [DOI] [PMC free article] [PubMed] [Google Scholar]
- 23. Haig A. On uric acid and arterial tension. Br Med J. 1889;1:288–291. [DOI] [PMC free article] [PubMed] [Google Scholar]
- 24. Feig DI, Soletsky B, Johnson RJ. Effect of allopurinol on blood pressure of adolescents with newly diagnosed essential hypertension: a randomized trial. JAMA. 2008;300:924–932. [DOI] [PMC free article] [PubMed] [Google Scholar]
- 25. Soletsky B, Feig DI. Uric acid reduction rectifies prehypertension in obese adolescents. Hypertension. 2012;60:1148–1156. [DOI] [PubMed] [Google Scholar]
- 26. Kanbay M, Ozkara A, Selcoki Y, et al. Effect of treatment of hyperuricemia with allopurinol on blood pressure, creatinine clearence, and proteinuria in patients with normal renal functions. Int Urol Nephrol. 2007;39:1227–1233. [DOI] [PubMed] [Google Scholar]
- 27. Kanbay M, Huddam B, Azak A, et al. A randomized study of allopurinol on endothelial function and estimated glomular filtration rate in asymptomatic hyperuricemic subjects with normal renal function. Clin J Am Soc Nephrol. 2011;6:1887–1894. [DOI] [PMC free article] [PubMed] [Google Scholar]
- 28. Eraranta A, Kurra V, Tahvanainen AM, et al. Oxonic acid‐induced hyperuricemia elevates plasma aldosterone in experimental renal insufficiency. J Hypertens. 2008;26:1661–1668. [DOI] [PubMed] [Google Scholar]
- 29. Mazzali M, Kanellis J, Han L, et al. Hyperuricemia induces a primary renal arteriolopathy in rats by a blood pressure‐independent mechanism. Am J Physiol Renal Physiol. 2002;282:F991–F997. [DOI] [PubMed] [Google Scholar]
- 30. Feig DI, Nakagawa T, Karumanchi SA, et al. Hypothesis: uric acid, nephron number, and the pathogenesis of essential hypertension. Kidney Int. 2004;66:281–287. [DOI] [PubMed] [Google Scholar]
- 31. Rodriguez‐Iturbe B, Johnson RJ. The role of renal microvascular disease and interstitial inflammation in salt‐sensitive hypertension. Hypertens Res. 2010;33:975–980. [DOI] [PubMed] [Google Scholar]
- 32. Watanabe S, Kang DH, Feng L, et al. Uric acid, hominoid evolution, and the pathogenesis of salt‐sensitivity. Hypertension. 2002;40:355–360. [DOI] [PubMed] [Google Scholar]
- 33. Waring WS, McKnight JA, Webb DJ, Maxwell SR. Uric acid restores endothelial function in patients with type 1 diabetes and regular smokers. Diabetes. 2006;55:3127–3132. [DOI] [PubMed] [Google Scholar]
- 34. George J, Carr E, Davies J, et al. High‐dose allopurinol improves endothelial function by profoundly reducing vascular oxidative stress and not by lowering uric acid. Circulation. 2006;114:2508–2516. [DOI] [PubMed] [Google Scholar]
- 35. Yang Q, Kottgen A, Dehghan A, et al. Multiple genetic loci influence serum urate levels and their relationship with gout and cardiovascular disease risk factors. Cir Cardiovasc Genet. 2010;3:523–530. [DOI] [PMC free article] [PubMed] [Google Scholar]
- 36. Johnson RJ, Sanchez‐Lozada LG, Mazzali M, et al. What are the key arguments against uric acid as a true risk factor for hypertension? Hypertension. 2013;61:948–951. [DOI] [PubMed] [Google Scholar]
- 37. Kosugi T, Nakayama T, Heinig M, et al. Effect of lowering uric acid on renal disease in the type 2 diabetic db/db mice. Am J Physiol Renal Physiol. 2009;297:F481–F488. [DOI] [PMC free article] [PubMed] [Google Scholar]
- 38. Bjornstad P, Snell‐Bergeon JK, Rewers M, et al. Early diabetic nephropathy: a complication of reduced insulin sensitivity in type 1 diabetes. Diabetes Care. 2013;36:3678–3683. [DOI] [PMC free article] [PubMed] [Google Scholar]
- 39. Bingham C, Ellard S, Nicholls AJ, et al. The generalized aminoaciduria seen in patients with hepatocyte nuclear factor‐1alpha mutations is a feature of all patients with diabetes and is associated with glucosuria. Diabetes. 2001;50:2047–2052. [DOI] [PubMed] [Google Scholar]
- 40. Tuomilehto J, Zimmet P, Wolf E, et al. Plasma uric acid level and its association with diabetes mellitus and some biologic parameters in a biracial population of Fiji. Am J Epidemiol. 1988;127:321–336. [DOI] [PubMed] [Google Scholar]