

Abstract
Background/Objectives
To examine the relationships of plasma and tissue markers of systemic and vascular inflammation to obesity and insulin resistance and determine the effects of aerobic exercise training+weight loss (AEX+WL) and weight loss (WL) on these biomarkers.
Design
Prospective controlled study.
Participants
Seventy-seven overweight and obese sedentary postmenopausal women.
Interventions
Six months, 3d/wk AEX+WL (n=37) or WL (n=40).
Measurements
Total body dual-energy x-ray absorptiometry, abdominal computed tomography scans, hyperinsulinemic-euglycemic clamps, adipose tissue biopsies (n=28), and blood for Homeostasis model assessment-insulin resistance, and soluble forms of intracellular adhesion molecule (sICAM-1) and vascular CAM-1 (sVCAM-1), C-reactive protein (CRP), and serum amyloid A (SAA).
Results
Body weight, %fat, visceral fat, triglyceride levels and systolic blood pressure decreased comparably after WL and AEX+WL (P<0.05). VO2max increased 16% after AEX+WL (P<0.001). Insulin resistance decreased in both groups (P<0.01). Glucose utilization increased 10% (P< 0.05) after AEX+WL and 8% with WL (P=0.07). AEX+WL and WL decreased CRP by 29% and 21%, (P<0.05). SAA levels decreased two-fold more after AEX+WL (−19%, P<0.05) than with WL (−9%, P=0.08). Plasma sICAM-1 and sVCAM-1 levels did not change; however, women with the greatest reduction in plasma sICAM-1 levels had the greatest reductions in fasting glucose, insulin and insulin resistance (P<0.05). Gluteal ICAM mRNA levels decreased 27% after AEX+WL (P<0.05) and did not change after WL.
Conclusion
Obesity and insulin resistance worsen markers of systemic and vascular inflammation. A reduction in plasma sICAM-1 is important to improve insulin sensitivity. CRP and SAA and tissue ICAM decrease with exercise and weight loss, suggesting that exercise training is a necessary component of lifestyle modification in obese postmenopausal women.
Keywords: Exercise, Diet, Inflammation, Insulin Sensitivity
INTRODUCTION
Vascular inflammation is involved in atherosclerotic processes associated with insulin resistance. The soluble forms of intracellular adhesion molecule (sICAM-1) and vascular CAM-1 (sVCAM-1) along with C-reactive protein (CRP) levels are vascular inflammatory markers for endothelial dysfunction associated with increased risk of diabetes and coronary heart disease1, 2. These soluble adhesion molecules are also associated with insulin resistance in subjects with type 2 diabetes3. CRP, a biomarker of low-grade inflammation, and acute-phase serum amyloid A (SAA) which stimulates the production of inflammatory cytokines in coronary artery endothelial cells4, are elevated in obesity and can predict cardiovascular disease (CVD)1, 5. Acute phase reactants, CRP and SAA, activate the endothelium and induce vascular adhesion molecules such as ICAM-1 and VCAM-16. In addition, CRP levels are significantly associated with congestive heart failure events in elderly men and women in the Health ABC study7. Rates of CVD8, 9 and stroke10, 11 increase exponentially after age 55 and obesity increases relative risk of CVD by 64% in women, as opposed to 46% in men12, emphasizing the need to identify risk factors early in postmenopausal women. At this age, interventions may reduce CVD and diabetes risk which may prolong the negative consequences of these diseases. Older women are less fit and less physically active than younger women emphasizing the need to intervene with exercise training to offset the decline in fitness with aging. Limited information is available on these markers and their relationship to central obesity and insulin action in postmenopausal women.
Lifestyle interventions of aerobic exercise and weight loss may alter vascular and systemic markers of inflammation to reduce CVD risk. In the LIFE trial, CRP levels decreased 32% after 12 months of physical activity in the elderly; however, there was no significant difference in CRP levels between treatment groups (physical activity versus health education) suggesting that exercise alone has a limited effect on CRP13. Weight loss, on the other hand, decreases CRP14 but may not alter sICAM-1 and sVCAM-1 concentrations15, 16. Results are mixed as to the effects of exercise training with and without weight loss on the soluble adhesion molecules17–19,20,21 but there are no studies in middle-aged and older obese postmenopausal women.
It is our hypothesis that CRP and SAA, biomarkers of systemic inflammation, and sICAM-1 and sVCAM-1, biomarkers of vascular inflammation, are related to central obesity and insulin resistance in older, obese postmenopausal women and would be reduced by lifestyle modifications of exercise and weight loss. This investigation examined the relationships of plasma and tissue markers of systemic and vascular inflammation to obesity and insulin resistance and compared the effects of aerobic exercise training plus weight loss versus weight loss alone on markers of inflammation in older, obese women. We also examined the response of ICAM-1 and VCAM-1 mRNA expression in abdominal and gluteal adipose tissue to these interventions as well as insulin sensitivity, lipid profiles, and blood pressure.
METHODS
Subjects were healthy, overweight and obese (body mass index, BMI ≥25 kg/m2; range of 25–46 kg/m2), postmenopausal women aged 50–76 years and had not menstruated for at least 1 year. Women were weight stable (<2.0 kg weight change in past year), sedentary (<20 min of aerobic exercise 2x/wk) and screened by medical history, physical examination, and fasting blood profile for overt and chronic disease which would preclude participation in exercise and weight loss programs. All subjects were nonsmokers and showed no evidence of cancer, liver, renal or hematological disease, or other medical disorders. Individuals with untreated hypertension (blood pressure>160/90 mmHg) or hyperlipidemia (triglycerides≥4.5 mM, cholesterol > 6.2 mM, LDL-cholesterol >4.3 mM) were referred to their doctor for therapy and allowed to enter if treated with an antihypertensive or lipid-lowering drug that did not affect glucose metabolism. All subjects underwent a screening Bruce graded treadmill test to exclude those with asymptomatic coronary artery disease.
Women in this study were part of a larger cohort where body composition and glucose clamp results were previously published 22, but not the lipid levels, blood pressure, inflammatory and vascular biomarkers. One-hundred and seventy-four women met study criteria and were assigned to weight loss (WL, n=86) or aerobic exercise+weight loss (AEX+WL, n=88). Sixty-three women dropped out of the program due to personal reasons, relocation, illness, and/or time constraints leaving 111 women. Sixteen women were excluded from the analysis either because they were not compliant to the weight loss or exercise guidelines described below (n=8) or they had type 2 diabetes (n=8) resulting in n= 95completed (WL, n=46 and AEX+WL, n=49). The baseline characteristics (age, race, BMI), within AEX+WL and WL for those who dropped out did not differ from those who completed (data not shown). Plasma samples were not available for 18 women so data are reported on 77 women in whom biomarkers were measured (WL:n=40 and AEX+WL:n=37). Women were 66% Caucasian and 34% African American. Sixteen WL women (40%) and 14 AEX+WL women (38%) were on an antihypertensive medication. Women were on lipid-lowering drugs in WL and AEX+WL (n=8, 20% and n=7, 19%, respectively). The Institutional Review Board of the University of Maryland approved all methods and procedures. Each participant provided written informed consent to participate.
Study Protocol
WL and AEX+WL Interventions
Prior to metabolic testing and initiation of the weight loss intervention(s), subjects received instruction in Therapeutic Lifestyle Changes (TLC) isocaloric diet23 which emphasizes low dietary fat, high fiber and low sodium by a registered dietitian (RD) 1x/week for 6–8 weeks. Subjects were weight stable on the TLC program prior to baseline testing, and were instructed to maintain the same macronutrient guidelines for dietary intake throughout the study. After baseline testing, all subjects attended weekly weight loss classes for 6 months for diet instruction by a RD. Compliance was monitored by 7-day food records using the American Diabetes Association exchange list system. Individuals were instructed to restrict their caloric intake by 300 to 500 kcal/d to achieve weight loss while maintaining the TLC diet for macronutrient composition. The AEX+WL group exercised at our facility 3x/week for 6 months using treadmills and elliptical trainers. Each exercise session included a 5–10 minute warm-up and a 5–10 minute cool-down. Women exercised at ~50–60% heart rate reserve (HRR) and gradually progressed in duration and intensity until women were able to exercise at >85% HRR for 45 minutes. The average compliance to exercise and weight loss classes was ~86%.
VO2max, Body Composition, and Blood Pressure
VO2max was measured using a continuous graded treadmill test22. Height, weight, BMI, and waist circumference was determined22. Fat mass, lean tissue mass and bone mineral content (BMC) (fat-free mass=lean+BMC) were determined by dual-energy X-ray absorptiometry (DXA) (Prodigy, LUNAR Radiation Corp., Madison, WI). A single computed tomography (CT) scan at L4–L5 region using a Siemens Somatom Sensation 64 Scanner (Fairfield, CT) was used to determine visceral adipose tissue (VAT) area, subcutaneous adipose tissue (SAT) area, and sagittal diameter and analyzed using MIPAV (Medical Image Processing, Analysis and Visualization, v.7.0.0). Sitting blood pressure was measured on three occasions and the average used in the analyses.
Metabolic Testing
All subjects were weight stable (±2%) for at least two weeks prior to metabolic testing before and after the interventions and were provided with a eucaloric diet for two days before the clamp to control nutrient intake. All testing was performed in the morning after a 12-hr overnight fast. Women in the AEX+WL group stabilized their weight and continued the aerobic training 3 d/wk during the final testing period, while the WL group was weight stabilized. The glucose clamps and blood draws were performed 36–48 hours after the last bout of exercise.
Oral glucose tolerance test (OGTT)
Blood samples were drawn before and at 30-min intervals for 2h after ingestion of 75g of glucose. Plasma glucose concentrations were measured in duplicate using the glucose oxidase method (2300-STAT Plus, YSI, Yellow Springs, OH). Subjects were classified as having normal glucose tolerance (NGT) and impaired glucose tolerance (IGT)24. Hyperinsulinemic-euglycemic Clamps: Peripheral tissue sensitivity to exogenous insulin was measured using a 3-hour 240 pmol·m−2·min−1 hyperinsulinemic-euglycemic clamp technique 25. Difficulty in obtaining venous access or scheduling conflicts occurred (n=19). Clamps were performed before and after WL (n=26) and AEX+WL (n=25). Plasma glucose and insulin levels (10–180 min) did not differ between interventions and before and after WL (4.96±0.08 vs. 4.92±0.06 mmol/l and 1084±39 vs. 1100±47 pmol/l, respectively) and AEX+WL (5.02±0.07 vs. 4.99±0.07 mmol/l and 1140±49 vs. 1083±34 pmol/l, respectively). This was 96±0.3% of the desired goal with 6.5±0.2% CV in all clamps (n=102). Blood Samples were collected in heparinized syringes, placed in prechilled test tubes containing 1.5mg EDTA/ml blood, centrifuged at 4°C and stored at −80°C until analysis. Plasma insulin was determined in duplicate by RIA22. Fasting plasma for CRP, SAA, sICAM-1, and sVCAM-1 were measured in duplicate with CV<10% by electrochemiluminescence using a multi-spot microplate by Meso Scale Discovery (SECTOR Imager-6000). One woman didn’t have blood drawn for the inflammatory markers. Blood for fasting lipid profiles were obtained three times with results averaged. Plasma TG and cholesterol were analyzed by enzymatic methods (Hitachi model-917 analyzer), and HDL-cholesterol measured in the supernatant after precipitation with dextran sulfate. LDL-cholesterol=total cholesterol–(TG/5 + HDL-C)26.
Adipose Tissue Aspirations
After a 12-h overnight fast, 28 women (n=14 AEX+WL and n=14 WL) had 4–6 g of subcutaneous adipose tissue obtained under local anesthesia (1% xylocaine) from abdominal (3–4 cm distal to the umbilicus) and gluteal (upper distal quadrant) regions by aspiration with a cannula. Aliquots of adipose samples were immediately frozen and stored at −80°C until analysis.
RNA Extraction, Reverse Transcription and Real-time RT-PCR
Total RNA was extracted from adipose tissue by the acid guanidinium sothiocyanate-phenol-chloroform method27. One μg of total RNA for each sample was reverse transcripted into first strand cDNA using Transcriptor First Strand cDNA Synthesis Kit (Cat# 04896866001, Roche Applied Science). Quantitative Real-time PCR and data analysis were performed with LightCycler 480 Multiwell plate 384 (Cat# 04729748001), LightCycler 480 Probes Master kit (Cat# 04887301001,) and Taqman gene expression primer/probe set (Applied Biosystems, Foster City, CA, Human ICAM: Cat# Hs00164932_m1; Human VCAM: Cat# Hs01003372_m1). Each qPCR reaction was carried out in a final volume of 10μl, consisting of 2μl 1:4 diluted template cDNA, 5μl LightCycler 480 Probes Master, 0.5μl Taqman gene expression primer and probe mix, and 2.5μl nuclease-free water. Gene expression data were analyzed by LightCycle 480 Software v.1.5 advanced relative quantification program. Data is presented as the mean±SEM of three determinations for each sample and the normalized ratio of Target/Reference.
Statistical Analyses
Glucose utilization (M) for 30-min intervals was calculated22. Homeostasis model assessment-insulin resistance was computed (glucose in millimolar×insulin in μ/ml)/22.5. Univariate ANOVA tested for differences in changes between AEX+WL and WL. Within each intervention, differences between pre-intervention and post-intervention variables were determined using a paired t-test which were defined as secondary analyses. Regression analyses were used to determine correlations between blood and adipose tissue biomarkers, body composition, lipid levels, BP, and glucose metabolism. Statistical significance was set at P<0.05. Data were analyzed by SPSS (PASW Statistics 18, SPSS Inc., Chicago) and expressed as mean±SEM.
RESULTS
Baseline Characteristics and Relationships of Vascular and Systemic Inflammation
Demographic characteristics: Women were living independently, 71% were married, 12% were divorced, 10% widowed, and 7% never married. Also, 52% worked full-time, an additional 12% worked part-time, and 37% of women were retired. In terms of education, 46% had a graduate degree, 12% had a bachelor’s degree, 31% had vocational/some college/associated degree, and 12% had high school degree. Individual incomes were the following: <$11,000 (2%), $11,000–20,000 (7%), $21,000–30,000 (9%), $31,000–40,000 (13%), $41,000–50,000 (17%), >51,000 (52%).
The AEX+WL and WL groups were well matched with respect to physical and metabolic variables at baseline (Table 1). There was no difference in age (identical age range of 50–76 years in both groups), weight, BMI, waist circumference, percent body fat, fat mass, fat-free mass, visceral fat, subcutaneous abdominal fat, total abdominal fat, total abdominal/visceral fat ratio, sagittal diameter and DBP between the AEX+WL and WL groups at baseline. There were no differences in triglycerides, total cholesterol, HDL-cholesterol, LDL-cholesterol, fasting glucose, glucose@120 min, fasting insulin, HOMA-IR, M (mg/kg/min or μmol/kgFFM/min), CRP, SAA, sICAM-1, sVCAM-1 concentrations between groups. The only difference between groups at baseline was that HDL3-cholesterol was higher in WL whereas VO2max and SBP were higher in AEX+WL (P<0.05). There was no difference by glucose tolerance between groups (60% had NGT and 40% had IGT).
Table 1.
Metabolic effects of AEX+WL and WL
| AEX+WL (n=37) | WL (n=40) | Intervention Comparison | |||
|---|---|---|---|---|---|
|
| |||||
| Pre | Post | Pre | Post | ||
| Age (yr) | 60 ± 1 | --- | 61 ± 1 | --- | NS |
| Weight (kg) | 85.2 ± 2.4 | 78.2 ± 2.2 ‡ | 87.2 ± 2.1 | 80.0 ± 2.0‡ | NS |
| BMI (kg/m2) | 32 ± 1 | 30 ± 1 ‡ | 33 ± 1 | 30 ± 1‡ | NS |
| Waist circumference (cm) | 96.3 ± 2.4 | 91.8 ± 2.5‡ | 96.7 ± 1.6 | 91.0 ± 1.7‡ | NS |
| Percent body fat | 47.1 ± 0.9 | 43.5 ± 1.1‡ | 47.8 ± 0.6 | 44.8 ± 0.8‡ | NS |
| Fat mass (kg) | 40.6 ± 1.7 | 34.8 ± 1.7‡ | 42.4 ± 1.5 | 36.7 ± 1.4‡ | NS |
| Fat-free mass (kg) | 45.0 ± 1.1 | 44.1 ± 0.9* | 45.4 ± 0.8 | 43.9 ± 0.8† | NS |
| VO2max (l/min) | 1.78 ± 0.08 a | 2.03 ± 0.10‡ | 1.50 ± 0.06 | 1.48 ± 0.05 | P<0.01 |
| Visceral fat (cm2) | 145.8 ± 13.6 | 125.6 ± 11.7† | 141.8 ± 8.8 | 120.2 ± 6.9† | NS |
| Subcutaneous abdominal fat (cm2) | 458.4 ± 24.4 | 390.4 ± 27.8‡ | 432.0 ± 23.8 | 379.8 ± 21.4† | NS |
| Total abdominal fat (cm2) | 598.7 ± 34.2 | 505.9 ± 35.8‡ | 567.6 ± 24.6 | 493.4 ± 23.3‡ | NS |
| Total abdominal/Visceral | 4.97 ± 0.38 | 5.08 ± 0.40 | 4.64 ± 0.34 | 4.73 ± 0.35 | NS |
| Sagittal Diameter (mm) | 25.8 ± 0.7 | 23.8 ± 0.7‡ | 25.3 ± 0.5 | 23.4 ± 0.5‡ | NS |
| Systolic BP (mmHg) | 123 ± 2a | 118 ± 2† | 119 ± 1 | 116 ± 2* | NS |
| Diastolic BP (mmHg) | 69 ± 1 | 67 ± 1 | 68 ± 1 | 65 ± 1* | NS |
| TG (mg/dl) | 118 ± 7 | 101 ± 5‡ | 122 ± 8 | 111 ± 8‡ | NS |
| Total Cholesterol (mg/dl) | 193 ± 6 | 188 ± 5 | 200 ± 5 | 193 ± 5 | NS |
| HDL-C (mg/dl) | 51 ± 2 | 55 ± 2† | 56 ± 2 | 58 ± 2 | NS |
| HDL3-C (mg/dl) | 41 ± 1 a | 44 ±1* | 45 ± 1 | 44 ± 1 | NS |
| LDL-C (mg/dl) | 118 ± 5 | 113 ± 4 | 119 ± 5 | 114 ± 4 | NS |
| Fasting glucose (mmol/l) | 5.2 ± 0.1 | 5.1 ± 0.1* | 5.4 ± 0.1 | 5.0 ± 0.1‡ | NS |
| Glucose@120min (mmol/l) | 7.3 ± 0.3 | 6.8 ± 0.2 | 6.9 ± 0.3 | 6.7 ±0.3 | NS |
| Fasting insulin (pmol/l) | 84 ± 8 | 69 ± 5† | 88 ± 6 | 66 ± 4‡ | NS |
| HOMA-IR | 2.9 ± 0.3 | 2.3 ± 0.2† | 3.0 ± 0.2 | 2.1 ± 0.1‡ | |
| M (mg/kg/min) | 6.2 ± 0.3 | 7.4 ± 0.4‡ | 6.0 ± 0.3 | 6.6 ± 0.3† | NS |
| M (μmol/kgFFM/min) | 64.6 ± 3.3 | 71.1 ± 3.1* | 63.8 ± 3.1 | 68.1 ± 3.6 | NS |
VO2max = maximal oxygen consumption, BP = blood pressure, TG= triglycerides, HDL-C = high density lipoprotein cholesterol, LDL-C = low density lipoprotein cholesterol, HOMA-IR = Homeostasis model assessment-insulin resistance, M = glucose utilization.NS, nonsignificant. Values are mean ± SEM. Baseline differences tested between groups;
P<0.05.
Significantly different pre vs. post intervention:
P<0.05;
P<0.01;
P<0.001.
Plasma sICAM-1, sVCAM-1, CRP and SAA levels correlated with each other (r=0.53 to 0.71, P<0.001) except that sVCAM-1 was not related to CRP. sICAM-1 levels related to waist circumference, visceral fat, subcutaneous abdominal fat, sagittal diameter, glucose120min, fasting insulin, HOMA-IR, and inversely to VO2max and M (P<0.05 to P<0.005, Table 2). In contrast, sVCAM-1 was related to sagittal diameter (P<0.05) and tended to be related to VO2max (P=0.06). Both CRP and SAA levels related to BMI, waist circumference, %fat, subcutaneous abdominal fat, and sagittal diameter (P<0.05 to P<0.005). CRP was associated with fasting insulin and HOMA-IR (P<0.05). SAA levels were associated with HOMA-IR (P=0.05) and inversely associated with M (P<0.05). In multivariate analysis with VAT, VO2max, and M in the model, visceral fat remained the independent predictor of circulating concentrations of sICAM-1, CRP, and SAA levels (all P<0.05).
Table 2.
Bivariate associations of vascular and systemic markers of inflammation in postmenopausal women
| sICAM-1 | sVCAM-1 | CRP | SAA | ||
|---|---|---|---|---|---|
| BMI | N=76 | 0.24a | Ns | 0.39‡ | 0.33† |
| Waist | N=71 | 0.24 a | Ns | 0.38‡ | 0.35† |
| % Fat | N=76 | ns | Ns | 0.42‡ | 0.30† |
| Visceral Fat Area | N=72 | 0.38† | Ns | 0.25 a | 0.30* |
| Subcutaneous Abdominal Fat | N=60 | 0.31* | Ns | 0.59‡ | 0.46‡ |
| Sagittal Diameter | N=72 | 0.47‡ | 0.30* | 0.51‡ | 0.49‡ |
| VO2max | N=74 | −0.23 a | Ns | −0.22 a | ns |
| Fasting glucose | N=76 | 0.24* | Ns | ns | 0.20 a |
| G120 | N=76 | 0.26* | Ns | 0.19 | ns |
| Fasting insulin | N=76 | 0.28* | Ns | 0.29* | ns |
| HOMA-IR | N=76 | 0.31† | Ns | 0.29* | 0.22 b |
| M (mg·kg−1·min−1) | N=59 | −0.29* | Ns | −0.21 | −0.29 * |
BMI= body mass index, VO2max = maximal oxygen consumption, HOMA-IR = Homeostasis model assessment-insulin resistance, M = glucose utilization.
ns = non-significant
P<0.07,
P=0.05,
P<0.05;
P<0.01;
P<0.005
Effects of AEX+WL and WL
VO2max (l/min) increased 16% after AEX+WL (P<0.001) but did not change with WL (group effect, P<0.01). There were no other significant differences in changes in either body composition or metabolic variables by intervention. Body weight decreased 8% after AEX+WL and WL (P<0.001) with comparable decreases in % fat, fat mass, visceral fat and subcutaneous abdominal fat (P<0.01) and FFM (P<0.05) (Table 1). SBP decreased (P<0.01) and DBP tended to decrease (P=0.08) after AEX+WL. Both SBP and DBP decreased after WL (P<0.05). Fasting TG decreased 14% after AEX+WL (P<0.001) and 10% after WL (P<0.001). Total cholesterol did not change significantly in either group, nor did LDL-C after WL (P=0.11) and AEX+WL (P=0.08). There was a 7% increase in both HDL-C (P<0.01) and HDL3-C (P<0.05) after AEX+WL but neither HDL-C nor HDL3-C changed after WL. Fasting plasma glucose (P<0.05) and insulin (P<0.01) decreased in both groups and HOMA-IR decreased after AEX+WL (−21%) and WL (−30%) (P<0.01). M (μmol/kgFFM/min) increased 10% (P<0.05) after AEX+WL and tended to increase (8%, P=0.07) after WL.
CRP decreased 29% with AEX+WL (P<0.001) and 21% with WL (P<0.05) (Figure 1). Plasma SAA levels decreased 19% after AEX+WL (P<0.05) and tended to decrease after WL (P=0.08). sICAM-1 tended to decrease after WL (P=0.06) and did not change after AEX+WL (Figure 2). sVCAM-1 levels did not significantly change after AEX+WL or WL. Although abdominal ICAM mRNA expression decreased 14% after AEX+WL (14.63±2.24 vs. 12.54±2.25 AU) and 19% after WL (12.18±1.25 vs. 9.88±1.09 AU), changes were not statistically significant. Gluteal ICAM mRNA levels decreased 27% after AEX+WL (14.05±2.16 vs. 10.25±1.64 AU, P<0.05). AEX+WL increased gluteal VCAM mRNA expression 42% (4.76±0.66 vs. 6.77±0.89 AU, P<0.05) and did not change abdominal VCAM mRNA levels (5.80±1.04 vs. 5.61±0.65 AU). There were no significant changes after WL in gluteal ICAM (9.97±1.33 vs. 9.44±1.56 AU), abdominal VCAM (5.42±0.43 vs 5.21±0.52 AU) or gluteal VCAM (5.04±0.74 vs. 4.62±0.68 AU) mRNA expression.
Figure 1.

Plasma C-reactive protein (CRP) and acute-phase serum amyloid A (SAA) levels pre and post aerobic exercise +weight loss (AEX+WL) (n=36) and weight loss (WL) (n=40) in postmenopausal women. *P<0.05; ‡P<0.001.
Figure 2.
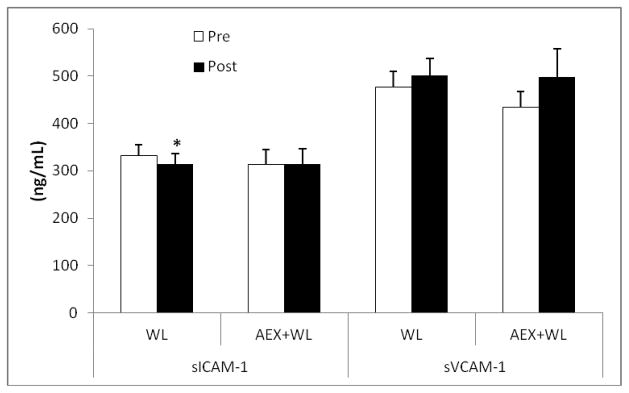
Plasma intracellular adhesion molecule (sICAM-1) and vascular CAM-1 (sVCAM-1)levels pre and post aerobic exercise +weight loss (AEX+WL) (n=35) and weight loss (WL) (n=40) in postmenopausal women. *P<0.05
When the effects of the interventions on the inflammatory and vascular markers were examined, absolute changes in CRP were related to changes in SAA (r=0.45, P<0.001) and changes in sICAM-1 were related to changes in sVCAM-1 (r=0.63, P<0.001). Changes in the inflammatory and vascular markers were not associated with changes in central obesity (waist circumference, visceral fat, subcutaneous abdominal fat). The change or decrease in sICAM-1 levels correlated with the decrease in fasting glucose (r=0.27, P<0.05), fasting insulin (r=0.27, P<0.05), and HOMA-IR (r=0.33, P<0.01). The change in gluteal ICAM mRNA correlated with VO2max change (r=−0.52, P<0.05). Changes in blood pressure and lipids did not correlate with changes in biomarkers.
DISCUSSION
This is the first report of the inverse relationships between sICAM-1 and SAA with insulin sensitivity measured by the glucose clamp in older, obese sedentary women. We found no differences in the response to the interventions in terms of the vascular markers. There was a reduction of plasma CRP and SAA and gluteal ICAM mRNA expression when aerobic exercise is combined with WL; however, plasma biomarkers of endothelial dysfunction do not appear to change with either lifestyle intervention in obese postmenopausal women.
In our subjects, CRP levels directly correlated with central obesity at baseline regardless of glucose tolerance status. This is concordant with findings that larger abdominal/waist circumference or WHR is directly associated with higher CRP levels28, 29. CRP levels showed a stronger correlation with subcutaneous abdominal fat than visceral fat. Studies show correlations of CRP levels with both visceral and subcutaneous fat in both men and women, although the magnitude of these associations varies considerably30–33. Generally, these studies do not indicate that one abdominal fat depot is more closely associated with CRP levels than another.
Previous WL intervention studies typically show a reduction in CRP levels, but there is variability among study results14. A recent systematic review by Selvin et al.14 indicates that WL reduces CRP regardless of stimulus (diet, exercise, surgical, etc.), with an mean reduction of 0.13 mg/L per kg WL. This rate approximates the reduction in CRP in our subjects who lost an average of 7–8 kg of body weight, as both AEX+WL and WL reduced CRP levels comparably in these postmenopausal women. While the reduction in CRP appeared greater after AEX+WL, there was no statistical difference between the responses indicating that we could not discern an independent or additive effect of AEX. Studies of the effects of aerobic exercise training on CRP levels generally show mixed results30, 34–38 with some indicating that WL is a necessary component to reduce CRP levels39,40. Given that reducing CRP levels independently predicts a reduced rate of atherosclerosis progression and coronary disease41,42, our data suggests that either intervention would be expected to have similar salutary effects on atherosclerotic endpoints in postmenopausal women.
SAA is similar to CRP as both are major acute phase proteins mediated through pro-inflammatory and messenger cytokines43 and are positively associated in this study and others44. SAA levels are related to BMI, waist circumference, %fat, subcutaneous abdominal fat, and sagittal diameter but not visceral fat. In women followed through the menopause transition, the increase in visceral fat correlated with an increase in SAA45. Work by our group4, and a recent meta-analysis43, show that WL reduces SAA levels. Following 12 months moderate-intensity aerobic exercise, SAA decreased, but wasn’t different from controls35. In our study, AEX+WL reduced SAA but WL did not, despite similar reductions in body weight and fat mass suggesting that exercise has beneficial effects on SAA beyond WL.
We show for the first time that SAA is negatively associated with whole body (mg/kg/min) in vivo insulin sensitivity. In another study44, subjects with IGT had elevated SAA compared to those with NGT. While the mechanism for these associations is unknown, elevated SAA could lead to pro-inflammatory production and infiltration of immune cells. This chronic activation of the innate immune system may disrupt whole-body insulin sensitivity and impair glucose homeostasis46. In cell culture work, SAA inhibits genes involved in maintaining insulin sensitivity (i.e. adiponectin, Glut4, IRS-1)47 and activates the JNK pathway48. SAA may also reduce lipogenesis and increase production of lipolysis-promoting cytokines49, resulting in increased circulating free-fatty acids and decrease in skeletal muscle and hepatic glucose uptake. More research is needed to investigate the mechanisms underlying the effects of these lifestyle interventions on SAA in older populations.
In these women, sICAM-1 levels were positively correlated with central obesity, glucose tolerance, and fasting insulin and inversely with M. In contrast, sVCAM-1 levels were only related to sagittal diameter. In previous studies, sICAM-1 and sVCAM-1 concentrations were higher in obese than nonobese by BMI20, higher in diabetes50, or not different between obese and type 2 diabetics17. Our findings are similar to those in children51 where greater insulin resistance was associated with higher sICAM-1 levels. Ours is the only report to use glucose clamps in older individuals to show the relationship of vascular markers to insulin resistance.
To our knowledge, there are no studies examining the effects of AEX+WL and WL on plasma sICAM-1 and sVCAM-1 levels or mRNA expression in postmenopausal women. Our results are consistent with reports that WL doesn’t change sICAM-1 or sVCAM-1 in middle-aged obese men and women15 or hypercholesterolemic men16. There were no changes in these biomarkers either after 8-, 10- or 12-week aerobic exercise in obese subjects or those with type 2 diabetes17, 18, 50 or endurance+strength training in men with the metabolic syndrome19 or in our AEX+WL. However, one-year of 3x/week exercise+10%WL, both sICAM-1 and sVCAM-1 levels decreased in obese premenopausal women20. Estrogen therapy may significantly impact vascular inflammation and partially explain differences between pre- and post-menopausal women52. Likewise, sICAM-1 levels decreased in obese men after a 3-week low fat diet with daily treadmill exercise21. Although WL or exercise alone don’t seem to reduce these circulating markers, the effects of a combined AEX+WL intervention aren’t clear. Since acute phase reactants activate the endothelium and induce ICAM-1 and VCAM-1, it is possible that our interventions could not sufficiently induce a downstream effect to reduce the vascular markers. Alternative strategies may be necessary to reduce plasma intracellular adhesion molecules in postmenopausal women.
Expression of the adhesion molecules in adipose tissue hasn’t been studied extensively and results are inconclusive. ICAM-1 and VCAM-1 mRNA expression in visceral adipose tissue is higher in obese than lean women but are not different between lean and obese in subcutaneous abdominal fat53. In an earlier study, the same group showed conflicting evidence that the gene expression of adhesion molecules in subcutaneous abdominal adipose tissue was higher in obese than lean women54. There were no differences in ICAM or VCAM expression in abdominal versus gluteal subcutaneous tissue in our study suggesting that there is not a depot difference in subcutaneous fat gene expression of these biomarkers. Even less is known about the effects of lifestyle interventions on mRNA expression of adhesion molecules. Although we find modest (14–19%) decreases in abdominal ICAM gene expression after AEX+WL and WL, only the decrease in gluteal ICAM expression after AEX+WL was significant. In contrast, a three-week diet-induced WL significantly increases ICAM-1 mRNA expression in subcutaneous fat54 which may be due to an acute effect of a short-term dietary restriction program compared to our six-month intervention. Also, these subjects54 may have been hypocaloric at time of study, thus confounding differentiation of the effects of WL from a hypocaloric state whereas our subjects were weight stable at the time of post-testing. We cannot explain the increase in VCAM-1 mRNA expression in gluteal adipose tissue after AEX+WL but this seems to support an increase in VCAM expression in subcutaneous adipose tissue after WL54. Although we didn’t find a relationship between ICAM-1 and VCAM-1 expression and glucose metabolism, one study showed a positive association between fasting insulin and VCAM-1 mRNA but not ICAM-1 expression in abdominal subcutaneous fat in lean and obese women53. The correlation between ICAM-1 and VCAM-1 expression in VAT with BMI and CD68 (macrophage related marker) may explain the relationship between visceral obesity and macrophage fat infiltration and endothelial dysfunction53.
These findings apply only to obese postmenopausal women. Another limitation is that there was no exercise alone or a non-intervention control group. In addition, we were unable to measure adipose tissue gene expression in all women. Future studies should examine these markers in men, as it appears that they have different pathophysiology involved in the early onset of CVD (e.g. men have higher degrees of atheroma and epicardial endothelial dysfunction, whereas women are more likely to have microvasculature diseases)55. Notwithstanding these qualifications, our study utilized state of the art technique to measure insulin sensitivity, body composition, inflammatory biomarkers and vascular adhesion molecules and carefully conducted weight loss and exercise regimes. This study provides evidence that in obese postmenopausal women, not only were markers of systemic and vascular inflammation associated with obesity and insulin resistance, but they decreased through combined weight loss and aerobic exercise. This suggests that multifaceted strategies may be needed to improve vascular inflammation, and thereby clinical outcomes in older obese women.
Acknowledgments
Our appreciation is extended to the women who participated in this study. We are grateful to the nurses, research assistants and dieticians of the Division of Gerontology and Geriatric Medicine and GRECC for their assistance to this project.
Support: This research was supported by VA Research Career Scientist Award (ASR), Veterans Affairs Merit Award (ASR), the Baltimore Veterans Affairs Medical Center Geriatric Research, Education and Clinical Center (GRECC), VA Career Development Awards (JBB and SJP), T32-AG-00219, NIH grant R01-AG-019310 (ASR), RO1-AG-20116 (APG), GCRC (#M01 RR016500), NORC of Maryland (DK072488), and the University of Maryland Claude D. Pepper Center (P30-AG-12583). Clinical Trials: NCT00882141.
Footnotes
Paper Presentation: This was presented at the American Diabetes Association annual meeting.
There are no conflicts of interest.
References
- 1.Ridker PM, Hennekens CH, Buring JE, et al. C-reactive protein and other markers of inflammation in the prediction of cardiovascular disease in women. N Engl J Med. 2000;342:836–843. doi: 10.1056/NEJM200003233421202. [DOI] [PubMed] [Google Scholar]
- 2.Festa A, D’Agostino R, Jr, Tracy RP, et al. Elevated levels of acute-phase proteins and plasminogen activator inhibitor-1 predict the development of type 2 diabetes: The insulin resistance atherosclerosis study. Diabetes. 2002;51:1131–1137. doi: 10.2337/diabetes.51.4.1131. [DOI] [PubMed] [Google Scholar]
- 3.Targher G, Bonadonna RC, Alberiche M, et al. Relation between soluble adhesion molecules and insulin sensitivity in type 2 diabetic individuals: role of adipose tissue. Diabetes Care. 2001;24:1961–1966. doi: 10.2337/diacare.24.11.1961. [DOI] [PubMed] [Google Scholar]
- 4.Yang RZ, Lee MJ, Hu H, et al. Acute-phase serum amyloid A: An inflammatory adipokine and potential link between obesity and its metabolic complications. PLoS Med. 2006;3:e287. doi: 10.1371/journal.pmed.0030287. [DOI] [PMC free article] [PubMed] [Google Scholar]
- 5.Johnson BD, Kip KE, Marroquin OC, et al. Serum amyloid A as a predictor of coronary artery disease and cardiovascular outcome in women: The National Heart, Lung, and Blood Institute-Sponsored Women’s Ischemia Syndrome Evaluation (WISE) Circulation. 2004;109:726–732. doi: 10.1161/01.CIR.0000115516.54550.B1. [DOI] [PubMed] [Google Scholar]
- 6.Koh KK, Han SH, Quon MJ. Inflammatory markers and the metabolic syndrome: Insights from therapeutic interventions. J Am Coll Cardiol. 2005;46:1978–1985. doi: 10.1016/j.jacc.2005.06.082. [DOI] [PubMed] [Google Scholar]
- 7.Cesari M, Penninx BW, Newman AB, et al. Inflammatory markers and onset of cardiovascular events: Results from the Health ABC study. Circulation. 2003;108:2317–2322. doi: 10.1161/01.CIR.0000097109.90783.FC. [DOI] [PubMed] [Google Scholar]
- 8.Roger VL, Go AS, Lloyd-Jones DM, et al. Heart disease and stroke statistics--2012 update: A report from the American Heart Association. Circulation. 2012;125:e2–e220. doi: 10.1161/CIR.0b013e31823ac046. [DOI] [PMC free article] [PubMed] [Google Scholar]
- 9.Ford ES, Capewell S. Coronary heart disease mortality among young adults in the U.S. from 1980 through 2002: Concealed leveling of mortality rates. J Am Coll Cardiol. 2007;50:2128–2132. doi: 10.1016/j.jacc.2007.05.056. [DOI] [PubMed] [Google Scholar]
- 10.Brown RD, Whisnant JP, Sicks JD, et al. Stroke incidence, prevalence, and survival: Secular trends in Rochester, Minnesota, through 1989. Stroke. 1996;27:373–380. [PubMed] [Google Scholar]
- 11.Wolf PA, D’Agostino RB, O’Neal MA, et al. Secular trends in stroke incidence and mortality. The Framingham Study. Stroke. 1992;23:1551–1555. doi: 10.1161/01.str.23.11.1551. [DOI] [PubMed] [Google Scholar]
- 12.Wilson PW, D’Agostino RB, Sullivan L, et al. Overweight and obesity as determinants of cardiovascular risk: The Framingham experience. Arch Intern Med. 2002;162:1867–1872. doi: 10.1001/archinte.162.16.1867. [DOI] [PubMed] [Google Scholar]
- 13.Nicklas BJ, Hsu FC, Brinkley TJ, et al. Exercise training and plasma C-reactive protein and interleukin-6 in elderly people. J Am Geriatr Soc. 2008;56:2045–2052. doi: 10.1111/j.1532-5415.2008.01994.x. [DOI] [PMC free article] [PubMed] [Google Scholar]
- 14.Selvin E, Paynter NP, Erlinger TP. The effect of weight loss on C-reactive protein: A systematic review. Arch Intern Med. 2007;167:31–39. doi: 10.1001/archinte.167.1.31. [DOI] [PubMed] [Google Scholar]
- 15.Skilton MR, Sieveking DP, Harmer JA, et al. The effects of obesity and non-pharmacological weight loss on vascular and ventricular function and structure. Diabetes Obes Metab. 2008;10:874–884. doi: 10.1111/j.1463-1326.2007.00817.x. [DOI] [PubMed] [Google Scholar]
- 16.Sjogren P, Cederholm T, Heimburger M, et al. Simple advice on lifestyle habits and long-term changes in biomarkers of inflammation and vascular adhesion in healthy middle-aged men. Eur J Clin Nutr. 2010;64:1450–1456. doi: 10.1038/ejcn.2010.182. [DOI] [PubMed] [Google Scholar]
- 17.Ostergard T, Nyholm B, Hansen TK, et al. Endothelial function and biochemical vascular markers in first-degree relatives of type 2 diabetic patients: the effect of exercise training. Metabolism. 2006;55:1508–1515. doi: 10.1016/j.metabol.2006.06.024. [DOI] [PubMed] [Google Scholar]
- 18.Hatunic M, Finucane F, Burns N, et al. Vascular inflammatory markers in early-onset obese and type 2 diabetes subjects before and after three months’ aerobic exercise training. Diab Vasc Dis Res. 2007;4:231–234. doi: 10.3132/dvdr.2007.045. [DOI] [PubMed] [Google Scholar]
- 19.Troseid M, Lappegard KT, Mollnes TE, et al. Changes in serum levels of E-selectin correlate to improved glycaemic control and reduced obesity in subjects with the metabolic syndrome. Scand J Clin Lab Invest. 2005;65:283–290. doi: 10.1080/00365510510013811. [DOI] [PubMed] [Google Scholar]
- 20.Ziccardi P, Nappo F, Giugliano G, et al. Reduction of inflammatory cytokine concentrations and improvement of endothelial functions in obese women after weight loss over one year. Circulation. 2002;105:804–809. doi: 10.1161/hc0702.104279. [DOI] [PubMed] [Google Scholar]
- 21.Roberts CK, Won D, Pruthi S, et al. Effect of a short-term diet and exercise intervention on oxidative stress, inflammation, MMP-9, and monocyte chemotactic activity in men with metabolic syndrome factors. J Appl Physiol. 2006;100:1657–1665. doi: 10.1152/japplphysiol.01292.2005. [DOI] [PubMed] [Google Scholar]
- 22.Ryan AS, Ortmeyer HK, Sorkin JD. Exercise with calorie restriction improves insulin sensitivity and glycogen synthase activity in obese postmenopausal women with impaired glucose tolerance. Am J Physiol Endocrinol Metab. 2012;302:E145–152. doi: 10.1152/ajpendo.00618.2010. [DOI] [PMC free article] [PubMed] [Google Scholar]
- 23.Lichtenstein AH, Appel LJ, Brands M, et al. Summary of American Heart Association Diet and Lifestyle Recommendations revision 2006. ArteriosclerThrombVascBiol. 2006;26:2186–2191. doi: 10.1161/01.ATV.0000238352.25222.5e. [DOI] [PubMed] [Google Scholar]
- 24.American Diabetes A. Diagnosis and Classification of Diabetes Mellitus. Diabetes. 2009;32:S62–67. doi: 10.2337/dc09-S062. [DOI] [PMC free article] [PubMed] [Google Scholar]
- 25.DeFronzo RA, Tobin JD, Andres R. Glucose clamp technique: A method for quantifying insulin secretion and resistance. AmJ Physiol. 1979;237:E214–E223. doi: 10.1152/ajpendo.1979.237.3.E214. [DOI] [PubMed] [Google Scholar]
- 26.Friedewald WT, Levy RI, Fredrickson DS. Estimation of the concentration of low-density lipoprotein cholesterol in plasma, without use of the preparative ultracentrifuge. ClinChem. 1972;18:499–502. [PubMed] [Google Scholar]
- 27.Chomczynski P, Sacchi N. Single-step method of RNA isolation by acid guanidinium thiocyanate-phenol-chloroform extraction. Anal Biochem. 1987;162:156–159. doi: 10.1006/abio.1987.9999. [DOI] [PubMed] [Google Scholar]
- 28.Lapice E, Maione S, Patti L, et al. Abdominal adiposity is associated with elevated C-reactive protein independent of BMI in healthy nonobese people. Diabetes Care. 2009;32:1734–1736. doi: 10.2337/dc09-0176. [DOI] [PMC free article] [PubMed] [Google Scholar]
- 29.Junqueira AS, Romeo Filho LJ, de Junqueira CL. Evaluation of the degree of vascular inflammation in patients with metabolic syndrome. Arq Bras Cardiol. 2009;93:360–366. 353–369. doi: 10.1590/s0066-782x2009001000008. [DOI] [PubMed] [Google Scholar]
- 30.Huffman KM, Samsa GP, Slentz CA, et al. Response of high-sensitivity C-reactive protein to exercise training in an at-risk population. Am Heart J. 2006;152:793–800. doi: 10.1016/j.ahj.2006.04.019. [DOI] [PubMed] [Google Scholar]
- 31.Khera A, Vega GL, Das SR, et al. Sex differences in the relationship between C-reactive protein and body fat. J Clin Endocrinol Metab. 2009;94:3251–3258. doi: 10.1210/jc.2008-2406. [DOI] [PMC free article] [PubMed] [Google Scholar]
- 32.Pou KM, Massaro JM, Hoffmann U, et al. Visceral and subcutaneous adipose tissue volumes are cross-sectionally related to markers of inflammation and oxidative stress: The Framingham Heart Study. Circulation. 2007;116:1234–1241. doi: 10.1161/CIRCULATIONAHA.107.710509. [DOI] [PubMed] [Google Scholar]
- 33.Piche ME, Lemieux S, Weisnagel SJ, et al. Relation of high-sensitivity C-reactive protein, interleukin-6, tumor necrosis factor-alpha, and fibrinogen to abdominal adipose tissue, blood pressure, and cholesterol and triglyceride levels in healthy postmenopausal women. Am J Cardiol. 2005;96:92–97. doi: 10.1016/j.amjcard.2005.02.051. [DOI] [PubMed] [Google Scholar]
- 34.Lakka TA, Lakka HM, Rankinen T, et al. Effect of exercise training on plasma levels of C-reactive protein in healthy adults: The HERITAGE Family Study. Eur Heart J. 2005;26:2018–2025. doi: 10.1093/eurheartj/ehi394. [DOI] [PubMed] [Google Scholar]
- 35.Campbell PT, Campbell KL, Wener MH, et al. A yearlong exercise intervention decreases CRP among obese postmenopausal women. Med Sci Sports Exerc. 2009;41:1533–1539. doi: 10.1249/MSS.0b013e31819c7feb. [DOI] [PMC free article] [PubMed] [Google Scholar]
- 36.Campbell KL, Campbell PT, Ulrich CM, et al. No reduction in C-reactive protein following a 12-month randomized controlled trial of exercise in men and women. Cancer Epidemiol Biomarkers Prev. 2008;17:1714–1718. doi: 10.1158/1055-9965.EPI-08-0088. [DOI] [PMC free article] [PubMed] [Google Scholar]
- 37.Camhi SM, Stefanick ML, Ridker PM, et al. Changes in C-reactive protein from low-fat diet and/or physical activity in men and women with and without metabolic syndrome. Metabolism. 2010;59:54–61. doi: 10.1016/j.metabol.2009.07.008. [DOI] [PMC free article] [PubMed] [Google Scholar]
- 38.Obisesan TO, Leeuwenburgh C, Phillips T, et al. C-reactive protein genotypes affect baseline, but not exercise training-induced changes, in C-reactive protein levels. Arterioscler Thromb Vasc Biol. 2004;24:1874–1879. doi: 10.1161/01.ATV.0000140060.13203.22. [DOI] [PMC free article] [PubMed] [Google Scholar]
- 39.Stewart LK, Earnest CP, Blair SN, et al. Effects of different doses of physical activity on C-reactive protein among women. Med Sci Sports Exerc. 2010;42:701–707. doi: 10.1249/MSS.0b013e3181c03a2b. [DOI] [PMC free article] [PubMed] [Google Scholar]
- 40.Church TS, Earnest CP, Thompson AM, et al. Exercise without weight loss does not reduce C-reactive protein: the INFLAME study. Med Sci Sports Exerc. 2010;42:708–716. doi: 10.1249/MSS.0b013e3181c03a43. [DOI] [PMC free article] [PubMed] [Google Scholar]
- 41.Nissen SE, Tuzcu EM, Schoenhagen P, et al. Statin therapy, LDL cholesterol, C-reactive protein, and coronary artery disease. N Engl J Med. 2005;352:29–38. doi: 10.1056/NEJMoa042000. [DOI] [PubMed] [Google Scholar]
- 42.Ridker PM, Danielson E, Fonseca FA, et al. Reduction in C-reactive protein and LDL cholesterol and cardiovascular event rates after initiation of rosuvastatin: A prospective study of the JUPITER trial. Lancet. 2009;373:1175–1182. doi: 10.1016/S0140-6736(09)60447-5. [DOI] [PubMed] [Google Scholar]
- 43.Zhao Y, He X, Shi X, et al. Association between serum amyloid A and obesity: A meta-analysis and systematic review. Inflamm Res. 2010;59:323–334. doi: 10.1007/s00011-010-0163-y. [DOI] [PubMed] [Google Scholar]
- 44.Muller S, Martin S, Koenig W, et al. Impaired glucose tolerance is associated with increased serum concentrations of interleukin 6 and co-regulated acute-phase proteins but not TNF-alpha or its receptors. Diabetologia. 2002;45:805–812. doi: 10.1007/s00125-002-0829-2. [DOI] [PubMed] [Google Scholar]
- 45.Lee CG, Carr MC, Murdoch SJ, et al. Adipokines, inflammation, and visceral adiposity across the menopausal transition: A prospective study. J Clin Endocrinol Metab. 2009;94:1104–1110. doi: 10.1210/jc.2008-0701. [DOI] [PMC free article] [PubMed] [Google Scholar]
- 46.Badawi A, Klip A, Haddad P, et al. Type 2 diabetes mellitus and inflammation: Prospects for biomarkers of risk and nutritional intervention. Diabetes Metab Syndr Obes. 2010;3:173–186. doi: 10.2147/dmsott.s9089. [DOI] [PMC free article] [PubMed] [Google Scholar]
- 47.Scheja L, Heese B, Zitzer H, et al. Acute-phase serum amyloid A as a marker of insulin resistance in mice. Exp Diabetes Res. 2008;2008:230837. doi: 10.1155/2008/230837. [DOI] [PMC free article] [PubMed] [Google Scholar]
- 48.Ye XY, Xue YM, Sha JP, et al. Serum amyloid A attenuates cellular insulin sensitivity by increasing JNK activity in 3T3-L1 adipocytes. J Endocrinol Invest. 2009;32:568–575. doi: 10.1007/BF03346510. [DOI] [PubMed] [Google Scholar]
- 49.Tai CC, Ding ST. N-3 polyunsaturated fatty acids regulate lipid metabolism through several inflammation mediators: Mechanisms and implications for obesity prevention. J Nutr Biochem. 2010;21:357–363. doi: 10.1016/j.jnutbio.2009.09.010. [DOI] [PubMed] [Google Scholar]
- 50.Scheede-Bergdahl C, Benee Olsen D, Reving D, et al. Cardiovascular disease markers in type 2 diabetes: The effects of a moderate home-based exercise training programme. Diab Vasc Dis Res. 2009;6:291–296. doi: 10.1177/1479164109341689. [DOI] [PubMed] [Google Scholar]
- 51.Lee S, Gungor N, Bacha F, et al. Insulin resistance: link to the components of the metabolic syndrome and biomarkers of endothelial dysfunction in youth. Diabetes Care. 2007;30:2091–2097. doi: 10.2337/dc07-0203. [DOI] [PubMed] [Google Scholar]
- 52.Koh KK, Cardillo C, Bui MN, et al. Vascular effects of estrogen and cholesterol-lowering therapies in hypercholesterolemic postmenopausal women. Circulation. 1999;99:354–360. doi: 10.1161/01.cir.99.3.354. [DOI] [PubMed] [Google Scholar]
- 53.Bosanska L, Michalsky D, Lacinova Z, et al. The influence of obesity and different fat depots on adipose tissue gene expression and protein levels of cell adhesion molecules. Physiol Res. 2010;59:79–88. doi: 10.33549/physiolres.931705. [DOI] [PubMed] [Google Scholar]
- 54.Bosanska L, Lacinova Z, Roubicek T, et al. The influence of very-low-calorie diet on soluble adhesion molecules and their gene expression in adipose tissue of obese women. Cas Lek Cesk. 2008;147:32–37. [PubMed] [Google Scholar]
- 55.Han SH, Bae JH, Holmes DR, Jr, et al. Sex differences in atheroma burden and endothelial function in patients with early coronary atherosclerosis. Eur Heart J. 2008;29:1359–1369. doi: 10.1093/eurheartj/ehn142. [DOI] [PubMed] [Google Scholar]