

INTRODUCTION
The efficacy of any clinical intervention can be influenced substantially by any number of factors related to the treatment’s administration including dosage, frequency, route of administration and time of day. In addition, the site where the intervention is applied can be an important factor in modulating treatment efficacy. For example, site-specific anti-inflammatories such as topical Diclofenac can optimize local benefits [1] while the efficacy of chest compressions during cardio-pulmonary resuscitation has been attributed to the location of the compression site [2].
Like these examples where application site can modulate the effect of a physical intervention, spinal manipulative therapy (SMT) is a physical intervention that may exhibit maximal benefit when directed to a specific site. In general terms, SMT can be described as the application of a high velocity, low magnitude force to the surface of the body to affect the underlying articulations [3]. Used commonly to treat various musculoskeletal disorders, SMT has been shown to be beneficial for some, but not all, persons with low back pain (LBP) [4–6]. Although the ability of a clinician to provide SMT to a specific location with accuracy and reliability is not yet known, the basic question remains; as a physical intervention, is the effect of SMT modulated by the site of application?
To address this question, the effect of SMT application site on a specific SMT outcome must be assessed. While many outcome measures have been examined in association with SMT application [7–9], relatively few responsive outcomes have been identified. Spinal stiffness is a biomechanical measure [10,11] having been shown in one recent study to decrease immediately following a single SMT application in those pre-identified as “SMT responders” through a 5 item clinical prediction rule [6].
Using spinal stiffness as an outcome measure to investigate the impact of SMT application site, it is necessary to mitigate potentially confounding variables and sources of variability caused by manual SMT application [12,13] and manual stiffness measurement [14,15]. Therefore, in this experiment, an anesthetized feline model [8] was employed to decrease subject movement during SMT application and stiffness measures. In addition, a previously validated method of providing mechanized SMT and mechanized measures of stiffness [8,9] was employed. With these mechanical tools, it is possible to apply SMT at precise and repeatable coordinates with consistent mechanical characteristics (e.g. peak SMT force, SMT application rate) thereby reducing potential variability in SMT application otherwise caused by manual application. Similarly, a mechanized approach has been shown to provide reliable assessment of spinal stiffness [9,16] which is critical to measuring the effect of SMT. Given the above, the objective of the current study was to determine if the site of SMT application modulates the effect of SMT on spinal stiffness in a feline model.
METHODS
Overview
A previously described mechanical apparatus [8] was used to deliver a simulated, high-velocity SMT to the intact lumbar spine of 8 anesthetized felines at 4 anatomical SMT application sites often used in clinical care: spinous process (L6 and L7), lamina (right L6), and mammillary process (right L6). Spinal stiffness was measured before and after each SMT application. The average stiffness (k) and the terminal instantaneous stiffness (TIS) were calculated from the force-displacement curve obtained from stiffness testing. Each stiffness measure was compared before and after SMT using an ANOVA model that controlled for cat and SMT presentation order.
Feline Preparation
Experiments were performed on 8 anesthetized felines in accordance with guidelines of the Animal Care Committee at the University of Alberta. As detailed in a previous study [9], anesthesia was induced in each animal with isofluorane via inhalation, and maintained with isofluorane delivered by an endotracheal tube to enable controlled mechanical ventilation (ADS 2000, Engler, Florida, USA). Fluids were maintained intravenously. The lumbar area of each animal was shaved and the lumbar spinous processes identified through established landmarking techniques [8]. The L4 vertebra was exposed surgically and the spine stabilized at the L4 spinous process and the iliac crests using a stereotaxic system (David Kopf instruments, Tujunga, California) [8]. Ethics approval was obtained from the Animal Care Committee of the University of Alberta.
Vertebral Loading: SMT and Stiffness testing
A variable rate force/displacement (VRFD) device operating in force control mode was used to apply SMT and obtain stiffness measurements. The cat’s respiration was held at full exhalation via controlled ventilation for the duration of SMT applications and measurements of stiffness. For stiffness measurement, the VRFD was always positioned over the spinous process of the L6 vertebra. For the SMT applications, the device was successively positioned at each of 4 sites: L6 spinous process, right L6 lamina, right L6 mammillary process, and L7 spinous process. The location of each segmental SMT application point was standardized as a fixed distance from the tip of the L6 spinous identified by palpation. Distances between the L6 spinous process and each site were obtained from the average distance measured along orthogonal midsagittal and transverse axes on 3 osseous cadaveric cat spines. Relative to the L6 spinous process, the right L6 lamina application site was 7mm caudal and 3mm lateral, the L6 mammillary process site was 15mm caudal and 7mm lateral, and the L7 spinous process site was 20mm caudal. To achieve consistent and precise coordinates, the VRFD was positioned using a geared, two-dimensional gantry with integrated micrometers having an accuracy of ± 0.05mm.
Contact Load for SMT and Stiffness Testing
The force needed at each SMT application site to initiate movement of the vertebra (contact load) was specified for each SMT application site. The purpose of the contact load is to ensure that subsequent loading from SMT produces no further soft tissue compression without simultaneous movement of the vertebra. For the L6 spinous site, contact load was determined for each individual animal using a method detailed previously [9]. For the other SMT sites, contact load was determined through a prior experiment where a vertical pin was attached to the cranial edge of the L6 spinous process in 17 cats. An indentation load was then applied at each SMT application site and the resulting movement of the pin quantified with a high resolution optical recording system. Based on the results of this experiment, it was determined that site-specific contact loads could be used between all animals.(L6 lamina, 1 .71N; L6 mammillary process, 2.62N; L7 spinous process, 2.95N).
Indentation Test for Stiffness Measurement
To obtain force-displacement curves from which spinal stiffness measures are obtained, a slow indentation load was applied at the L6 spinous process before and after each SMT application [9]. Indentation was performed under linear force control to a maximum force of 16N in 4 seconds while force and displacement were recorded continuously [9].
SMT Application
To apply SMT, the site-specific contact load was first applied by the VRFD. The mechanical characteristics of the subsequent SMT application remained consistent at each of the 4 treatment sites. In detail, peak SMT load was equal to 55% of average cat’s body weight (ABW) calculated from 22 cats used in a previous study [9]. Thus, peak SMT force was held constant at 18.9N for each subject. SMT durations between 75 and 100ms were used based upon prior studies showing that at approximately 100ms, there appeared to be a threshold neural response from muscle spindles in the lumbar spine [17–19]. Consequently, the SMT loading rate was held constant at 213 N/s resulting in durations of 75, 76.6, 80.8, and 84.1 ms using L7 spinous process, L6 mammillary process, L6 lamina and L6 spinous process as the SMT application point, respectively. SMT was applied in a posterior-to-anterior direction in all application sites.
Experimental Protocol
Figure 1 shows an outline of the typical experimental procedure. Before any SMT application, 5 pre-conditioning stiffness measurements were performed 5 minutes apart to mitigate viscoelastic change in the preparation [9]. Eight SMT protocols in total were performed on each animal in order to control for the effects of contact load on any changes in stiffness: 4 SMTs with contact load (1 at each of the 4 application sites) and 4 contact loads alone (1 at each of the 4 application sites). Application of the contact load alone was used as the control intervention. An 8x8 Latin square design was used to account for variation between cats, SMT and cat presentation order.
Figure 1.

Representative protocol with timing of the experimental procedure
To measure the effect of SMT on spine stiffness, spinal stiffness testing was performed before and immediately following the SMT. The timing of the stiffness measurements relative to treatment application is shown below in Figure 1. Measurements for determining pre-SMT stiffness were recorded 4.25 min prior to the SMT, and measurements for determining post-SMT stiffness were taken 0.75 min after each SMT. A 5 min recovery period separated each SMT protocol.
Outcome Measures
Average Stiffness (k) and Terminal Instantaneous Stiffness (TIS)
From the continuously recorded force and displacement data, force vs. displacement (F-d) curves were plotted. As described previously [9], the ascending limb of the F-d curve was smoothed using a 5th order polynomial and normalized to the minimum force value. Average spine stiffness, k, was calculated from this ascending limb over a region spanning 60–90% of the total indentation load. Previously, this region was identified as being the most sensitive to changes in spinal stiffness [9]. Specifically, a linear regression line was fit to the region spanning 60–90% of total indentation load with the slope of this line representing the stiffness coefficient, k (Figure 2). Stiffness at the maximal indentation load was considered terminal instantaneous stiffness (TIS), and was calculated as the ratio between the maximum indentation load and the displacement achieved at that load.
Figure 2.

Force-displacement (F-d) curve for stiffness calculations. The average stiffness (k) and the terminal instantaneous stiffness (TIS) are calculated in the unique regions shown.
Change in Stiffness
The change in k for an individual SMT application site (Δk) was calculated as the difference between k values measured before and after SMT or control applications (i.e. kafter – kbefore). Further, the difference in Δk between SMT applications and control applications at an individual site was defined as the change in stiffness elicited by the SMT alone (Δk′). Similar variables were defined for TIS (ΔTIS and ΔTIS′).
Statistical Analysis
Repeatability
An Intraclass Correlation Coefficient (ICC(3,1)) was calculated for k and TIS to confirm that the pre-conditioning protocol sufficiently reduced viscoelastic effects using a two-way mixed model ANOVA (PASW Statistics 17.0, SPSS, IBM, Chicago, Illinois). Five values were used as input for this analysis which included the last four of the five pre-conditioning trials and the first pre-SMT indentation trial [20].
Change in average and terminal stiffness (Δk and ΔTIS) were each analyzed by fitting a linear model with terms for subject and protocol order. Mean changes in stiffness with 95% confidence intervals (CI), adjusted for subject and order, were obtained for each location by treatment combination. Differences of adjusted mean changes in stiffness between the SMT and control treatment with 95% CIs were then obtained for each location.
RESULTS
Descriptive Statistics
Mean weight (standard deviation) of the 8 cats used in the current study was 3.36 (0.25)kg. Mean baseline stiffness value (k) measured in the first five pre-conditioning trials was 8.09 (0.51)N/mm, and mean baseline value for TIS was 6.68 (0.53)N/mm.
Repeatability
Repeatability analysis resulted in ICC values of 0.99 and >0.99 for the k and TIS values, respectively. These values indicate that the tissue was viscoelastically stable, and repeatable stiffness measurements were obtained following the 5 minute rest period between measurements.
Primary Analysis
Analysis of variance tables are shown in Table 1. Subject effect was significant for both Δk (p=0.005) and ΔTIS (p=0.04), but protocol order was not significant for either stiffness metric. Table 2 summarizes the effect of the control intervention (contact load alone) and SMT plus contact load on k and TIS for all 8 protocols based on the models. The mean change in stiffness adjusted for subject and order with the corresponding 95% confidence intervals are presented and described below.
Table 1.
Analysis of variance table for mean change in average stiffness (Δk) and terminal instantaneous stiffness (ΔTIS)
| Source of Variation | Δk | ΔTIS | ||||||
|---|---|---|---|---|---|---|---|---|
| df | Mean Square | F-Statistic | p-value | df | Mean Square | F-Statistic | p-value | |
| subject | 7 | 0.667 | 3.43 | 0.005 | 7 | 0.341 | 2.35 | 0.04 |
| order | 7 | 0.060 | 0.31 | 0.95 | 7 | 0.024 | 0.17 | 0.99 |
| protocol | 7 | 0.996 | 5.13 | < 0.001 | 7 | 2.036 | 14.04 | < 0.001 |
| Error | 42 | 0.194 | 42 | 0.145 | ||||
Table 2.
Adjusted mean change (Δ) in average (k) and terminal instantaneous stiffness (TIS) measured following the application of SMT or control treatments at each location; 95% Confidence Intervals (CI) are shown.
| Location | Treatment | Δk (N/mm) | ΔTIS (N/mm) | ||||
|---|---|---|---|---|---|---|---|
| Mean | 95% | CI | Mean | 95% | CI | ||
|
| |||||||
| L6 Spinous | SMT | 0.32 | 0.00 | 0.63 | 0.02 | −0.26 | 0.29 |
| L6 Spinous | control | −0.12 | −0.43 | 0.19 | 0.49 | 0.22 | 0.77 |
| L6 Lamina | SMT | −0.48 | −0.79 | −0.16 | −0.85 | −1.12 | −0.58 |
| L6 Lamina | control | −0.18 | −0.50 | 0.13 | −0.41 | −0.68 | −0.14 |
| L6 Mammillary | SMT | −0.68 | −0.99 | −0.36 | −0.96 | −1.24 | −0.69 |
| L6 Mammillary | control | −0.78 | −1.09 | −0.46 | −0.87 | −1.14 | −0.60 |
| L7 Spinous | SMT | −0.53 | −0.84 | −0.21 | −0.72 | −0.99 | −0.45 |
| L7 Spinous | control | −0.25 | −0.57 | 0.06 | −0.53 | −0.80 | −0.26 |
Effect of SMT on Average Stiffness (k)
As detailed in Table 2, and shown graphically in Figure 3, SMT applied at the L6 spinous significantly increased the mean change in average stiffness (Δk = 0.32 N/mm [0.00,0.63], upper, lower 95% CI), whereas a significant decrease was observed after every other SMT and control intervention. The SMT-only (signified by k′) induced change in average stiffness at each SMT application site are shown in Table 3. Only SMT applied at the L6 spinous process significantly affected (p=0.05) average stiffness increasing it by a mean of 0.44N/mm [0.00, 0.88]. SMT given at the other SMT application sites did not affect average stiffness significantly.
Figure 3.
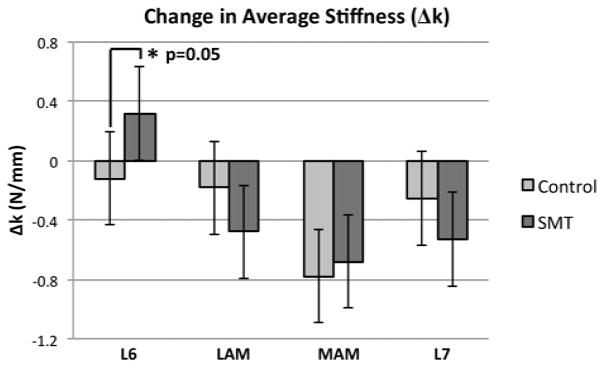
Adjusted mean change in average stiffness measured following SMT and control applications, at each of the 4 SMT application sites. Significant differences are identified by an asterisk.
Table 3.
SMT-only induced adjusted mean change in average stiffness (Δk′, calculated as the difference between the Δk measured following SMT and the Δk measured following the control treatment) and terminal instantaneous stiffness (ΔTIS′) at each SMT application site.
| Location | Δk′ (N/mm) | ΔTIS′ (N/mm) | ||||||
|---|---|---|---|---|---|---|---|---|
| Mean | 95% | CI | p-value | Mean | 95% | CI | p-value | |
| L6 Spinous | 0.44 | 0.00 | 0.88 | 0.05 | −0.48 | −0.86 | −0.09 | 0.02 |
| L6 Lamina | −0.29 | −0.74 | 0.15 | 0.19 | −0.44 | −0.82 | −0.05 | 0.03 |
| L6 Mamillary | 0.10 | −0.35 | 0.54 | 0.66 | −0.09 | −0.48 | 0.29 | 0.33 |
| L7 Spinous | −0.28 | −0.72 | 0.17 | 0.22 | −0.19 | −0.57 | 0.20 | 0.62 |
Effect of SMT on Terminal Instantaneous Stiffness (TIS)
Table 2 and Figure 4 summarize the effects of SMT and the control intervention on changes in ΔTIS (N/mm). The adjusted mean ΔTIS significantly increased following the application of the control (0.49N/mm; [0.22, 0.77]) but not following SMT applied at the L6 spinous. The mean ΔTIS significantly decreased following both the control intervention and SMT at the remaining three anatomic sites. Table 3 displays the differences in adjusted mean ΔTIS compared to control representing the effect of SMT alone on spinal stiffness. SMT had a significant effect on mean ΔTIS when it was applied at the L6 spinous (p=0.02) and at the L6 lamina (p=0.03). Specifically, SMT applied at the L6 spinous significantly decreased ΔTIS by −0.48N/mm [−0.86, −0.09], while application at the lamina significantly decreased ΔTIS by −0.44N/mm [−0.82,−0.05]. These results are shown graphically in Figure 4.
Figure 4.
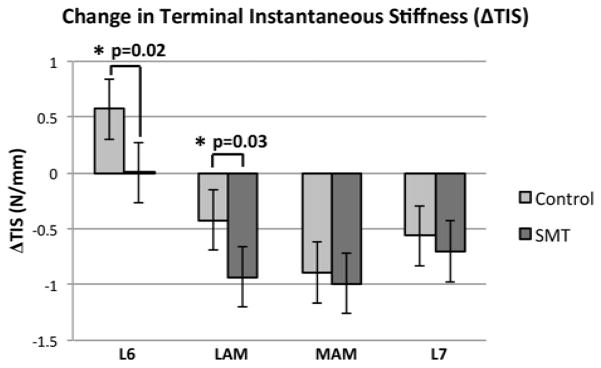
Adjusted mean change in terminal instantaneous stiffness measured following SMT and control applications, at each of the 4 SMT application sites. Significant differences are identified by an asterisk.
DISCUSSION
Given that the location of an applied physical intervention is often considered important for eliciting a treatment effect, the purpose of this study was to understand if the application site of SMT modulates a biomechanical response, namely spinal stiffness. The rationale for this objective was that the force applied during SMT application is believed to affect the local spinal tissues, and therefore, the proximity of the application site to those tissues may be relevant to the impact of SMT on altering the mechanics (i.e. stiffness) of those tissues. In the current study, significant post-SMT changes in spinal stiffness (relative to the control treatment) were observed at the L6 spinous and lamina application sites but not at the remaining two sites. While previous studies have investigated the effect of an SMT on spine stiffness, to the authors’ knowledge, this is the first study describing the effect of the SMT application site on outcomes measures related to SMT.
The mechanisms by which SMT is thought to convey a clinical benefit are not well-defined; however, a reduction in spinal stiffness (specifically in TIS) following SMT has been shown recently in a single study in which patients who reported improvement following SMT application [6]. While there are several possible explanations for this result, it is not known if differences in SMT application parameters (e.g SMT application site, loading rate, peak SMT amplitude) observed to occur with manual SMT application may have contributed to stiffness differences between experimental groups. In clinical studies, the mechanical characteristics of SMT are difficult to control (let alone measure), and are rarely reported. In fact, we are aware of only one other study that investigated the effect of specific SMT parameters (force/displacement magnitude and duration) on spine stiffness [9] but this study was performed in an animal model. With ongoing limitations in measuring SMT parameters in human trials, understanding the effect of SMT application parameters on changes in spinal stiffness remains presently in the realm of animal models.
The direction of change in TIS in this feline study was similar to that in a clinical study involving back pain patients receiving SMT. In that study, Fritz et al. [6] showed that in humans, an immediate and significant decrease in TIS occurred following SMT treatment in two sessions separated by 3 to 4 days. In addition, the magnitude of the decrease in TIS was similar to the current findings in the cat spine. Specifically, in the current cat study, TIS decreased by a mean of −0.48 and −0.44N/mm following SMT at the L6 spinous and L6 lamina, respectively while in Fritz et al.’s study [6], TIS decreased by a mean of −0.39 and −0.34 N/mm following two clinical sessions. In both studies, spine stiffness was measured at the spinous process and was calculated as the ratio between the maximal force achieved during indentation testing and the associated displacement of the indenter. Although the treatment location was different in the two studies, these results (magnitude and direction of change in TIS) suggest that feline and human subjects may share similar biomechanical responses to SMT treatment.
There are other parallels between the findings of the current study and those of other investigations. In the current study, average stiffness (k) was less responsive than terminal instantaneous stiffness (TIS). A significant change in k was only observed when SMT was applied at the L6 spinous, compared to TIS which showed significant changes following SMT applied at the L6 spinous and lamina. In the study by Fritz et al. [6], k was also shown to be less responsive than terminal instantaneous stiffness (TIS) following SMT application. Fritz et al. observed a small, 0.12N/mm decrease in k following the first session of SMT and no significant change in a second session, while TIS demonstrated larger decreases (0.39 and 0.34N/mm) after both sessions. Although some prior studies have reported an increase in spinal stiffness following SMT [9,20], the experimental protocols used in these studies did not randomize the order of treatments to minimize potential order effects as was the case in the present study with the use of a Latin Square design.
The results of the current study also suggest that a significant decrease in spinal stiffness can occur in asymptomatic spines. This observation is contrary to prior suggestions that spinal stiffness values in asymptomatic subjects reside near a minimal value [9]. Because there was no post-SMT tissue damage or injury from applied SMT observed in the current study (consistent with SMT provided to asymptomatic humans), the results suggest that baseline spinal stiffness in an asymptomatic spine may be larger than the minimal possible value.
In the current study, the significant change in average spinal stiffness (Δk′ = 0.44N/mm) was similar in magnitude, but opposite in direction to the change measured in ΔTIS′ (−0.48N/mm) following SMT at the L6 spinous process. Insight into this finding is not readily available, but is informed by a previous study using the same asymptomatic feline model [9] where a gradual increase in k was observed over repeated SMT application. In that study, speculation was made that the observed increase in stiffness was the result of viscoelastic change caused from insufficient fluid recovery. Because k describes the rate of change in applied force (and the resulting displacement) over the entire indentation, the viscoelastic phenomenon may affect this rate-dependent variable more than it would TIS which describes a single point in the indentation. As the fluids of each feline were maintained intravenously, we are not aware of any other method to manage between-trial changes in stiffness short of increasing recovery times between measurements.
Clearly, the results of this study suggest that different variables used to characterize and quantify stiffness (k vs. TIS) respond differently to SMT both in magnitude and over time. The primary difference between these two stiffness metrics is that k (or any average stiffness metric) reflects the rate of change of applied force and the resulting displacement, while TIS reflects the maximum load and corresponding displacement achieved in an indentation. This circumstance is reflected in the current literature where there are considerable differences in how stiffness is measured and the way in which stiffness is thought to respond following SMT. Most commonly, spinal stiffness is quantified by an average value extracted from the F-d curve; however, the boundaries of the region used to define the average stiffness vary between studies. In some studies, the non-linear toe-region [21–23] of the curve is used to quantify stiffness, while other studies use the middle, most linear portion of the curve [6,9,23–25]. It is possible that the different methods in how stiffness is characterized contribute to the quantitative inconsistencies in the literature regarding the biomechanical effects of SMT. Regardless of the stiffness metric employed, the results of the current study show that in an asymptomatic feline model, SMT application site modulates the spine’s stiffness response. Further work is needed to elucidate the role of different variables in characterizing changes in spinal stiffness arising from SMT.
Although the experimental protocol used in this current study was not designed to explore the mechanisms by which SMT application site modulated spinal stiffness, it is possible to speculate about the mechanisms underlying these observations. First, different application sites have different amounts of soft tissue between the skin and the vertebra [26]. This creates the possibility that SMT forces are attenuated differently at different application sites. For example, it would be expected that soft tissue dampening would be minimum over a boney prominence, such as a spinous process. Conversely, soft tissue thickness increases at locations lateral to the midline. While the distribution of forces experienced by the underlying spinal tissues is likely to be different between the two application sites, the similar decreases in TIS between the L6 spinous (minimal soft tissue) and the L6 lamina (maximal soft tissue) suggest a shared biomechanical mechanism.
Beyond the effects of soft tissue thickness, the underlying spinal anatomy may affect the mechanical transmission of SMT force as well. Differences in the ligamentous connections between vertebrae may alter the transmission of SMT force differently from different application sites. Presently, it is not known if internal forces within the spine differ as a result of different SMT application sites but related literature suggests that vertebra translate and rotate in differently when SMT forces are applied at different sites [7,27,28]. Although the complexities of these interactions are difficult to predict, the mechanics of the spine are very likely to modulate the efficacy of SMT treatment.
CONCLUSION
Decreases in terminal spinal stiffness were observed following SMT delivered at some application sites but not others. The results suggest that the SMT application site modulates SMT’s effect on spinal stiffness in a feline model. Changes in terminal instantaneous spinal stiffness were similar in magnitude and direction to those observed in symptomatic human subjects who report benefits following SMT.
Acknowledgments
The authors would like to thank the staff of the HSLAS for their assistance in this project. This project was supported by NIH Grant U19 AAT004137 to JG Pickar and GN Kawchuk. Support for GN Kawchuk is provided by the Canada Research Chairs Program.
Footnotes
Publisher's Disclaimer: This is a PDF file of an unedited manuscript that has been accepted for publication. As a service to our customers we are providing this early version of the manuscript. The manuscript will undergo copyediting, typesetting, and review of the resulting proof before it is published in its final citable form. Please note that during the production process errors may be discovered which could affect the content, and all legal disclaimers that apply to the journal pertain.
References
- 1.Barkin R. Topical Nonsteroidal Anti-Inflammatory Drugs: The Importance of Drug, Delivery, and Therapeutic Outcome. Am J Ther. 2012 doi: 10.1097/MJT.0b013e3182459abd. Epub ahead of print. [DOI] [PubMed] [Google Scholar]
- 2.Baubin M, Kollmitzer J, Pomaroli A, et al. Force distribution across the heel of the hand during simulated manual chest compression. Resuscitation. 1997;35(3):259–263. doi: 10.1016/s0300-9572(97)00040-3. [DOI] [PubMed] [Google Scholar]
- 3.Haldeman S, Phillips RB. Spinal manipulative therapy in the management of low back pain. In: Frymoyer JW, Ducker TB, Hadler NM, Kostuik JP, Weinstein JN, Whitecloud TS, editors. The adult spine: principles and practice. New York: Raven Press, Ltd; 1991. pp. 1581–605. [Google Scholar]
- 4.Bronfort G, Haas M, Evans R, Bouter L. Efficacy of spinal manipulation and mobilization for low back pain and neck pain: a systematic review and best evidence synthesis. Spine J. 2004;4:33–356. doi: 10.1016/j.spinee.2003.06.002. [DOI] [PubMed] [Google Scholar]
- 5.Childs J, Fritz J, Flynn T, et al. A clinical prediction rule to identify patients with low back pain most likely to benefit from spinal manipulation. Ann Intern Med. 2004;141:920–928. doi: 10.7326/0003-4819-141-12-200412210-00008. [DOI] [PubMed] [Google Scholar]
- 6.Fritz J, Koppenhaver S, Kawchuk G, Teyhen D, Hebert J, Childs J. Preliminary investigation of the mechanisms underlying the effects of manipulation. Spine. 2011;36(21):1772–1781. doi: 10.1097/BRS.0b013e318216337d. [DOI] [PMC free article] [PubMed] [Google Scholar]
- 7.Colloca C, Keller T, Gunzburg R. Biomechanical and neurophysiological responses to spinal manipulation in patients with lumbar radiculopathy. J Manipulative Physiol Ther. 2004;27(1):1–15. doi: 10.1016/j.jmpt.2003.11.021. [DOI] [PubMed] [Google Scholar]
- 8.Pickar J. An in vivo preparation for investigating neural responses to controlled loading of a lumbar vertebra in the anesthetized cat. J Neurosci Methods. 1999;89:87–96. doi: 10.1016/s0165-0270(99)00060-6. [DOI] [PubMed] [Google Scholar]
- 9.Vaillant M, Edgecombe T, Long C, Pickar J, Kawchuk G. The effect of duration and amplitude of spinal manipulative therapy (SMT) on spinal stiffness. Man Ther. 2012;17(6):577–583. doi: 10.1016/j.math.2012.06.006. [DOI] [PMC free article] [PubMed] [Google Scholar]
- 10.Latimer J, Goodsell M, Lee M, Maher C, Wilkinson B, Moran C. Evaluation of a new device for measuring responses to posteroanterior forces in a patient population, Part 1: reliability testing. Phys Ther. 1996;76:158–165. doi: 10.1093/ptj/76.2.158. [DOI] [PubMed] [Google Scholar]
- 11.Murphy D, Craig M. Manual examination of the patient. In: Haldeman S, editor. Principles and practice of chiropractic. New York: McGraw Hill; 2005. pp. 593–610. [Google Scholar]
- 12.Herzog W. The biomechanics of spinal manipulation. J Bodyw Mov Ther. 2010;14(3):280–286. doi: 10.1016/j.jbmt.2010.03.004. [DOI] [PubMed] [Google Scholar]
- 13.Herzog W, Kats M, Symons B. The effective forces transmitted by high-speed, low-velocity thoracic manipulation. Spine. 2001;26(19):2105–2111. doi: 10.1097/00007632-200110010-00012. [DOI] [PubMed] [Google Scholar]
- 14.Kawchuk G, Fauvel R. Sources of variation in spinal indentation testing: identation site relocation, intraabdominal pressure, subject movement, muscular response, and stiffness estimation. J Manipulative Physiol Ther. 2001;24(2):84–91. doi: 10.1067/mmt.2001.112566. [DOI] [PubMed] [Google Scholar]
- 15.Owens E, Jr, DeVocht J, Gudavalli M, Wilder D, Meeker W. Comparison of posteroanterior spinal stiffness measures to clinical and demographic findings at baseline in patients enrolled in a clinical study of spinal manipulation for low back pain. J Manipulative Physiol Ther. 2007;30(7):493–500. doi: 10.1016/j.jmpt.2007.07.009. [DOI] [PMC free article] [PubMed] [Google Scholar]
- 16.Vaillant M, Pickar J, Kawchuk G. Performance and reliability of a variable rate, force/displacement application system. J Manipulative Physiol Ther. 2010;33(8):585–593. doi: 10.1016/j.jmpt.2010.08.020. [DOI] [PMC free article] [PubMed] [Google Scholar]
- 17.Pickar JG, Sung PS, Kang YM, Ge W. Response of lumbar paraspinal muscle spindles is greater to spinal manipulative loading compared with slower loading under length control. Spine J. 2007;7:583–595. doi: 10.1016/j.spinee.2006.10.006. [DOI] [PMC free article] [PubMed] [Google Scholar]
- 18.Pickar JG, Kang YM. Paraspinal muscle spindle responses to the duration of a spinal manipulation under force control. J Manipulative Physiol Ther. 2006;29:22–31. doi: 10.1016/j.jmpt.2005.11.014. [DOI] [PubMed] [Google Scholar]
- 19.Reed WR, Cao D-Y, Kawchuk GN, Pickar JG. Society for Neuroscience. San Diego, CA: 2010. Nov 13–17, Effects of manipulation’s mechanical characteristics (magnitude and duration) on paraspinal muscle spindle discharge. Program No. 182.17 Abstract Viewer/Itinerary Planner. [Google Scholar]
- 20.Shirley D, Ellis E, Lee M. The response of posteroanterior lumbar stiffness to repeated loading. Man Ther. 2002;7(1):19–25. doi: 10.1054/math.2001.0432. [DOI] [PubMed] [Google Scholar]
- 21.Lee M, Svensson N. Effect of loading frequency on response of the spine to lumbar posteroanterior forces. J Manipulative Physiol Ther. 1993;16(7):439–446. [PubMed] [Google Scholar]
- 22.Nicholoson L, Maher C, Adams R, Phan-Thien N. Stiffness properties of the human lumbar spine: A lumped parameter model. Clin Biomech. 2001;16:285–292. doi: 10.1016/s0268-0033(00)00117-0. [DOI] [PubMed] [Google Scholar]
- 23.Edmondston S, Allison G, Gregg C, Purden S, Svansson G, Watson A. Effect of position on the posteroanterior stiffness of the lumbar spine. Man Ther. 1998;3(1):21–26. doi: 10.1054/math.1998.0312. [DOI] [PubMed] [Google Scholar]
- 24.Kumar S, Stoll S. Device, protocol and measurement of regional spinal stiffness. J Electromyogr Kinesiol. 2011;21:458–465. doi: 10.1016/j.jelekin.2011.01.001. [DOI] [PubMed] [Google Scholar]
- 25.Kumar S. Spinal stiffness in asymptomatic subjects. J Electromyogr Kinesiol. 2011;21:762–766. doi: 10.1016/j.jelekin.2011.07.008. [DOI] [PubMed] [Google Scholar]
- 26.Kawchuk G, Prasad N, Parent E, Chapman S, Custodio M, Manzon M, Wiebe A, Dhillon S. Spinal landmark depth in relation to body mass index. Man Ther. 2011;16(4):384–387. doi: 10.1016/j.math.2011.01.007. Epub 2011 Feb 17. [DOI] [PubMed] [Google Scholar]
- 27.Gal J, Herzog W, Kawchuk G, Conway P, Zhang Y. Movements of vertebrae during manipulative thrusts to unembalmed human cadavers. J Manipulative Physiol Ther. 1997;20(1):30–40. [PubMed] [Google Scholar]
- 28.Kawchuk G, Perle S. The relation between the application angle of spinal manipulative therapy (SMT) and resultant vertebral accelerations in an in situ porcine model. Man Ther. 2009;14(5):480–483. doi: 10.1016/j.math.2008.11.001. [DOI] [PubMed] [Google Scholar]