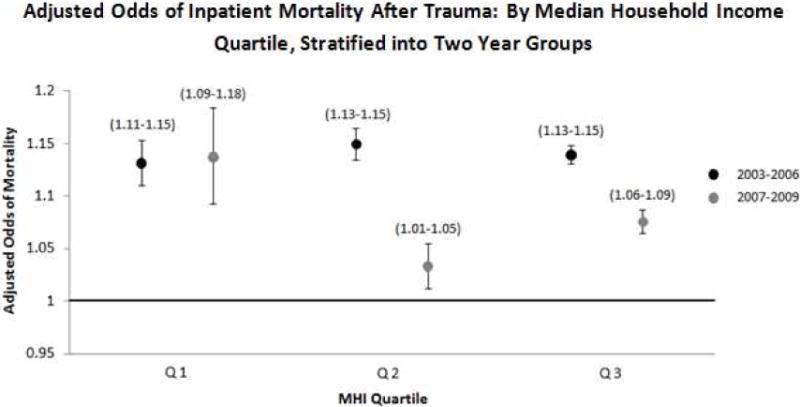
Figure 2.

Adjusted odds of inpatient mortality following traumatic injury in adults aged 18–65 with ISS≥9= stratified into two year groups. The reference group is median household income (MHI) quartile 4 (Q4), the wealthiest quartile. MHI Q2 and Q3 show decreased odds of mortality in the 2007–2009 group compared to their respective 2003–2006 group odds of mortality values. MHI Q1 shows no difference in the increased odds of mortality between the groups. Vertical bars and values in brackets indicate 95% confidence intervals.
