

Abstract
Bovine tuberculosis (BTB) is a significant and intractable disease of cattle caused by Mycobacterium bovis. In the UK, despite an aggressive eradication programme, the prevalence of BTB is increasing with an unexplained, exponential rise in cases year on year. Here we show in a study involving 3026 dairy herds in England and Wales that there is a significant negative association between exposure to the common, ubiquitous helminth parasite, Fasciola hepatica and diagnosis of BTB. The magnitude of the single intradermal comparative cervical tuberculin test used to diagnose BTB is reduced in cattle experimentally co-infected with M. bovis and F. hepatica. We estimate an under-ascertainment rate of about one-third (95% Confidence Intervals 27-38%) among our study farms, in the hypothetical situation of no exposure to F. hepatica. This finding may in part explain the continuing spread of BTB and the failure of the current eradication programme in the UK.
Accurate diagnosis of an infectious disease is vital for its control, eradication and for the treatment of affected individuals. The diagnosis of many diseases requires detection of the host’s immune response to the causative agent. Some pathogens, notably helminth parasites, impair their host’s immune response, increasing susceptibility to infection and also affecting the sensitivity of immunologically based diagnostic tests.
Bovine tuberculosis (BTB), caused by Mycobacterium bovis, is a serious disease of cattle; affected animals show loss of productivity and the economic consequences for countries with endemic BTB are exacerbated by international restrictions placed on bovine exports 1. M. bovis is an important zoonosis; it is estimated to be responsible for approximately 10% of human tuberculosis (TB) in Africa 2 and historically was a major public health problem in Europe, with approximately 2,500 deaths occurring annually in the UK in the 1930’s before pasteurisation of milk was introduced 3. BTB has been eradicated in several countries including much of the EU, Australia, Canada and most of the USA but it is still endemic in UK, Ireland and New Zealand.
The UK has had an eradication programme in place since 1950s, based on diagnosis using the Single Intra-dermal Comparative Cervical Tuberculin (SICCT) test and immediate slaughter of positive animals, yet the incidence of BTB has increased exponentially in recent years. The number of new herd incidents in Great Britain in 2009 was 4,525 and government expenditure on the eradication programme was £108.4 million. The number of cattle slaughtered in 2010 was 32,411 (4,703 new herd incidents) and provisional statistics suggest an overall increase in TB incidence rate of 5.8% in 2011 compared to the same period in 2010 4. By comparison, in 1999 the total cost of controlling BTB was £8.2 million with 1,666 new herd incidents recorded 5. It has proved difficult to account not only for the increase in new incidents of BTB within endemic areas but also the spread of infection into new areas. Several factors have been identified as contributing to this increase such as cattle movements and reservoirs of infection within wildlife species, notably the Eurasian badger (Meles meles) 6. Restrictions are now placed on cattle movements with pre-movement testing introduced in 2001, but despite this, incidence is continuing to increase with spread predominantly local but with a small number of long range jumps 5,7.
The SICCT test, approved for use in the EU and the principal test used in UK and Ireland for ante-mortem identification of infected animals, measures a delayed type hypersensitivity response to the tuberculin antigen Purified Protein Derivative (PPD) and is dependent on functional antigen specific T cells and their capacity to secrete interferon-γ (IFN-γ). The diagnostic sensitivity of the SICCT test is estimated to be between 52-100% with a median value of 80% using the standard interpretation of the test9. Several factors may account for the poor sensitivity of the SICCT test; one factor which has been considered but not fully evaluated in the field is the effect of concurrent infection with pathogens that may suppress the immune response to M. bovis 8.
Fasciola hepatica is a common trematode parasite of livestock worldwide. The prevalence of F. hepatica infection has increased substantially between 2000-2009 in the UK, partly due to changes in the climate that foster the development of the intermediate host and free living stages of the parasite9, partly due to changes in land use, in particular drainage practices 10,11, and partly due to the lack of drugs licensed for use in milking cattle and increasing evidence of resistance to triclabendazole 12, a drug commonly used for the treatment of F. hepatica infection. Recent estimates indicate a herd-level prevalence of 70-80% in the UK dairy herd 13. F. hepatica is known to induce an anti-inflammatory state in its host; pro-inflammatory cytokine responses are suppressed, increasing susceptibility to intra-cellular pathogens normally controlled by pro-inflammatory responses, such as Bordetella pertussis and Salmonella Dublin 14,15. In cattle experimentally co-infected with F. hepatica and M. bovis Bacille Calmette Guerin (BCG), the SICCT test and PPD specific IFN-γ responses were negative in 7/9 and 8/9 animals respectively whereas four out of five cattle infected with BCG alone were positive by both SICCT and the IFN-γ tests 16. This trend was true irrespective of whether BCG was given before or after F. hepatica. These observations led us to investigate if F. hepatica infection in cattle compromises the sensitivity of the SICCT test used in the UK to diagnose BTB in the field.
We show here that a significant negative association exists between exposure to F. hepatica and diagnosis of BTB, and that the magnitude of the SICCT test used to diagnose BTB is reduced in cattle experimentally co-infected with M. bovis and F. hepatica. These results indicate that in the presence of F. hepatica, the SICCT test used to diagnose BTB, is compromised; we estimate that in our study farms, in the hypothetical situation of no exposure to F. hepatica, there is an under-ascertainment rate of about one-third (95% Confidence Intervals =27-38%). This finding may in part explain the continuing spread of BTB and the failure of the current eradication programme in the UK.
Results
Prevalence of BTB and F. hepatica in England and Wales
Data on the prevalence of BTB and exposure to F. hepatica in 3026 dairy herds in England and Wales were collected and the national smoothed prevalence for each pathogen calculated (Figure 1a and b). Smoothed BTB prevalence in 2004-2007 was highest in the south and west of England and Wales (Figure 1a). Three large clusters are apparent: northern Cornwall and Devon; the south Midlands; and the southwest of Wales. A fourth, smaller and less intense cluster is visible north of the Midlands, centred on Derbyshire. This map of BTB prevalence presents a similar picture to previous maps of BTB distribution in Great Britain calculated from all beef and dairy farms rather than, as here, a sample of dairy farms which were originally tested for exposure to F. hepatica using a bulk tank milk test6.
Figure 1. Smoothed distribution of bovine tuberculosis and Fasciola hepatica.
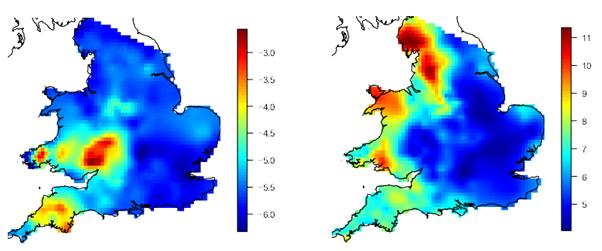
(a) Smoothed log-odds of an individual dairy animal having been detected as BTB-positive in 2004-2007. Bovine tuberculosis data for 3026 farms also tested for exposure to F. hepatica, were obtained from the UK Department for Environment, Food and Rural Affairs (DEFRA) VETNET database. A data cleaning process was undertaken to ensure only records pertaining to actual livestock tests were analysed; (b) Smoothed square root of the percent positive (PP) value for F. hepatica. To determine the prevalence of exposure to F. hepatica, bulk milk samples were obtained from the same 3026 dairy farms in England and Wales and tested using an antibody detection ELISA. Samples were obtained from three major milk testing companies in England and Wales between November 2006 and January 2007
The smoothed F. hepatica percent positivity (pp) value was greatest in the west of Britain (Figure 1b). Four major clusters are the northwest of England (Cumbria), an adjoining cluster stretching south through Lancashire to the north Midlands; the northwest of Wales and a small part of the southwest Wales. Some parts of Cornwall and Devon in the far southwest have moderate F. hepatica pp-values.
Comparison of Figures 1a and 1b shows that there is almost no overlap in the west of England and Wales in the distributions of the intense clusters of BTB prevalence and F. hepatica pp-value. In the northwest of England and the northwest of Wales, F. hepatica pp-values are high, and BTB is of very low prevalence. In south Wales, the cluster of high F. hepatica pp-values lies approximately between two clusters of high BTB prevalence. In the Midlands, a large area of high BTB prevalence is of low F. hepatica pp-value. In Cornwall and Devon, and in the north Midlands, both BTB prevalence and F. hepatica pp-values are at moderate levels. In contrast to the situation in the west of England and Wales, both BTB prevalence and F. hepatica pp-values are low in most of the east of England.
Multivariable logistic regression models for BTB
One hypothesis for the strong negative spatial association between BTB and F. hepatica is that the two infections do not directly interact, but that a mutually exclusive set of environmental conditions favour BTB 6,7 and F. hepatica 10 respectively. To test this hypothesis, we developed a model for BTB, based on a previously published model that successfully predicts BTB presence or absence using a combination of environmental and farm level variables, including animal movements between farms6. If BTB presence or absence is not affected by F. hepatica, then smoothed square-root-transformed F. hepatica pp-value (our variable, Fasciola_PP) should not explain any additional variance in a statistical model for BTB driven by environmental, farm and movement variables. We therefore developed a multivariable logistic regression model for the occurrence of BTB using a sample of 1821 farms, with model validation undertaken on the remaining subset, using proxies of the most important published variables 6,7, with and without F. hepatica (Table 1+2). In the best model excluding F. hepatica, proxies of six variables found to be significant in previous studies 6,7 were highly significant (all p < 0.001), as was herd size (p < 0.001). The risk of BTB being present on a farm increases with higher average temperature and more variable temperature and increases slightly with the normalised difference vegetation index (NDVI), but decreases with higher vapour pressure deficit (VPD). The risk increases when the nearest neighbouring farm has a higher probability of being BTB-positive and for larger herd sizes, and the risk decreases with larger numbers of movements off the farm. Importantly, when we add Fasciola_PP to the model, all the variables remain significant (with negligible change in coefficients and odds ratios) but Fasciola_PP has an additional, significant, negative effect on the odds of BTB being present on a farm (OR = 0.61; 95% CI = 0.56-0.67, P < 0.001; Table 1). The model which includes Fasciola_PP fits the data significantly better than the model without that variable (difference in deviance = 126.22, P< 0.001). We therefore conclude that F. hepatica is an additional environmental risk factor for BTB and is negatively associated with the odds of BTB being diagnosed on a farm.
Table 1. Multivariable logistic regression model of BTB occurrence including smoothed square root of F. hepatica PP value.
| Predictor | Coefficient | SE | P | OR | L 95% CI | U 95% CI |
|---|---|---|---|---|---|---|
| Constant | −33.561 | 3.861 | <0.001 | |||
| Fasciola_PP | −0.486 | 0.046 | <0.001 | 0.61 | 0.56 | 0.67 |
| NN_BTB | 0.467 | 0.223 | 0.036 | 1.59 | 1.03 | 2.47 |
| HerdSize | 0.163 | 0.022 | <0.001 | 1.18 | 1.13 | 1.23 |
| NDVI | 0.015 | 0.002 | <0.001 | 1.02 | 1.01 | 1.02 |
| Sqrt MOff | −0.089 | 0.017 | <0.001 | 0.91 | 0.88 | 0.95 |
| MeanT | 1.196 | 0.154 | <0.001 | 3.31 | 2.45 | 4.47 |
| VPD | −2.344 | 0.352 | <0.001 | 0.10 | 0.05 | 0.19 |
| TVar | 0.071 | 0.036 | 0.048 | 1.07 | 1.00 | 1.15 |
Log-likelihood = −953.26
Abbreviations and definitions: Fasciola_PP, smoothed square root of F. hepatica percentage positive ELISA value; NN_BTB, nearest neighbour’s smoothed BTB probability; HerdSize, square root of herd size; NDVI, normalised difference vegetation index is a measure of vegetation greenness; SqrtMOff, square root of movements off farm; MeanT, mean temperature (°C); VPD, Vapour Pressure Deficit is a measure of lack of moisture equilibrium between an object and the atmosphere, the higher the VPD, the more rapid the rate of desiccation; TVar, temperature variance, indicates the magnitude of the seasonality, i.e. larger values indicate larger differences between winter and summer extremes; OR, odds ratio; L/U 95% CI, lower and upper 95% confidence intervals of OR.
Table 2. Multivariable logistic regression model of BTB occurrence excluding smoothed square root of F. hepatica PP value.
| Predictor | Coefficient | SE | P | OR | L 95% CI | U 95% CI |
|---|---|---|---|---|---|---|
| Constant | −30.045 | 3.577 | <0.001 | |||
| NN_BTB | 1.020 | 0.213 | <0.001 | 2.77 | 1.83 | 4.21 |
| HerdSize | 0.182 | 0.021 | <0.001 | 1.20 | 1.15 | 1.25 |
| NDVI | 0.009 | 0.002 | <0.001 | 1.01 | 1.01 | 1.01 |
| Sqrt MOff | −0.090 | 0.016 | <0.001 | 0.91 | 0.89 | 0.94 |
| MeanT | 1.350 | 0.147 | <0.001 | 3.86 | 2.90 | 5.14 |
| VPD | −2.443 | 0.335 | <0.001 | 0.09 | 0.05 | 0.17 |
| TVar | 0.158 | 0.034 | <0.001 | 1.17 | 1.10 | 1.25 |
Log-likelihood = −1016.374
Abbreviations and definitions: Fasciola_PP, smoothed square root of F. hepatica percentage positive ELISA value; NN_BTB, nearest neighbour’s smoothed BTB probability; HerdSize, square root of herd size; NDVI, normalised difference vegetation index is a measure of vegetation greenness; SqrtMOff, square root of movements off farm; MeanT, mean temperature (°C); VPD, Vapour Pressure Deficit is a measure of lack of moisture equilibrium between an object and the atmosphere, the higher the VPD, the more rapid the rate of desiccation; TVar, temperature variance, indicates the magnitude of the seasonality, i.e. larger values indicate larger differences between winter and summer extremes; OR, odds ratio; L/U 95% CI, lower and upper 95% confidence intervals of OR.
The effect of Fasciola_PP on the odds of detection of BTB, after the inclusion of environmental and farm-level variables, is robust at smaller spatial scales than England and Wales, including both countries separately, southern England and southwest Wales.
Under-ascertainment rate of BTB in absence of F. hepatica
To assess the impact of F. hepatica on BTB detection in England and Wales, we estimated the probability of farms having BTB given their environmental and farm-level characteristics, in the presence and (hypothetical) absence of F. hepatica. The results indicate that, in the absence of F. hepatica, the probability of farms being diagnosed with BTB would increase substantially in several parts of England and Wales (Figure 2). The most marked increases are in the southwest, Wales, the northern Midlands (Derbyshire) and Lancashire and Cumbria in the northwest. Using our model, we estimate that in the hypothetical absence of F. hepatica, the detected prevalence of BTB in our study farms would increase from 35.5% to 53%, a difference of 17.5% (95% CI, 14.5-20.4%). This equates to an under-ascertainment rate in our study farms of about one third (0.175/0.53; 95% CI = 27-38%).
Figure 2. Map showing the estimated effect of presence or absence of F. hepatica.
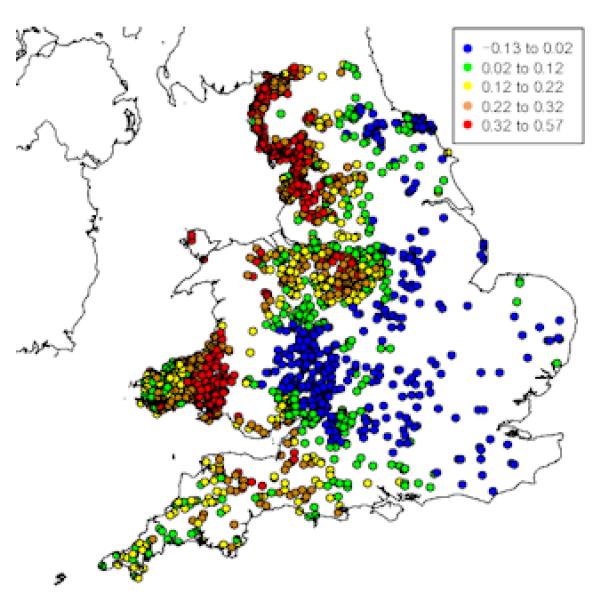
Modelled probabilities of BTB in the presence or hypothetical absence of F. hepatica were obtained from the fitted values of the final model, with pp value either as found or set to 27, respectively. The difference between the two probabilities (pp=27 minus pp as found) varied between −0.13 and +0.57. The map shows the location of each farm, jittered randomly within a circular disc of radius 5km to preserve confidentiality and colour-coded by quintiles whose ranges are shown on the legend at the top-right corner of the map.
Experimental infection of calves with M. bovis and F. hepatica
The negative association between the presence of F. hepatica and detection of BTB could be explained by F. hepatica impairing the SICCT test used to diagnose BTB since there is evidence to suggest that F. hepatica infections reduced bystander IFN-γ responses and compromised SICCT tests in calves infected with BCG, an avirulent strain of BTB 16. To address this, six calves were experimentally infected with 150 metacercariae of F. hepatica, four weeks later they were challenged with a target dose of 5 × 10² CFU of a virulent strain of M. bovis; six calves were infected with M. bovis alone. SICCT tests were conducted 10 and 21 weeks after M. bovis infection (Table 3). The data were analysed using a linear mixed effects model fitted by maximum likelihood with week and co-infection as fixed effects and cow as a random effect. SICCT responses of co-infected cattle were significantly less than animals infected with M. bovis alone (p=0.011); and were significantly less at week 21 post infection compared to week 10 post infection (p=0.0013). The effect of co-infection did not change between 10 and 21 weeks post infection (p=0.235). These results show that cattle co-infected with F. hepatica react less strongly to the SICCT test than those infected with M. bovis alone over a significant period of time.
Table 3. SICCT test results for calves experimentally infected with either M. bovis alone or F. hepatica followed by M. bovis infection four weeks later.
| Group A | Animals co-infected with F. hepatica and M. bovis (mm) | Group B | Animals infected with M. bovis alone (mm) | ||
|---|---|---|---|---|---|
| Week 10 | Week 21 | Week 10 | Week 21 | ||
| 1 | 15 | 7 | 7 | 27 | 14 |
| 2 | 17 | 6 | 8 | 26 | 12 |
| 3 | 13 | 7 | 9 | 30 | 25 |
| 4 | 9 | 7 | 10 | 10 | 4 |
| 5 | 21 | 14 | 11 | 25 | 18 |
| 6 | 12 | 8 | 12 | 31 | 12 |
| Mean (s.d.) | 14.5 (4.18) | 8.16 (2.93) | 24.8 (7.62) | 14.17 (6.99) | |
(s.d.) – standard deviation
Discussion
Here we show a strong negative spatial association between diagnosis of BTB and exposure to F. hepatica using 3026 dairy herds in England and Wales. When we included smoothed square-root-transformed F. hepatica pp-value into a previously published model of BTB, which successfully predicted BTB presence or absence using a combination of environmental and farm level variables, including animal movements between farms6, the model fitted the data significantly better than the model without the presence of F. hepatica, confirming that the negative spatial association between BTB and F. hepatica was not associated with a mutually exclusive set of environmental conditions favouring BTB 6,7 and F. hepatica 10 respectively. This leads to the conclusion that F. hepatica is an additional environmental risk factor for BTB and, importantly, is negatively associated with the odds of BTB being diagnosed on a farm. These data suggest that in the presence of F. hepatica infection, the SICCT test is less effective, a conclusion which we corroborated by an experiment in which calves were infected with M. bovis alone or in combination with F. hepatica. The calves co-infected with F. hepatica reacted less strongly to the SICCT test than those infected with M. bovis alone when tested on two occasions at week 10 and week 21 after M. bovis infection. Previous studies have shown that cattle infected with F. hepatica and M. bovis BCG had significantly reduced skin thickness following standard SICCT tests and this was associated with impaired IFN-γ responses and enhanced IL4, IL10 and Transforming Growth Factor (TGF) β secretion 16. This concurs with murine models in which F. hepatica or specific F. hepatica antigens have been shown to modulate dendritic cell and macrophage function, leading to the induction of regulatory T cell populations expressing TGF-β and IL10, which in turn inhibit bystander and auto-antigen specific Th1 and Th17 responses and release of inflammatory mediators such as IFN-γ and IL12 14,17,18,19,20. Similarly in humans, helminth infections suppress T cell and IFN-γ responses to PPD and reduce the efficacy of BCG vaccination21,22,23,24. These data are consistent with the conclusion from our findings that in the presence of F. hepatica infection, the efficacy of the SICCT test used to diagnose BTB is compromised.
Although the magnitude of the response to the SICCT test in the co-infected calves was significantly less than that in calves infected with M. bovis alone, all six co-infected animals had responses that would be considered positive under field conditions (comparative increase in skin thickness of more than 4mm), nevertheless the mean difference in skin thickness was 42% less than in those infected with M. bovis alone. It was not feasible to replicate under experimental conditions the situation in the field where animals are likely to have higher F. hepatica burdens and we have not yet explored the interaction between intensity and relative timing of each infection and the impact each may have on the SICCT. But it is plausible that a F. hepatica infection has the effect of pushing weak SICCT positives into a negative classification in the field where interpretation of the test is not always clear cut. An alternative explanation for both our epidemiological analysis and the results from the experimental infections is that F. hepatica reduces the susceptibility of cattle to BTB. In a study in which 200 in-contact and 200 cattle classified as BTB-infected by SICCT (i.e. ‘reactors’) were investigated in depth, a consistent negative association was described between having antibodies to F. hepatica and having confirmed BTB, in both groups25. Another study 26 showed that experimentally co-infected cattle had fewer BTB lesions at slaughter and fewer tissue samples that were culture positive for M. bovis although these differences were not shown to be significant. Moreover neither of these studies investigated whether co-infection influenced the nature, development or distribution of lesions and bacterial spread, which could also explain these results. Also both the SICCT and the PPD specific IFN-γ response were suppressed in BCG/F. hepatica co-infected calves and this trend was true irrespective of whether BCG was given before or after F. hepatica16 suggesting overall that the most likely interpretation of our findings is that a proportion of BTB positive animals are being missed by the SICCT test.
If, as our data suggest, F. hepatica suppresses the SICCT response of BTB infected cattle, our model indicates a substantial degree of under-ascertainment of BTB using the SICCT test. Undetected cases have the potential to spread infection to other cattle within the herd, to wildlife within the area and, if moved, to herds in different parts of the country. F. hepatica is a ubiquitous parasite, whose prevalence is predicted to fluctuate considerably in areas of the UK over the next 50 years due to changes in climate 9. It is possible that treatment of cattle with flukicidal drugs, prior to testing, might increase the detection rate of BTB, leading in the short term to an apparent surge in incidence, but, in the longer term, improved control of the disease. Studies in helminth-infected humans suggest that vaccine responses to BCG are compromised 24 ; extrapolating these findings to cattle, infection with F. hepatica may compromise induction of vaccine responses to M. bovis, an important consideration in view of the current intention to develop and apply vaccines to cattle to help control the BTB epidemic in UK and Ireland. This is the first wide scale analysis of the interaction between F. hepatica and M. bovis and provides direct evidence of a significant negative association between the two infections, the most likely explanation for which is the impact of F. hepatica on the host’s immune system reducing the sensitivity of the principle diagnostic test used for M. bovis. This finding has significant implications for the UK and Ireland’s BTB eradication programmes.
Methods
Fasciola hepatica data
Bulk milk samples from 3026 dairy farms in England and Wales 27 were tested using an antibody detection ELISA 28. The test result was expressed as the Percent Positivity (pp-value) which is the ratio of the optical density reading for the test sample and the optical density reading for a positive control sample. A cut-off pp-value of 27 was used to define a positive herd; at this cut-off the diagnostic sensitivity of the test is 96% (95% Confidence Intervals = 89-100%) and the diagnostic specificity is 80% (95% Confidence Interval = 66-94%) 28.
Bovine tuberculosis data
Bovine tuberculosis (BTB) data was obtained for each of the 3026 farms. Two sources of uncertainty are acknowledged in the BTB data. First, SICCT test sensitivity and specificity are imperfect, leading to false positive and false negative results. Positive skin test results are normally confirmed if typical M. bovis lesions are found at post mortem examination (PME) or if positive culture for M. bovis is obtained. Due to low sensitivity of laboratory culture and the frequent absence of visible lesions, the number of animals reacting to the skin test was used to denote farms with BTB breakdowns, rather than the number of confirmed cases of BTB. Second, BTB testing occurs at different frequencies according to parish prevalence of BTB. BTB testing intervals range from every 1 to every 4 years routinely, but are also conducted when necessary for pre-movement testing, providing the farm has not been tested in the last 60 days; testing is repeated 60 days later if a reactor animal is detected. Once a herd is free from reactors it must test negative to two subsequent whole herd tests, 60 days apart, to be considered ‘Officially TB free’. We analysed the cumulative incidence of BTB in the 3026 farms from 1 January 2004 to 31 December 2007; this 4 year period was chosen to, firstly, ensure that all farms had been tested for BTB at least once and, secondly, include the period when the same farms were tested for F. hepatica.
Smoothing of F. hepatica pp-value and BTB data
Smoothing is a statistical process which aims to capture important patterns in data while reducing noise. We used model-based geostatistics29 to smooth the two sets of disease data. First, the 3026 farms were randomly allocated to 1984 to be used for model development (designated as analysis locations), whilst the remaining 1042 (hold-out locations) were reserved for model validation. The underlying statistical model is that Yi = S(xi) + Zi : i = 1,..., n, where Yi is the observed value of a response variable at location xi, S(x) is an unobserved spatially varying surface that is modelled as the realisation of a spatial stochastic process, and Zi is an independent random perturbation with variance τ2 that accounts for sampling variation and/or micro-scale spatial variation in the immediate vicinity of xi (“immediate” meaning, roughly, less than the smallest distance between any two data-locations). The properties of the stochastic process S(·) are encapsulated in its mean, its variance, σ2 and the covariance, σ2ρ(μ/φ) between values of S(x) at a pair of locations a distance μ apart, where φ is a parameter representing the rate at which the spatial correlation decays with increasing distance. For F. hepatica we used as the response variable square-root transformed pp-value, whilst for BTB we used the log-odds of prevalence.
The theoretical variogram of Y is the function V(μ) = τ2 + σ2(1 − ρ(μ/φ)). We specified the parametric model ρ(μ/φ) = exp(−μ/φ) by inspecting the sample variogram of the data, estimated the model parameters, μ, σ2, φ and τ2 by the method of maximum likelihood, and used the fitted model to compute the minimum mean square error predictor of S(x) at each of the 1984 data-locations, at each of the 1042 hold-out locations and on a regular grid spanning England and Wales at 5 × 5 km resolution so as to generate a national map of the predicted spatial variation in S(x). The variograms for BTB and Fasciola pp-value are shown in Figure 3.
Figure 3. Empirical variograms for incidence of BTB, F. hepatica infection and the residuals from the fitted model.
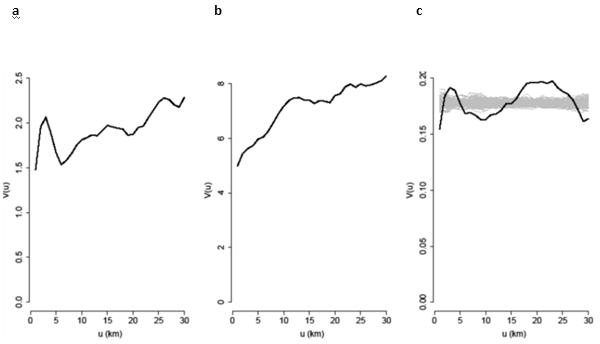
(a) Log-odds of the herd-level cumulative incidence of BTB ; (b) square-root of the pp-value ; (c) the residuals from the fitted model; the grey lines are empirical variograms computed from 99 independent permutations of the residuals over the locations. These provide an informal tolerance envelope for the empirical variogram when the residuals are spatially independent. A formal Monte Carlo test rejects the spatial independence hypothesis (p=0.01) but the absence of a clear rising trend in the empirical variogram, in contrast to the behaviour of the other two variograms, suggests that the residual spatial correlation is relatively weak. The x axis, u, denotes distance in kilometres; the y axis, V(u), denotes the estimated value of the variogram at distance u.
The analysis was conducted using the R open-source software environment (www.r-project.org).
Covariate data
Covariate data were obtained for published descriptions of explanatory variables for BTB6, or close proxies of them. We derived environmental variables from both meteorological and satellite-derived data. Meteorological variables, including maximum and minimum monthly temperatures, and Vapour Pressure (VP) were obtained for the period 2001-2005, from the United Kingdom’s Meteorological Office as raster maps with a 5 × 5 km resolution. For each variable, data for each farm location were extracted from the raster layer using ArcGIS v 9.3 (ArcMap version 9.3, ESRI, USA). In brief, the raster layer was fitted to the base map containing point data on farm location, using the Georeferencing tool bar. The raster layer was then stretched to fit the underlying base map closely in approximately 50 positions around the coastline of the base map. The transformation option was highlighted from the georeferencing menu, and a 1st order transformation was decided as most acceptable. The Root Mean Square (RMS) of the transformation should be less than or equal to the pixel size of the data set when checked. Point data pertaining to each test was added to the base map and values of the overlying raster layer were extracted to the attributes table for each newly created layer, contained in a ‘variable point’ column which contained the newly extracted raster data as point data. Microsoft Access 2007 was then used to assimilate a table with each farm location and each raster layer value for that farm. The average temperature for each farm was then calculated from the maximum and minimum temperatures extracted. This method produces smoother values with fewer high outliers.
Vapour Pressure Deficit (VPD) was calculated 30:
VPD (mb) = SVP – VP
Where: SVP = saturation vapour deficit (mb), VP = vapour pressure (mb) and
Log10(SVP) = 9.24349 – (2305/T) – (500/T2) – (100000/T3)
Where: T = mean monthly temperature (K).
MODerate-resolution Imaging Spectroradiometer (MODIS) imagery data for Normalised Digital Vegetation Index (NDVI) and Land Surface Temperature were obtained from the NASA Terra satellite 31.
NDVI was obtained for each farm location. Bidirectional Reflectance Distribution Function (BRDF) adjusted reflectance was initially recorded and from this, NDVI was extracted 32. The temperature variance (TVar) was calculated using the variance in temperature of all months and years (Jan 2001 – Dec 2005 inclusive).
Other covariates were derived as follows. Herd size was obtained from the VETNET database managed by the Animal Health and Veterinary Laboratories Agency (AHVLA), Weybridge. We used proxies of the two remaining variables. Instead of movements onto the farm from infected areas only 6, we used the total number of movements of cattle (from any area) on to and off each farm during the 4 year period; assuming more cattle movements per se may indicate an increased risk of the acquisition of BTB infected stock. Farm-level animal movement data for 2004-2007 were obtained from DEFRA (Rapid Analysis and Detection of Animal-related Risk; RADAR). Finally we obtained the log-odds of prevalence of BTB of the nearest neighbour, from our analysis farms, using the Hawth’s Analysis Tools extension (version 3.27, www.spatialecology.com/htools/download.php) in ArcMap.
Data for herd size and movements on and off premises were square root transformed to normalise their distributions
Multi-variable logistic regression model
A BTB positive farm was defined as a premises having at least one animal react positively to the BTB SICCT test in the 4-year period. The association between BTB and the explanatory variables was explored using binary logistic regression analysis (Minitab 16). Significance was determined at the 5% level.
Twenty-five variables (Table 4) were initially available and tested in the logistic regression model. Variables were removed individually by backward elimination, beginning with the variable with the least significant p-value. This approach allowed any changes towards significance to be monitored with every variable removed. The final model contained only variables that were statistically significant (p < 0.05) and where the confidence limits around the adjusted odds ratio did not include 1. Stepwise regression and forward regression models produced the same final model.
Table 4. Complete list of variables available for multivariable logistic regression analysis.
| Variable | Definition | Source |
|---|---|---|
| BTBID | Identification number for each premises | Assigned |
|
pp-value
sqrtpp Fasciola_pp |
Anti-F. hepatica antibody ELISA percentage positivity value Square-root transformation of pp-value Smoothed extracted value of sqrtpp from map |
Ref 14 Calculated Calculated |
| BTBposneg | Whether a farm has tested positive for a bTB test during 2004-07 | VETNET, DEFRA |
| NN_BTB | Log-odds of BTB prevalence of nearest neighbouring farm | Calculated |
|
Total Reactors
Total Confirmed |
The total number of reactor animals found between 2004-07 The total number of animals confirmed as BTB positive on PME or culture 2004-07 |
VETNET, DEFRA |
| SqrtHerd | Herd Size, square-root transformed for this model | VETNET, DEFRA |
|
NUTS2
NUTS1 AHOID PCArea |
The NUTS2 classification of the premises The NUTS1 classification of the premises The Animal Health Office classification of the premises The postcode area of the premises |
VETNET, DEFRA |
|
NDVI
EVI |
Normalised Difference Vegetation Index Enhanced Vegetation Index |
MODIS |
|
SqrtMOff
Sqrt(On+1) |
Square-root transformation of cattle movements off the premises Square-root transformation of one plus cattle movements onto the premises |
RADAR, DEFRA |
|
MaxT
MinT RainyDays RH VP |
The maximum temperature recorded on the farm (°C) The minimum temperature recorded on the farm (°C) The mean number of rainy days (rainfall >1mm) per year Mean relative humidity on the farm Mean vapour pressure on the farm |
MetOffice |
| MeanT | The mean temperature on the farm calculated as a mean of maximum and minimum | Calculated |
| VPD | Vapour Pressure Deficit | Calculated |
| TVar | Temperature variance, calculated from MODIS fourier curves | Calculated |
| EngWales | Location of a farm in either England or Wales | Assigned |
Initially, 3026 farms were included in the F. hepatica ELISA dataset. Four pairs of farms had different county-parish-holding (CPH) numbers but shared the same co-ordinates. Data was missing from 224 farms due to incomplete coverage by raster layers. This left a total sample size of 2794 farms for regression analysis. These were randomly divided into two sets: 1821 analysis farms, for model development, and 973 hold-out farms, for model validation. A variogram of the residuals of the logistic regression model (Figure 3) indicated some remaining but weak, unexplained spatial correlation, decaying from approximately 0.2 to zero over the range 0-30km.
Experimental infections
All procedures were conducted under the Animals (Scientific Procedures) Act, 1986 andanimals were housed in a containment level 3 facility for the duration of the experiment. Twelve castrated male Friesian calves aged between 17 and 21 weeks of age were used; six were infected with a single oral dose of 150 F. hepatica metacercariae of the Cullompton isolate (Ridgeway Research Ltd. UK). Four weeks later all 12 calves were infected with M. bovis (isolate AF2122/99, kindly provided by Dr Martin Vordermeier, AHVLA, Weybridge) by exposure to an airstream carrying aerosolized mycobacteria34 using a Madison chamber modified for use with cattle. During the 3 min infection period when aerosolized M. bovis was delivered to each animal individually, air inspired by each calf was monitored using a pneumotachometer and individual airstream samples were taken into all-glass impingers containing phosphate buffer solution to calculate the infection dose delivered to each animal. The intended target infection dose was 500 colony forming units (CFU) of M. bovis. The mean dose of M. bovis actually delivered was calculated at 506 CFU (range 271–683, SD 182) for the M. bovis only group and 548 CFU (range 342–674, SD 129) for the co-infection group. There was no statistical difference between the mean values for each group. The SICCT test was carried out 10 and 21 weeks post M. bovis infection in accordance with EU and UK regulations. The tuberculins PPDa and PPDb were injected into two intradermal sites that had been clipped and measured for skin thickness using callipers. Each injection site was checked to ensure intradermal delivery. At 72 hours post injection the skin thickness of each site was measured and recorded. The same person performed all injections and measurements to limit operator variation. The data were analysed using a linear mixed effects model fitted by maximum likelihood with week and co-infection as fixed effects and cow as a random effect, as implemented in the R open-source software environment (www.r-project.org).
Supplementary Material
Fasciola hepatica, the common liver fluke, prolongs its survival by manipulating its host’s immune response. This can suppress bystander responses to other pathogens. Claridge et al. show that in the presence of fluke, the skin test used to diagnose bovine tuberculosis is compromised and that in fluke endemic areas, a proportion of farms with bovine TB may be being missed by the current surveillance scheme.
*Image courtesy of Dr Roger Daniel, AHVLA Carmarthen.
Acknowledgments
We are grateful to Georgette Kluiters, Cyril Caminade and Jon Read for help with data extraction and analysis, Christian Setzkorn for provision of cattle movement data, and William Wint and David Rogers for MODIS data. We thank Andy Mitchell, AHVLA, for provision of BTB data and for permission to use cattle movement data. We wish to thank Jane Rees for reviewing the manuscript. This work was funded by a BBSRC DTG award to DJLW and MB and an EU project grant - DELIVER (Contract no: FOOD-CT-2004-023025) awarded to DJLW.
Footnotes
Competing financial interests: the authors declare no competing financial interests.
References
- 1.Gordon SV. Bovine TB: stopping disease control would block all live exports. Nature. 2008;456:700. doi: 10.1038/456700b. [DOI] [PubMed] [Google Scholar]
- 2.Cosivi O, et al. Zoonotic tuberculosis due to Mycobacterium bovis in developing countries. Emerg Infect Dis. 1998;4:59–70. doi: 10.3201/eid0401.980108. [DOI] [PMC free article] [PubMed] [Google Scholar]
- 3.de la Rua-Domenech R. Human Mycobacterium bovis infection in the United Kingdom: Incidence, risks, control measures and review of the zoonotic aspects of bovine tuberculosis. Tuberculosis. 2006;86:77–109. doi: 10.1016/j.tube.2005.05.002. doi: 10.1016/j.tube.2005.05.002 ; pii: S1472-9792(05)00047-8. [DOI] [PubMed] [Google Scholar]
- 4.DEFRA 2011 http://archive.defra.gov.uk/foodfarm/farmanimal/diseases/atoz/tb/stats/county.htm
- 5.DEFRA Bovine tuberculosis infection status in cattle: Mid year surveillance report July 2009-June 2010. 2010 http://archive.defra.gov.uk/foodfarm/farmanimal/diseases/atoz/tb/documents/btb-surv-report.pdf
- 6.Gilbert M, et al. Cattle movements and bovine tuberculosis in Great Britain. Nature. 2005;435:491–496. doi: 10.1038/nature03548. doi: 10.1038/nature03548 ; pii: nature03548. [DOI] [PubMed] [Google Scholar]
- 7.Wint GR, et al. Mapping bovine tuberculosis in Great Britain using environmental data. Trends Microbiol. 2002;10:441–444. doi: 10.1016/s0966-842x(02)02444-7. pii: S0966842X02024447. [DOI] [PMC free article] [PubMed] [Google Scholar]
- 8.de la Rua-Domenech R, et al. Ante mortem diagnosis of tuberculosis in cattle: a review of the tuberculin tests, gamma-interferon assay and other ancillary diagnostic techniques. Res Vet Sci. 2006;81:190–210. doi: 10.1016/j.rvsc.2005.11.005. doi: 10.1016/j.rvsc.2005.11.005 ; pii: S0034-5288(06)00002-6. [DOI] [PubMed] [Google Scholar]
- 9.Fox NJ, et al. Predicting impacts of climate change on Fasciola hepatica risk. PLoS One. 2011;6:e16126. doi: 10.1371/journal.pone.0016126. doi: 10.1371/journal.pone.0016126. [DOI] [PMC free article] [PubMed] [Google Scholar]
- 10.McCann CM, Baylis M, Williams DJ. The development of linear regression models using environmental variables to explain the spatial distribution of Fasciola hepatica infection in dairy herds in England and Wales. Int.J.Parasitol. 2010;40:1021–1028. doi: 10.1016/j.ijpara.2010.02.009. [DOI] [PubMed] [Google Scholar]
- 11.Bennema SC, et al. Relative importance of management, meteorological and environmental factors in the spatial distribution of Fasciola hepatica in dairy cattle in a temperate climate zone. Int.J.Parasitol. 2011;41:225–233. doi: 10.1016/j.ijpara.2010.09.003. [DOI] [PubMed] [Google Scholar]
- 12.Brennan GP, et al. Understanding triclabendazole resistance. Exp.Mol.Pathol. 2007;82:104–109. doi: 10.1016/j.yexmp.2007.01.009. [DOI] [PubMed] [Google Scholar]
- 13.McCann CM, Baylis M, Williams DJ. Seroprevalence and spatial distribution of Fasciola hepatica-infected dairy herds in England and Wales. Vet.Rec. 2010;166:612–617. doi: 10.1136/vr.b4836. [DOI] [PubMed] [Google Scholar]
- 14.Brady MT, O’Neill SM, Dalton JP, Mills KH. Fasciola hepatica suppresses a protective Th1 response against Bordetella pertussis. Infect.Immun. 1999;67:5372–5378. doi: 10.1128/iai.67.10.5372-5378.1999. [DOI] [PMC free article] [PubMed] [Google Scholar]
- 15.Aitken MM, Hughes DL, Jones PW, Hall GA, Smith GS. Immunological responses of fluke-infected and fluke-free cattle to Salmonella dublin and other antigens. Res.Vet.Sci. 1979;27:306–312. [PubMed] [Google Scholar]
- 16.Flynn RJ, Mannion C, Golden O, Hacariz O, Mulcahy G. Experimental Fasciola hepatica infection alters responses to tests used for diagnosis of bovine tuberculosis. Infect.Immun. 2007;75:1373–1381. doi: 10.1128/IAI.01445-06. [DOI] [PMC free article] [PubMed] [Google Scholar]
- 17.Hamilton CM, et al. The Fasciola hepatica tegumental antigen suppresses dendritic cell maturation and function. Infect Immun. 2009;77:2488–2498. doi: 10.1128/IAI.00919-08. doi: 10.1128/IAI.00919-08 ; pii: IAI.00919-08. [DOI] [PMC free article] [PubMed] [Google Scholar]
- 18.Dowling DJ, et al. Major secretory antigens of the helminth Fasciola hepatica activate a suppressive dendritic cell phenotype that attenuates Th17 cells but fails to activate Th2 immune responses. Infect Immun. 2010;78:793–801. doi: 10.1128/IAI.00573-09. doi: 10.1128/IAI.00573-09 ; pii: IAI.00573-09. [DOI] [PMC free article] [PubMed] [Google Scholar]
- 19.Donnelly S, et al. Helminth cysteine proteases inhibit TRIF-dependent activation of macrophages via degradation of TLR3. J.Biol.Chem. 2010;285:3383–3392. doi: 10.1074/jbc.M109.060368. [DOI] [PMC free article] [PubMed] [Google Scholar]
- 20.Walsh KP, Brady MT, Finlay CM, Boon L, Mills KH. Infection with a helminth parasite attenuates autoimmunity through TGF-beta-mediated suppression of Th17 and Th1 responses. J.Immunol. 2009;183:1577–1586. doi: 10.4049/jimmunol.0803803. [DOI] [PubMed] [Google Scholar]
- 21.Babu S, et al. Attenuation of toll-like receptor expression and function in latent tuberculosis by coexistent filarial infection with restoration following antifilarial chemotherapy. PLoS Negl Trop Dis. 2009;3:e489. doi: 10.1371/journal.pntd.0000489. doi: 10.1371/journal.pntd.0000489. [DOI] [PMC free article] [PubMed] [Google Scholar]
- 22.Wammes LJ, et al. Regulatory T cells in human geohelminth infection suppress immune responses to BCG and Plasmodium falciparum. Eur J Immunol. 2010;40:437–442. doi: 10.1002/eji.200939699. doi: 10.1002/eji.200939699. [DOI] [PubMed] [Google Scholar]
- 23.Elias D, et al. Effect of deworming on human T cell responses to mycobacterial antigens in helminth-exposed individuals before and after bacille Calmette-Guerin (BCG) vaccination. Clin Exp Immunol. 2001;123:219–225. doi: 10.1046/j.1365-2249.2001.01446.x. pii: cei1446. [DOI] [PMC free article] [PubMed] [Google Scholar]
- 24.Elias D, Britton S, Aseffa A, Engers H, Akuffo H. Poor immunogenicity of BCG in helminth infected population is associated with increased in vitro TGF-beta production. Vaccine. 2008;26:3897–3902. doi: 10.1016/j.vaccine.2008.04.083. doi: 10.1016/j.vaccine.2008.04.083 ; pii: S0264-410X(08)00540-9. [DOI] [PubMed] [Google Scholar]
- 25.DEFRA (Report No. SE3013).Pathogenesis and diagnosis of tuberculosis in cattle - complementary field studies. 2005 http://randd.defra.gov.uk/Default.aspx?Menu=Menu&Module=More&Location=None&ProjectID=9317
- 26.Flynn RJ, et al. Co-Infection of cattle with Fasciola hepatica and Mycobacterium bovisimmunological consequences. Transbound.Emerg.Dis. 2009;56:269–274. doi: 10.1111/j.1865-1682.2009.01075.x. [DOI] [PubMed] [Google Scholar]
- 27.McCann CM, Baylis M, Williams DJ. Seroprevalence and spatial distribution of Fasciola hepatica-infected dairy herds in England and Wales. Vet Rec. 2010;166:612–617. doi: 10.1136/vr.b4836. doi: 10.1136/vr.b4836 ; pii: 166/20/612. [DOI] [PubMed] [Google Scholar]
- 28.Salimi-Bejestani MR, et al. Prevalence of Fasciola hepatica in dairy herds in England and Wales measured with an ELISA applied to bulk-tank milk. Vet.Rec. 2005;156:729–731. doi: 10.1136/vr.156.23.729. [DOI] [PubMed] [Google Scholar]
- 29.Diggle P, Ribeiro P. Model-based Geo-statistics. Springer; 2006. [Google Scholar]
- 30.Hay SI, Lennon JJ. Deriving meteorological variables across Africa for the study and control of vector-borne disease: a comparison of remote sensing and spatial interpolation of climate. Trop Med Int Health. 1999;4:58–71. doi: 10.1046/j.1365-3156.1999.00355.x. [DOI] [PMC free article] [PubMed] [Google Scholar]
- 31.Scharlemann JP, et al. Global data for ecology and epidemiology: a novel algorithm for temporal Fourier processing MODIS data. PLoS One. 2008;3:e1408. doi: 10.1371/journal.pone.0001408. doi: 10.1371/journal.pone.0001408. [DOI] [PMC free article] [PubMed] [Google Scholar]
- 32.Jenkins G, Perry M, Prior J. The climate of the United Kingdom and recent trends. Hadley Centre, Met Office; Exeter: 2007. pp. 1–25. (UKCIP08). [Google Scholar]
Associated Data
This section collects any data citations, data availability statements, or supplementary materials included in this article.
Supplementary Materials
Fasciola hepatica, the common liver fluke, prolongs its survival by manipulating its host’s immune response. This can suppress bystander responses to other pathogens. Claridge et al. show that in the presence of fluke, the skin test used to diagnose bovine tuberculosis is compromised and that in fluke endemic areas, a proportion of farms with bovine TB may be being missed by the current surveillance scheme.
*Image courtesy of Dr Roger Daniel, AHVLA Carmarthen.