Abstract
In this article, we demonstrate single-layered, “microfluidic drifting” based three-dimensional (3D) hydrodynamic focusing devices with particle/cell focal positioning approaching submicron precision along both lateral and vertical directions. By systematically optimizing channel geometries and sample/sheath flow rates, a series of “microfluidic drifting” based 3D hydrodynamic focusing devices with different curvature angles are designed and fabricated. Their performances are then evaluated by confocal microscopy, fast camera imaging, and side-view imaging techniques. Using a device with a curvature angle of 180°, we have achieved a standard deviation of ±0.45 µm in particle focal position and a coefficient of variation (CV) of 2.37% in flow cytometric measurements. To the best of our knowledge, this is the best CV that has been achieved by a microfluidic flow cytometry device. Moreover, the device showed the capability to distinguish 8 peaks when subjected to a stringent 8-peak rainbow calibration test, signifying the ability to perform sensitive, accurate tests similar to commercial flow cytometers. We have further tested and validated our device by detection of HEK-293 cells. With its advantages in simple fabrication (i.e., single-layered device), precise 3D hydrodynamic focusing (i.e., submicrometer precision along both lateral and vertical directions), and high detection resolution (i.e., low CV), our method could serve as an important basis for high-performance, mass-producible microfluidic flow cytometry.
Introduction
Flow cytometry is a powerful, high-throughput, single-cell characterization and sorting tool that has revolutionized how cells are studied and purified.1–7 In the past decades, flow cytometry has become indispensable for a wide variety of applications in the fields of molecular biology, pathology, immunology, plant biology, and medical diagnostics.8–11 For example, disease progression in human immunodeficiency virus (HIV) patients is typically monitored using flow cytometry.12 In cancer diagnostics, flow cytometry is widely used in immune-phenotyping of acute leukemia and DNA content analysis of tumor cells.13,14 Despite their significant impact, current benchtop flow cytometry systems have the following drawbacks: high cost, large size, complex configuration, and high maintenance.15–20
In this regard, the lab-on-a-chip community has made significant progress in leveraging the advantages offered by microfluidics (e.g., small size, reduced sample consumption, and high controllability in fluid/particle/cell manipulation) as a means of developing miniature, low-cost flow cytometers. With microfluidics, significant benchmarks, such as size and cost reduction, have been achieved.21–31 However, as of today, microfluidic flow cytometers have not equaled the performance of their benchtop counterparts, specifically in terms of detection resolution. Detection resolution of a flow cytometer, a measure of the precision and accuracy of the device, is generally characterized by the coefficient of variation (CV, defined as the standard deviation divided by the mean) of the scatter signals.4 The high detection resolution (i.e., low CV) of conventional flow cytometers is largely due to their ability to tightly and precisely focus cells, with sub-micrometer cell-focusing precision along both lateral and vertical directions. Such high-precision cell focusing assures that each cell passes through the detection/sorting points at exactly the same position and velocity, resulting in accurate and precise cell detection and sorting. Most microfluidic flow cytometers have difficulties in achieving a similar level of precision in cell focusing. As a result, their detection resolution (i.e., CV) and sorting purity are not comparable to those of their benchtop counterparts.
A variety of innovative particle/cell focusing techniques have been demonstrated to improve the performance of microfluidic flow cytometers.32–39 Three-dimensional (3D) hydrodynamic focusing techniques are particularly promising. By focusing sample flows not only horizontally (in-plane), but also vertically, it is possible to improve detection resolution.40–52 For example, Di Carlo et al. have successfully exploited inertial effects to focus particles three-dimensionally in serpentine-like curved microfluidic channel structures.53–57 Park et al. have utilized centrifugal force through periodic expansion and contraction of array structures within a microfluidic channel to confine the sample flow in three dimensions.58,59 Lo et al. have demonstrated an excellent ability to confine sample flow using a double-layered 3D hydrodynamic focusing device with smaller sample channel height relative to sheath fluid channels.60 Our group has developed a “microfluidic drifting” mechanism for 3D particle focusing in a single-layered microfluidic device.61–63 Despite these advances, the current microfluidic-based 3D hydrodynamic focusing methods have significant drawbacks. Low focusing precision (i.e., large confinement size) and/or dependence on particle/cell properties (i.e., cells/particles with different properties and sizes focused at different positions) plague existing microfluidic flow cytometers. These drawbacks often lead to inferior performance (e.g., high CVs).
By systematically optimizing channel curvature angle and other parameters, we have shown that our “microfluidic drifting” technique can achieve 3D hydrodynamic focusing with sub-micrometer precision. Devices with different curvature angles were first studied through computational fluid dynamics (CFD) simulations before undergoing experimental verification. Three-dimensional hydrodynamic focusing was performed with fluorescein solution, polystyrene beads, and cells to characterize device performance and verify particle/cell focusing precision. We achieved a standard deviation of ±0.45 µm in particle focal position and a CV of 2.37% with Flow-Check calibration beads. This CV is comparable to that of commercial flow cytometers, and to the best of our knowledge, is the best CV value that has been achieved by any microfluidic flow cytometer. Moreover, our device could distinguish 8 fluorescent peaks, when subjected to an 8-peak rainbow calibration test. The ability to conduct such stringent tests is indicative of our system’s high precision and resolution.
Methods
Device working mechanism
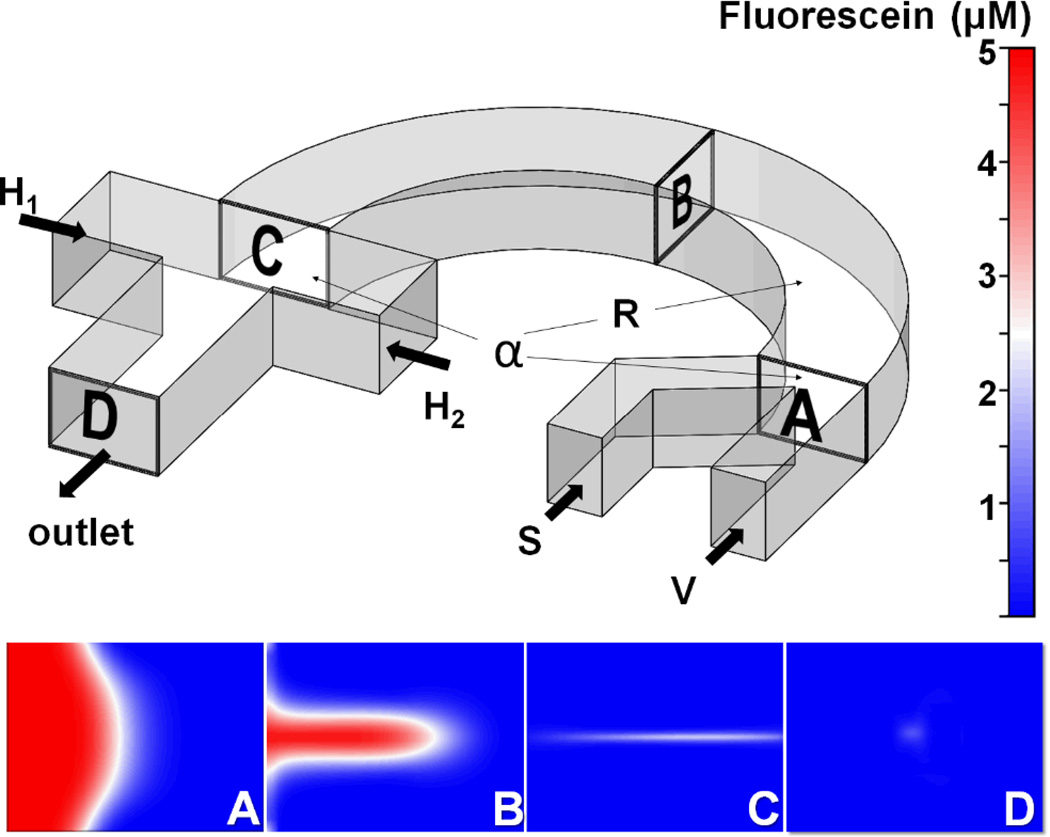
The “microfluidic drifting” 3D hydrodynamic focusing46 is achieved in the two-step procedure shown in Fig. 1. The sample fluid and the vertical sheath fluid are injected from two separate inlets (S and V, Fig. 1). As the two fluids merge (inset A, Fig. 1) and move inside the curved channel (of arbitrary angle α), they will experience a centrifugal force. Fluid elements near the inner wall of the curvature experience greater centrifugal force as compared to that near the outer wall due to decreased radius of curvature. Thus, the sample fluid near the inner wall bulges into the sheath fluid (insets B and C, Fig. 1). The constraints of the channel walls cause the fluid near the outer curved wall to recirculate along the perimeter of the channel walls. This phenomenon of recirculation causes the formation of two counter-rotating vortices above and below the channel middle-plane, called secondary flow or Dean’s flow. Hence, the sample fluid is vertically focused at this stage. This is demonstrated in insets A-C in Fig. 1, where the two side-by-side co-flowing fluids transform into a thin sandwiched structure of sheath-sample-sheath (inset C in Fig. 1). Any particles within the sample fluid will also be swept to the center-plane of the channel. In the second step, the vertically focused fluid/particles are pushed to the center of the channel by two side (horizontal) sheath fluids (H1 and H2, Fig. 1). The inset D of Fig. 1 indicates the cross-section of the downstream channel which shows the three-dimensionally focused stream in the form of the dot.
Fig. 1.
Schematic diagram of the “microfluidic drifting” 3D hydrodynamic focusing device. The sample flow (S) and vertical-focusing sheath flow (V) are input from the right end of the curved channel and exit from the left end. The insets (A, B, C, and D) are locations of CFD simulation of the sample flow distribution on the cross sections of the curved channel. The co-flow interface transfers from vertical distribution at the input end (inset A) to the Gaussian distribution at the middle of the channel (inset B), and finally to the sandwiched distribution (inset C). Then two horizontal-focusing sheath flows (H1 and H2) are added in order to pinch the sample flow into a confined area in the center of the channel (inset D).
CFD Simulations
In this work, we utilized CFD-ESI software to analyze the flow field in the curved channels. The simulation was based on a combination of the governing mass conservation equation, the energy conservation equation, and the momentum conservation equation of incompressible fluids. In our simulation, we adopted deionized (DI) water as the vertical and horizontal sheath fluids and 5 µM fluorescence in DI water as the sample fluid. The sample flow rate was set as 25 µl/min. Both the horizontal sheath fluids were kept at 225 µl/min. The input vertical sheath fluid rate was set via simulation manager in CFD-ESI software, ranging from 50 µl/min to 550 µl/min with an increment step of 5 µl/min for each simulation. This systematic approach was applied to all the “microfluidic drifting” 3D hydrodynamic focusing devices with curvature angles of 70°, 90°, 135°, 180°, 225°, and 270° to obtain the optimum vertical sheath fluid rate for each curvature angle. We used a relative convergence criterion of 10−6 in all the simulations. The concentration profiles of sample fluids were analyzed for each simulation at cross-section C (Fig. 1), right before horizontal sheath fluid inlets. We used a criterion of 2.5 µM isosurface (50% of the initial concentration) to visualize the focusing profile of the sample fluid. This approach was used to estimate the optimum value for vertical sheath flow rate, beyond which remixing of sample fluid occurs. This vertical sheath fluid optimization approach was adopted for each curvature angle.
Key parameters to improve particle-focusing precision
It is vital to identify the key parameters of our device that determine the sample focal diameter, and thus the particle-focusing precision. Quantitatively, the final focal diameter of the sample fluid can be defined as,
| (1) |
where (D – D0) is the decrease in sample focal diameter, t0 is the initial time (at entrance of the curvature), t is the final time at the end of the curved channel, β is the material parameter (such as viscosity and density) of the sample flow, and γ̇ is the interfacial shear rate which depends on the difference in flow rate between the sample flow and sheath flow. From Equation (1), we can see that the final sample focal diameter is dependent on both the shearing time of the co-flowing fluids, as well as the difference in flow rate between the sample flow and sheath flow. This suggests that by increasing the length of the curved channel (e.g., increasing the curvature angle), while at the same time holding the interfacial shear rate constant, we can enhance the shearing time of the two co-flowing fluids and thus decrease the sample focal diameter.
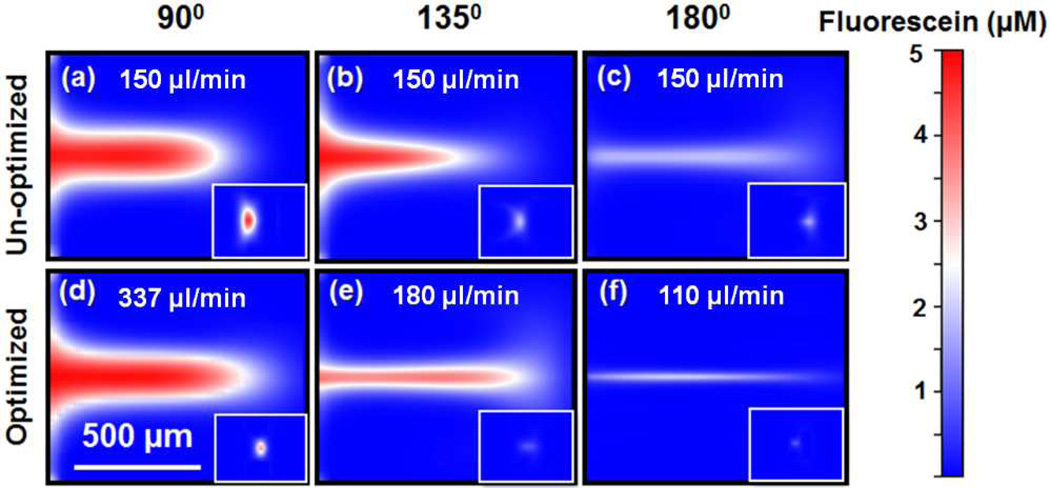
This method of decreasing sample flow focal diameter was validated by our simulation results. Fig. 2 shows CFD simulation results of the co-flow interface distribution from the “microfluidic drifting” 3D hydrodynamic focusing devices with curvature angles of 90°, 135°, and 180°, respectively. The insets on the bottom-right corners of each image indicate the final focusing diameter and the location of the sample flow. Figs. 2(a), (b), and (c) elucidate the un-optimized experimental conditions, where curvature angles are increased while keeping the flow rates constant (150 µl/min for vertical-focusing sheath fluid and 25 µl/min for sample fluid). The co-flowing interface within the cross-section plane is stretched thinner as the channel curvature angle increases from 90° to 135° to 180°. This is due to longer shearing times, a larger centrifugal effect, and increased exposure to the counter-rotating vortices. When the device curvature angle is 90° or 135° (Figs. 2(a) and (b)), the co-flowing interface is not stretched enough from the inner wall towards the outer wall, resulting in a non-spherical and non-central focused sample beam, as shown in their respective insets. However, when the device curvature angle is 180° (Fig. 2(c)), the co-flowing interface is slightly overstretched by the centrifugal force and re-mixing occurs, leading to defocused and decentralized sample focusing stream (inset Fig. 1(c)). Clearly, the curvature angle of the device can play an important role in stretching the interface of the co-flowing sample fluid to its optimum position to achieve higher focusing precision.
Fig. 2.
CFD simulation results of the cross-sectional flow distribution at the end of the curved channel without optimization of fluid rates for curvature angles of (a) 90°, (b) 135°, and (c) 180°. CFD simulation results of the cross-sectional flow distribution with an optimized rate of vertical sheath flow for curvature angles of (d) 90°, (e) 135°, and (f) 180°. In each image, the inset at the bottom right corner indicates the enlarged focal point of the sample flow.
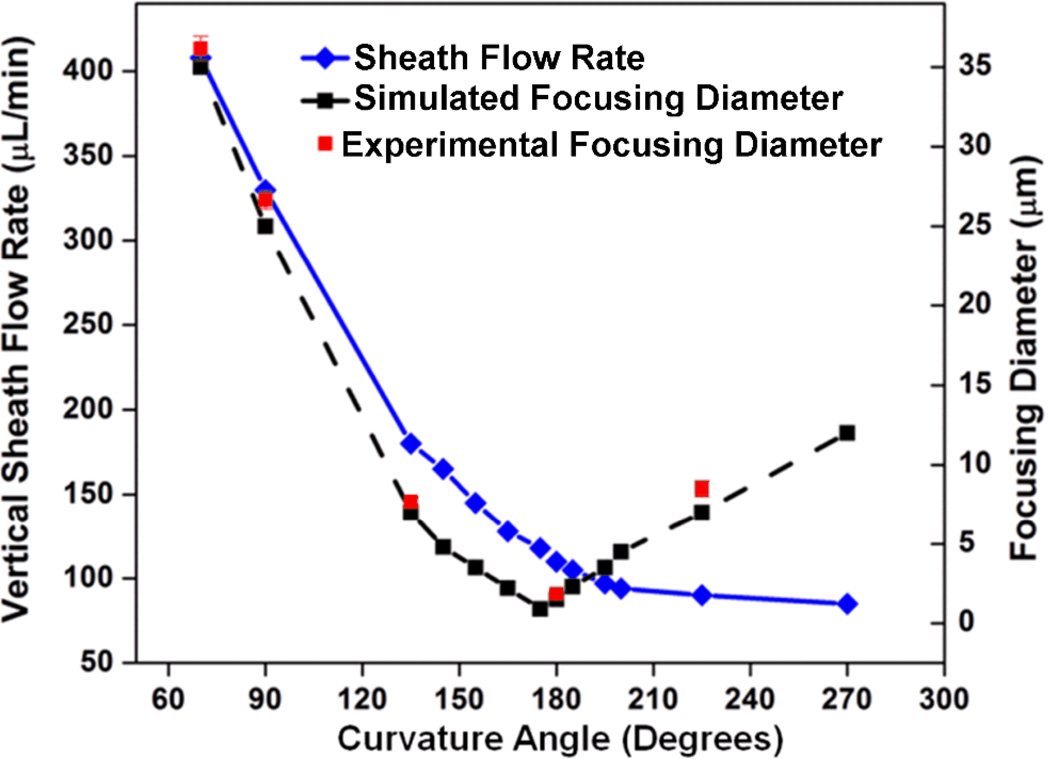
The vertical-focusing sheath flow rate also plays a key role in improving focusing precision. Figs. 2(d), (e), and (f) show the cross-sectional views of the devices with curvature angles of 90°, 135°, and 180° after optimizing vertical-focusing sheath flow rates. For the devices with curvature angles of 90°, 135°, and 180°, the vertical sheath flow rates are 337 µl/min, 180 µl/min, and 110 µl/min, respectively. It is noteworthy that, as we increase the curvature angle from 90° to 180°, not only does focusing precision improve, but vertical-focusing sheath flow rate decreases, both of which are beneficial for developing high-performance, compact flow cytometers. However, at larger angles of curvature (>180°), the necessary vertical sheath flow rate becomes very low, which leads to decreased interfacial shear rates and increased focal diameters.
Device fabrication and experimental setup
A series of “microfluidic drifting” based 3D hydrodynamic focusing devices with different curvature angles were fabricated using polydimethylsiloxane (PDMS) via a mold-replication procedure and standard soft lithography techniques.18 First, the master mold was obtained by performing deep reactive ion etching (DRIE, Adixen, Hingham, MA) on a pre-patterned silicon wafer with spun-on photoresist. The master mold was then coated with 1H, 1H, 2H, 2H-perfluorooctyltrichlorosilane (Sigma Aldrich) to reduce the surface energy and facilitate the removal of PDMS from the mold. TA Sylgard184™ Silicone Elastomer base was mixed with curing agent (Dow Corning, Midland, MI) based on a 10:1 weight ratio. The mixture was degassed in vacuum for 30 min and then cured at 70°C. The PDMS was then cut and peeled off from the mold with the patterned microfluidic channel. Inlets and outlets were made by punching in holes using a 0.75 mm punch (Harris uni-core). Following that, the PDMS was bonded onto a silicon substrate to form a sealed microchannel. Finally, four independently controlled Syringe pumps (cetoniGmbH, Germany) were connected to the device via polyethylene tubes.
In our experiments, fluorescein solution, microparticles (Bangs Laboratories), and cells were used as samples to test device performance. Flow-Check calibration beads were used for comparison of results with a commercial benchtop flow cytometer (Beckman and Coulter). Human embryonic kidney HEK-293 cells were also detected in our device, after they were stained with Calcein AM. A high-speed camera (FASTCAM SA4, 225,000 frames per second) was used to observe the microparticle focusing. To observe the focusing in the vertical direction, confocal microscope (Olympus Confocal FV1000, Japan) and side-view imaging techniques were used. A smooth, transparent optical window was placed adjacent to the main channel to allow “side-view imaging” of the focused flow. A 45-degree prism was placed adjacent to the optical window to deflect the excitation light and emission light so the side-view profile of the focused flow could be monitored using an epifluorescence microscope. Finally, we used a home-made laser-induced fluorescence system to perform flow cytometric measurements. The fluorescence system consisted of a BlueSky 488 nm laser introduced via fluorescence lamp house into an inverted fluorescent microscope (TE 2000U, Nikon). A 40× objective lens focused the laser beams into a tight spot of approximately 20 µm. The same optical path carries the emission signal from polystyrene beads to the photo-multiplier tube (PMT, Hamamatsu H6780-20) attached to the C-mount of the microscope.
Results and Discussion
3D focusing of fluorescein solutions
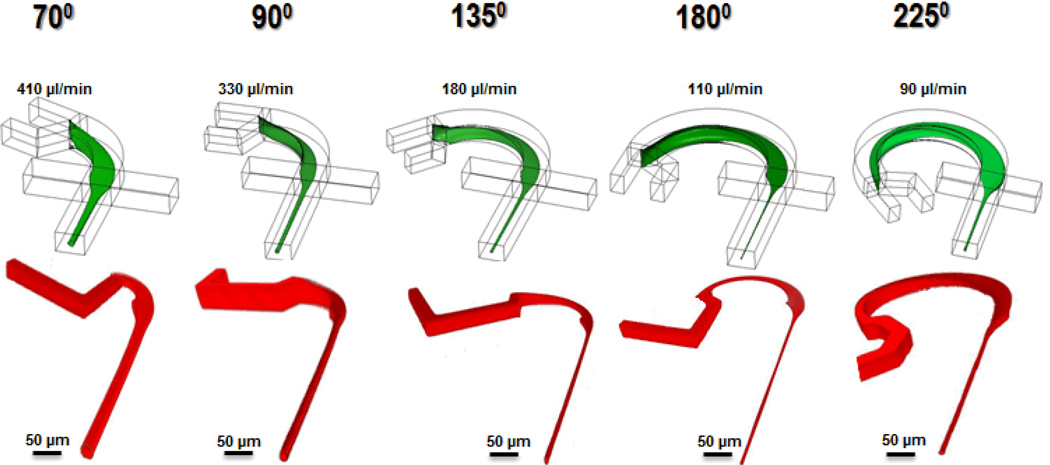
To characterize the 3D hydrodynamic focusing performance, we fabricated a series of “microfluidic drifting” devices with different curvature angles (i.e., 70°, 90°, 135°, 180°, and 225°). 5 µM fluorescein in DI water was used as sample fluid. CFD simulation results in the first row in Fig. 3 indicate confinement width (y-direction) of 35.0 µm, 25.0 µm, 6.0 µm, 2.0 µm, and 6.0 µm and confinement height (z-direction) of 37.0 µm, 25.0 µm, 7.0 µm, 2.0 µm, and 5.0 µm for devices with curvature angles of 70°, 90°, 135°, 180°, and 225°, respectively. Illustrated in the second row are the experimental results from the confocal microscope imaging of the corresponding curvature angles shown in the top row. The z-resolution of the confocal microscope was set to 0.25 µm. The confocal microscopy results agree well with the CFD simulation results, indicating the effectiveness of our model. As the curvature angle increases from 70° to 180°, the experimental focusing diameter decreases from several tens of micrometers to ~2.5 µm. However, as the curvature angle increases from 180° to 225°, an increase in the focusing diameter to ~7.4 µm is observed.
Fig. 3.
The 3D architecture of the sample flow during the “microfluidic drifting” 3D focusing process characterized by the CFD simulation (top row) and confocal microscopy (bottom row) for devices with different curvature angles (i.e., 70°, 90°, 135°, 180°, and 225°). For each device, the vertical sheath fluid rates (indicated in the figure) are optimized to achieve optimum sample-focusing performance. The CFD simulation and confocal microscopy are performed under the same flow conditions.
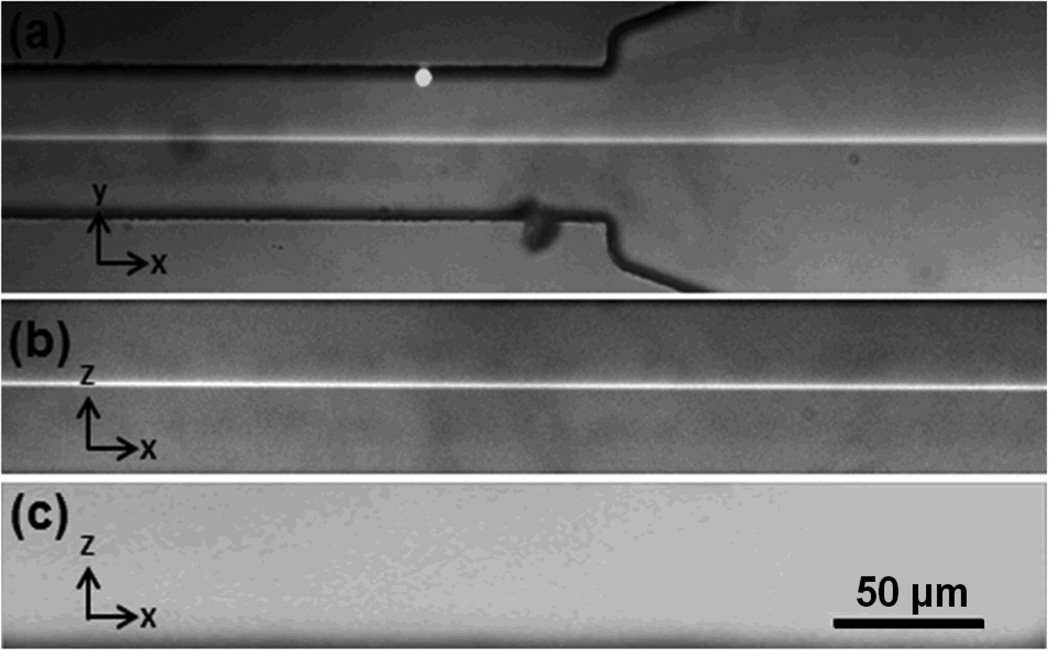
Experimental validation of focusing performance was also conducted via epifluorescence microscopy (both top-view and side-view). Fig. 4(a) depicts the top view of the fluorescent sample flow (5 mm downstream the exit of the 180-degree curve). Fig. 4(b) depicts the side-view of hydrodynamically focused flow in the main channel. The sample flow is observed to be focused in the center of channel with a total height of ~2.5 µm. Fig. 4(c) shows the side-view of the main channel after flows are stopped. The fluorescent dye diffuses through the entire channel resulting in a uniform distribution of fluorescent dye at a much lower concentration.
Fig. 4.
(a) Top view of the sample flow pattern during the “microfluidic drifting” 3D focusing process (5 mm downstream the exit of the 180-degree curve), indicating a focal width of ~2.5 µm. (b) Side-view of the 3D focused sample flow in the main channel, indicating a focal height of ~2.5 µm and (c) side view of the channel after the flows were stopped.
Summary of sample-focusing performance with different device parameters
Fig. 5 provides a summary of sample focusing diameters achieved for devices with different curvature angles (and their optimized vertical sheath fluid rates). The simulation results indicate that the minimum focusing diameter (~1.0 µm) can be achieved with a device curvature angle of 175°. This result agrees reasonably well with our experimental result, which indicated that a minimum focusing diameter of ~2.5 µm is achieved with a device with a curvature angle of 180°. As we increase the curvature angle from 70° to 180°, the focusing diameter decreases from 37 µm to 2.5 µm, and sheath flow rates also decreases significantly. Smaller focusing diameters indicate better focusing precision, and reduced sheath flow rates are advantageous for developing more compact, biocompatible flow cytometers: by reducing sheath flow rates, one can reduce the biohazards, the size and cost of the system, and the shear force acting on cells. As we continue increasing the curvature angle from 180° to 270°, the focusing diameter increases and the focusing precision decreases; beyond 270° no effective focusing is observed.
Fig. 5.
A summary of sample focusing diameters achieved for devices with different curvature angles (and their optimized vertical sheath fluid rates). The vertical sheath fluid rate decreases with increases in curvature angle (continuous blue line). Experimentally, the focusing diameter reaches minimum at a curvature angle of 180° (indicated by red squares).
3D focusing of microparticles
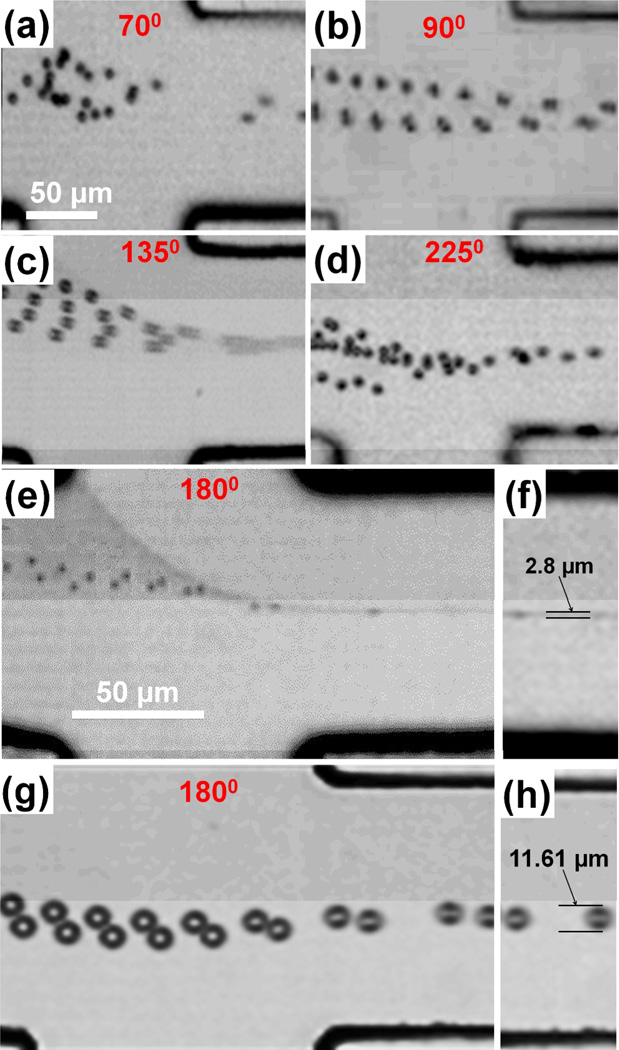
In the previous sections, we demonstrated that precise focusing of a fluorescent dye solution can be achieved using the “microfluidic drifting” technique. Here, we extend this technique for precise focusing of large microparticles (on a length scale of several to several tens of µm). Our theoretical and numerical results (Supplementary Information) indicate that in our “microfluidic drifting” 3D focusing devices, particles ranging from submicron to several tens of microns will follow streamlines and be focused three-dimensionally. These theoretical and numerical results are further supported by the experimental data (Fig. 6). In the experiments, we injected ~1×10⁶/ml polystyrene beads in 0.01% SDS solution. The polystyrene beads were vortexed prior to injection into the device for prevention of agglomerates. Fig. 6 shows Z-stacked fast camera imaging results (captured at 225,000 frames per second) using “microfluidic drifting” 3D focusing devices with 70°, 90°, 135°, 180°, and 225° curvature angles (videos for the particle-focusing process are shown in Supplementary Information S1, S2, and S3). Since we observed the best focusing results with the device possessing a curvature angle of 180°, we tested the 180° channel device by focusing 1.9 µm and 10.11 µm polystyrene beads. The device shows a focusing diameter of ~2.8 µm for 1.9 µm polystyrene beads; i.e., the standard deviation of the particle position is ±0.45 µm. The device also shows a focusing diameter of ~11.61 µm for 10.11 µm polystyrene beads; i.e., the standard deviation of the particle position is ±0.75 µm. Figs. 6(f) and (h) show that 1.9 µm and 10.11 µm polystyrene beads remain focused even at 5 mm downstream of the curve, indicating the stability and effectiveness of the device design.
Fig. 6.
Z-stacked fast camera imaging (225,000 fps) results for particle focusing in devices with different curvature angles:(a) 70°; (b) 90°; (c) 135°; (d) 225°; and (e and g) 180°. Sample flow rate for all the devices was 25 µl/min while optimized vertical sheath fluid rate for each device is 410, 337, 180, 110, and 90 µl/min for 70°, 90°, 135°, 180°, and 225°, respectively. (f) The focusing of 1.9 µm polystyrene beads by the 180° channel device. The focusing diameter is 2.8 µm. (h) The focusing of 10.11 µm polystyrene beads by the 180° channel device. The focusing diameter is ~11.61 µm.
Flow cytometry measurements
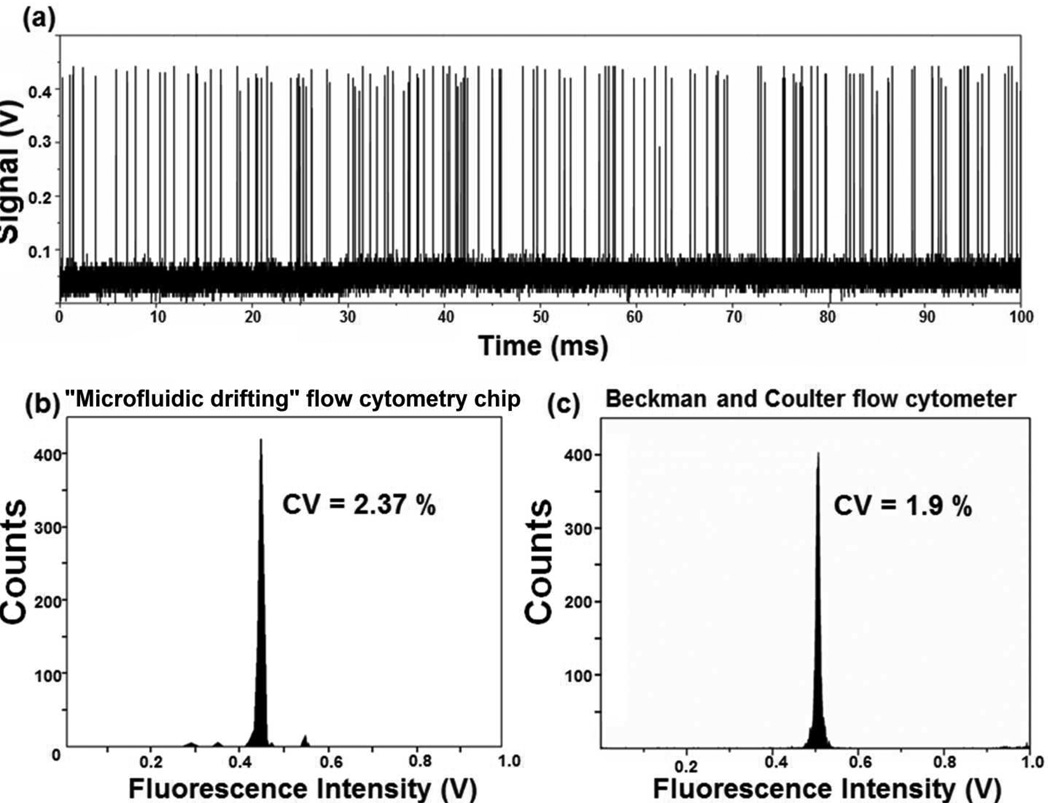
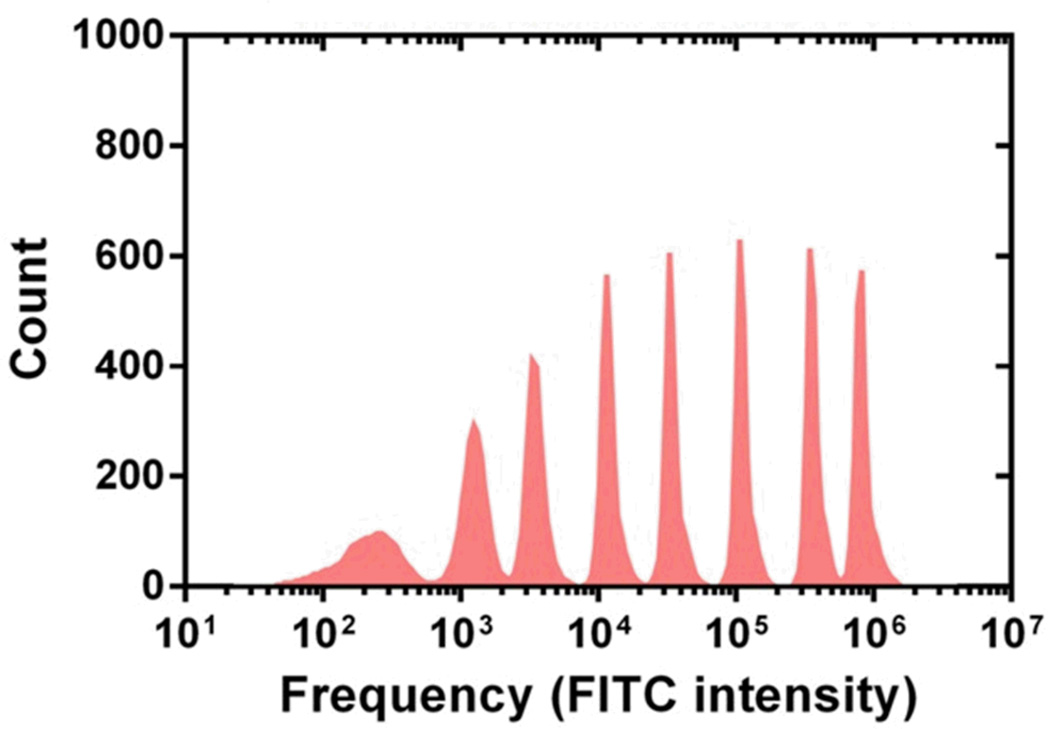
We used the laser-induced fluorescence system and 10 µm Flow-Check polystyrene calibration beads to characterize the performance of a “microfluidic drifting” based flow cytometry chip with a curvature angle of 180°. Fig. 7(a) shows a typical diagram of fluorescent peaks detected from the calibration polystyrene beads. A program written in Matlab was used to analyze the peaks. A total of 8,653 peaks were recorded for 4 s of total recorded data, leading to a particle flux of ~2,163 particles s−1. Each peak in Fig. 7(a) indicates a polystyrene bead. The spacing between peaks indicates the potential to further increase the throughput. The uniformity in the height of the peaks indicates that a similar amount of fluorescent signal is collected from each bead passing through the laser interrogation point. This indirectly proves that all the beads are passing through the laser at the same interrogation point along the main axis of the channel. The CV of our “microfluidic drifting” flow cytometry chip is calculated to be 2.37% (Fig. 7(b)). For comparison, we conducted similar experiments on a conventional benchtop flow cytometer (Beckman and Coulter, CYTOMICS FC 500) with identical experimental conditions and calibration beads and the CV was calculated to be 1.90% (Fig. 7(c)). For immunological studies, the ability of flow cytometry to distinguish between fluorescence staining level is of crucial importance. Therefore, we subjected the “microfluidic drifting” flow cytometry devices with curvature angles of 90°, 135°, 180° and 225° to Sphero 8-peak rainbow calibration beads (3–3.4 µm, BD Biosciences) and signals were detected using the laser-induced fluorescence system. Results in Fig. 8 indicate the ability of the 180° device to clearly distinguish eight peaks. Results for the 90°, 135°, and 225° devices are shown in the Supplemental Information.
Fig. 7.
(a) A typical diagram of fluorescent peaks detected from the calibration polystyrene beads. Each peak represents a single polystyrene bead as it passed the laser interrogation region. The uniformity in the height of the peak indicates the efficacy of 3D focusing of the beads. (b) The CV results of the calibration beads indicate a single population of polystyrene beads centered at ~0.425 volts. (c) CV results of same type of polystyrene calibration beads were drawn from a Beckman and Coulter commercial flow cytometer. The population in this case centers at ~0.5 volts.
Fig. 8.
Eight peak rainbow test results. The particle size ranges from 3–3.4µm. It is evident that 180° channel flow cytometry device is capable of distinguishing 8 separate peaks.
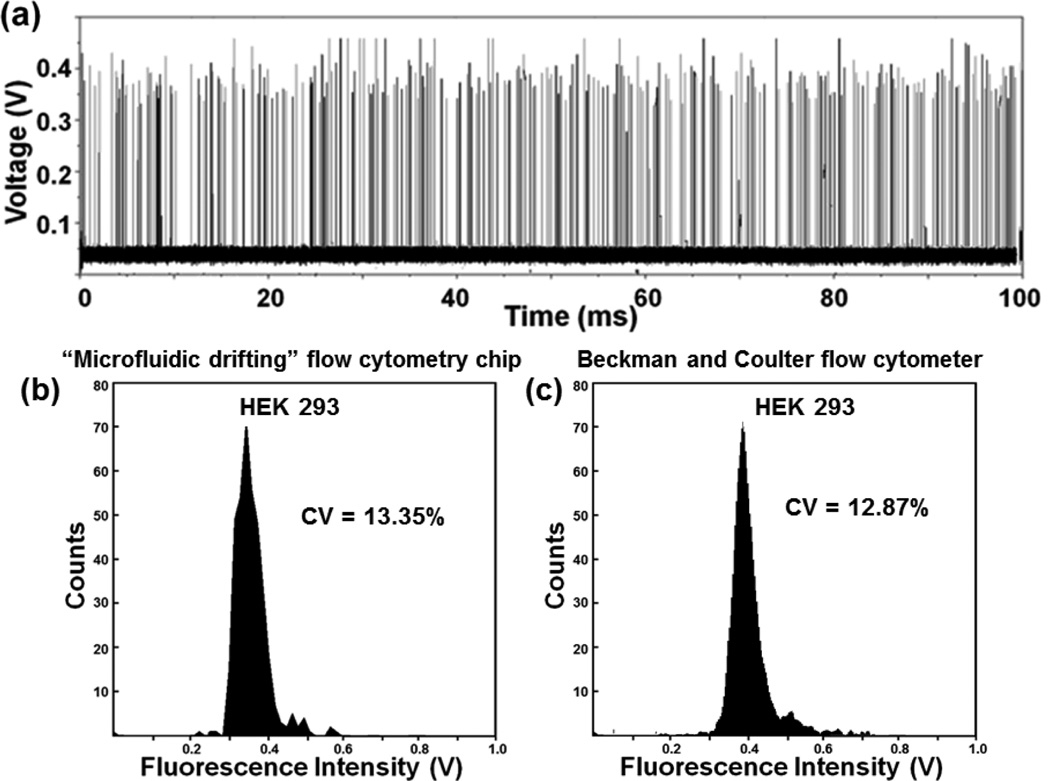
Finally, we tested our devices for the focusing and detection of biological cells. The same devices and setup used for detection of calibration beads was implemented and HEK 293T cells were stained with Calcein AM (Life Technologies, USA) for detection of the fluorescence signal. Fig. S4 (supplementary information) shows the histogram of the peaks from stained HEK 293 cells detected by 70°, 90°, 135°, 180°, and 225° channel devices with CVs of 25.90%, 21.64%, 17.46%, 13.35% and 16.23%, respectively. Fig. 9(a) shows a typical diagram of fluorescent peaks detected from the HEK-293 cells, demonstrating that biological cells can be successfully detected. Fig. 9(b) shows the distribution of the peak heights for the entire 4-sec data recorded. Signals towards the left and right of the peak position can be caused by debris and cell doublets. The histogram of the peak heights in Fig. 9(b) shows that the device can effectively detect fluorescent signals from HEK 293 cells. Moreover, the CV (13.35%) obtained using our flow cytometry chip is comparable to that obtained by passing HEK 293 cells through a commercial Beckman and Coulter flow cytometer (CV: 12.87%). This further demonstrates the efficacy of focusing and detection by the “microfluidic drifting” based flow cytometry device.
Fig. 9.
(a) A typical diagram of fluorescent peaks detected from the HEK-293 cells. (b) The plot shows a single population of HEK-293 cells. The population roughly centers at ~0.35V. The CV is calculated as 13.35 % showing the capability of our “microfluidic drifting” device to effectively focus and identify a single population of HEK 293 cells. (c) The histogram indicates a CV of 12.87% using a commercial Beckman and Coulter flow cytometer.
Conclusion
In summary, we have systematically designed and studied a series of “microfluidic drifting” based 3D hydrodynamic focusing devices with curvature angles ranging from 70° to 270°. Our CFD simulation results were verified experimentally by confocal microscopy, fast camera imaging, and side-view imaging techniques. The device with a curvature angle of 180° showed the best focusing precision (the focusing diameter was ~2.8 µm when 1.9 µm polystyrene beads were used to characterize the device’s performance; i.e., standard deviation of the particle position was ±0.45 µm). Finally a laser-induced fluorescence system was used to demonstrate flow cytometry measurements. Our device demonstrates a throughput of ~2,163 particles s−1, with the possibility of further increases in throughput. Our device achieved a CV of 2.37%, which is comparable to that of a conventional flow cytometer. To the best of our knowledge, this CV value is the best achieved by any microfluidic flow cytometer. Moreover, the flow cytometry chip with a curvature angle of 180° is capable of distinguishing eight peaks when subject to a stringent 8-peak rainbow calibration test. The successful integration of sub-micron-precision “microfluidic drifting” based 3D hydrodynamic particle/cell focusing in a single-layer planar microfluidic device is an important step toward high-performance, microfluidic flow cytometry systems.
Supplementary Material
Acknowledgement
We thank Missy Hazen, Ruth Nissly, Vincent Crespi, Daniel Ahmed, and Justin Kiehne for the technical help with instrumentation and helpful discussions. This research was supported by National Institutes of Health (1DP2OD007209-01), American Asthma Foundation Scholar Award, National Science Foundation (ECCS-0824183 and ECCS-0801922), and the Penn State Center for Nanoscale Science (MRSEC) under grant DMR-0820404. J.P.M. and S.J.L. are supported by the NHLBI Division of Intramural Research. Components of this work were conducted at the Penn State node of the NSF-funded National Nanotechnology Infrastructure Network.
Footnotes
Electronic supplementary information (ESI) available. See DOI: xx.xxxx/xxxxxxxxxx
Notes and references
- 1.Inglis DW, Davis JA, Zieziulewicz TJ, Lawrence DA, Austin RH, Sturm JC. J. Immuno. Methods. 2008;329:151–156. doi: 10.1016/j.jim.2007.10.004. [DOI] [PubMed] [Google Scholar]
- 2.Inglis DW, Morton KJ, Davis JA, Zieziulewicz TJ, Lawrence DA, Austin RH, Sturm JC. Lab Chip. 2008;8:925–931. doi: 10.1039/b800721g. [DOI] [PubMed] [Google Scholar]
- 3.Laerum OD, Farsund T. Cytometry Part A. 1981;2:1–13. doi: 10.1002/cyto.990020102. [DOI] [PubMed] [Google Scholar]
- 4.Shapiro HM, Leif RC. Practical flow cytometry. New York: Wiley-Liss; 2003. [Google Scholar]
- 5.Brown M, Wittwer C. Clin. Chem. 2000;46:1221–1229. [PubMed] [Google Scholar]
- 6.Dagur PK, Biancotto A, Wei L, Sen HN, Yao M, Strober W, Nussenblatt RB, McCoy JP. J. Autoimmun. 2011;37:319–327. doi: 10.1016/j.jaut.2011.09.003. [DOI] [PMC free article] [PubMed] [Google Scholar]
- 7.Cai X, Pacheco-Rodriguez G, Fan QY, Haughey M, Samsel L, El-Chemaly S, Wu HP, McCoy JP, Steagall WK, Lin JP, Darling TN, Moss J. Am. J. Respir. Crit. Care Med. 2010;182:1410–1418. doi: 10.1164/rccm.201003-0489OC. [DOI] [PMC free article] [PubMed] [Google Scholar]
- 8.Lapsley MI, Wang L, Huang TJ. Biomarkers in Medicine. 2013;7:75–78. doi: 10.2217/bmm.12.103. [DOI] [PubMed] [Google Scholar]
- 9.Mao X, Huang TJ. Lab on a Chip. 2012;12:1412–1416. doi: 10.1039/c2lc90022j. [DOI] [PMC free article] [PubMed] [Google Scholar]
- 10.Zhan Y, Loufakis DN, Bao N, Lu C. Lab Chip. 2012;12:5063–5068. doi: 10.1039/c2lc40522a. [DOI] [PubMed] [Google Scholar]
- 11.Lin S-CS, Mao X, Huang TJ. Lab Chip. 2012;12:2766–2770. doi: 10.1039/c2lc90076a. [DOI] [PMC free article] [PubMed] [Google Scholar]
- 12.Waldrop SL, Pitcher CJ, Peterson DM, Maino VC, Picker LJ. J. Clin. Invest. 1997;99:1739–1750. doi: 10.1172/JCI119338. [DOI] [PMC free article] [PubMed] [Google Scholar]
- 13.Jayat C, Ratinaud M. Biol. Cell. 1993;78:15–25. doi: 10.1016/0248-4900(93)90110-z. [DOI] [PubMed] [Google Scholar]
- 14.Skommer J, Akagi J, Takeda K, Fujimura Y, Khoshmanesh K, Wlodkowic D. Biosensors and Bioelectronics. 2013;42:586–591. doi: 10.1016/j.bios.2012.11.008. [DOI] [PubMed] [Google Scholar]
- 15.Godin J, Chen C-H, Cho SHC, Qiao W, Tsai F, Lo Y-H. J. Biophotonics. 2008;1:355–376. doi: 10.1002/jbio.200810018. [DOI] [PMC free article] [PubMed] [Google Scholar]
- 16.Godin J, Lien V, Lo Y-H. Appl. Phys. Lett. 2006;89:061106. [Google Scholar]
- 17.Godin J, Lo Y-H. Biomed. Opt. Express. 2010;1:1472–1479. doi: 10.1364/BOE.1.001472. [DOI] [PMC free article] [PubMed] [Google Scholar]
- 18.Ding X, Lin S-CS, Lapsley MI, Li S, Guo X, Chan CYK, Chiang I-K, McCoy JP, Huang TJ. Lab Chip. 2012;12:4228–4231. doi: 10.1039/c2lc40751e. [DOI] [PMC free article] [PubMed] [Google Scholar]
- 19.Shapiro HM, Perlmutter NG. Cytometry Part A. 2001;44:133–136. doi: 10.1002/1097-0320(20010601)44:2<133::aid-cyto1092>3.0.co;2-s. [DOI] [PubMed] [Google Scholar]
- 20.Neuži P, Giselbrecht S, Länge K, Huang TJ, Manz A. Nature Reviews Drug discovery. 2012;11:620–632. doi: 10.1038/nrd3799. [DOI] [PMC free article] [PubMed] [Google Scholar]
- 21.Choi S, Song S, Choi C, Park J. Small. 2008;4:634–641. doi: 10.1002/smll.200700308. [DOI] [PubMed] [Google Scholar]
- 22.Choi S, Park J. Anal. Chem. 2008;80:3035–3039. doi: 10.1021/ac8001319. [DOI] [PubMed] [Google Scholar]
- 23.Cheng X, Liu Y, Irimia D, Demirci U, Yang L, Zamir L, Rodríguez WR, Toner M, Bashir R. Lab Chip. 2007;7:746–755. doi: 10.1039/b705082h. [DOI] [PMC free article] [PubMed] [Google Scholar]
- 24.Watkins N, Venkatesan BM, Toner M, Rodriguez W, Bashir R. Lab Chip. 2009;9:3177–3184. doi: 10.1039/b912214a. [DOI] [PMC free article] [PubMed] [Google Scholar]
- 25.Xia Y, Whitesides GM. Annu. Rev. Mater. Sci. 1998;28:153–184. [Google Scholar]
- 26.Shi J, Mao X, Ahmed D, Colletti A, Huang TJ. Lab Chip. 2008;8:221–223. doi: 10.1039/b716321e. [DOI] [PubMed] [Google Scholar]
- 27.Cho SH, Godin JM, Chen CH, Qiao W, Lee H, Lo Y-H. Biomicrofluidics. 2010;4:043001. doi: 10.1063/1.3511706. [DOI] [PMC free article] [PubMed] [Google Scholar]
- 28.Sharma H, Nguyen D, Chen A, Lew V, Khine M. Ann. Biomed. Eng. 2011;39:1313–1327. doi: 10.1007/s10439-010-0213-1. [DOI] [PMC free article] [PubMed] [Google Scholar]
- 29.Wang Z, El-Ali J, Engelund M, Gotsaed T, Perch-Nielsen IR, Mogensen KB, Snakenborg D, Kutter JP, Wolff A. Lab Chip. 2004;4:372–377. doi: 10.1039/b400663a. [DOI] [PubMed] [Google Scholar]
- 30.McKenna BK, Evans JG, Cheung MC, Ehrlich DJ. Nat. Methods. 8:401–403. doi: 10.1038/nmeth.1595. [DOI] [PMC free article] [PubMed] [Google Scholar]
- 31.Chu H, Doh I, Cho Y. Lab Chip. 2009;9:686–691. doi: 10.1039/b812213j. [DOI] [PubMed] [Google Scholar]
- 32.Schrum DP, Culbertson CT, Jacobson SC, Ramsey JM. Anal. Chem. 1999;71:4173–4177. doi: 10.1021/ac990372u. [DOI] [PubMed] [Google Scholar]
- 33.McClain MA, Culbertson CT, Jacobson SC, Ramsey JM. Anal. Chem. 2001;73:5334–5338. doi: 10.1021/ac010504v. [DOI] [PubMed] [Google Scholar]
- 34.Rosenauer M, Buchegger W, Finoulst I, Verhaert P, Vellekoop M. Microfluid. Nanofluid. 2011;10:761–771. [Google Scholar]
- 35.Terray A, Hart SJ. Lab Chip. 2010;10:1729–1731. doi: 10.1039/b927244e. [DOI] [PubMed] [Google Scholar]
- 36.Watkins N, Venkatesan BM, Toner M, Rodriguez W, Bashir R. Lab Chip. 2009;9:3177–3184. doi: 10.1039/b912214a. [DOI] [PMC free article] [PubMed] [Google Scholar]
- 37.Mao X, Lin S-CS, Dong C, Huang TJ. Lab Chip. 2009;9:1583–1589. doi: 10.1039/b820138b. [DOI] [PubMed] [Google Scholar]
- 38.Goddard G, Martin JC, Graves SW, Kaduchak G. cytometry part A. 2006;69:66–74. doi: 10.1002/cyto.a.20205. [DOI] [PubMed] [Google Scholar]
- 39.Eyal S, Quake SR. Electrophoresis. 2002;23:2653–2657. doi: 10.1002/1522-2683(200208)23:16<2653::AID-ELPS2653>3.0.CO;2-H. [DOI] [PubMed] [Google Scholar]
- 40.Scott R, Sethu P, Harnett CK. Rev. Sci. Instrums. 2008;79:046104. doi: 10.1063/1.2900010. [DOI] [PubMed] [Google Scholar]
- 41.Fu C-C, Ossato G, Long M, Digman MA, Gopinathan A, Lee LP, Gratton E, Khine M. Appl. Phys. Lett. 2010;97:203101. [Google Scholar]
- 42.Chang C, Huang Z, Yang R. J. Micromech. Microeng. 2007;17:1479–1486. [Google Scholar]
- 43.Simonnet C, Groisman A. Appl. Phys. Lett. 2005;87:114104. [Google Scholar]
- 44.Kummrow A, Theisen J, Frankowski M, Tuchscheerer A, Yildirim H, Brattke K, Schmidt M, Neukammer J. Lab Chip. 2009;9:972–981. doi: 10.1039/b808336c. [DOI] [PubMed] [Google Scholar]
- 45.Sundararajan N, Pio M, Lee L, Berlin A. J. Microelectromech. Syst. 2004;13:559–567. [Google Scholar]
- 46.Howell P, Golden J, Hilliard L, Erickson J, Mott D, Ligler F. Lab Chip. 2008;8:1087–1096. doi: 10.1039/b719381e. [DOI] [PMC free article] [PubMed] [Google Scholar]
- 47.Mao X, Waldeisen JR, Huang TJ. Lab Chip. 2007;7:1260–1262. doi: 10.1039/b711155j. [DOI] [PubMed] [Google Scholar]
- 48.Zhou J, Papautsky I. Lab Chip. 2013;13:1121–1132. doi: 10.1039/c2lc41248a. [DOI] [PubMed] [Google Scholar]
- 49.Simonnet C, Groisman A. Anal. Chem. 2006;78:5653–5663. doi: 10.1021/ac060340o. [DOI] [PubMed] [Google Scholar]
- 50.Asgar A, Bhagat S. Biomed. Microdevices. 2010;12:187–195. doi: 10.1007/s10544-009-9374-9. [DOI] [PubMed] [Google Scholar]
- 51.Piyasena ME, Suthanthiraraj PPA, Applegate RW, Goumas AM, Woods TA, López GP, Graves SW. Anal. Chem. 2012;84:1831–1839. doi: 10.1021/ac200963n. [DOI] [PMC free article] [PubMed] [Google Scholar]
- 52.Shi J, Yazdi S, Lin SS, Ding X, Chiang I, Sharp K, Huang TJ. Lab Chip. 2011;11:2319–2324. doi: 10.1039/c1lc20042a. [DOI] [PMC free article] [PubMed] [Google Scholar]
- 53.Di Carlo D, Edd JF, Irimia D, Tompkins RG, Toner M. Anal. Chem. 2008;80:2204–2211. doi: 10.1021/ac702283m. [DOI] [PubMed] [Google Scholar]
- 54.Gossett DR, Di Carlo D. Anal. Chem. 2009;81:8459–8465. doi: 10.1021/ac901306y. [DOI] [PubMed] [Google Scholar]
- 55.Oakey J, Applegate RW, Arellano E, Di Carlo D, Graves SW, Toner M. Anal. Chem. 2010;82:3862–3867. doi: 10.1021/ac100387b. [DOI] [PMC free article] [PubMed] [Google Scholar]
- 56.Di Carlo D. Lab Chip. 2009;9:3038–3046. doi: 10.1039/b912547g. [DOI] [PubMed] [Google Scholar]
- 57.Di Carlo D, Irimia D, Tompkins RG, Toner M. Proc. Natl. Acad. Sci. USA. 2007;104:18892–18897. doi: 10.1073/pnas.0704958104. [DOI] [PMC free article] [PubMed] [Google Scholar]
- 58.Lee M, Choi S, Park J. Lab Chip. 2009;9:3155–3160. doi: 10.1039/b910712f. [DOI] [PubMed] [Google Scholar]
- 59.Golden JP, Kim JS, Erickson JS, Hilliard LR, Howell PB, Anderson GP, Nasir M, Ligler FS. Lab Chip. 2009;9:1942–1950. doi: 10.1039/b822442k. [DOI] [PMC free article] [PubMed] [Google Scholar]
- 60.Chiu Y, Cho S, Mei Z, Lien V, Wu T, Lo Y. Lab Chip. 2013;13:1803–1809. doi: 10.1039/c3lc41202d. [DOI] [PMC free article] [PubMed] [Google Scholar]
- 61.Mao X, Lin S-CS, Dong C, Huang TJ. Lab Chip. 2009;9:1583–1589. doi: 10.1039/b820138b. [DOI] [PubMed] [Google Scholar]
- 62.Mao X, Waldeisen JR, Juluri BK, Huang TJ. Lab Chip. 2007;7:1303–1308. doi: 10.1039/b708863a. [DOI] [PubMed] [Google Scholar]
- 63.Mao X, Nawaz AA, Lin SCS, Lapsley MI, Zhao Y, McCoy JP, El-Deiry WS, Huang TJ. Biomicrofluidics. 2012;6:024113. doi: 10.1063/1.3701566. [DOI] [PMC free article] [PubMed] [Google Scholar]
Associated Data
This section collects any data citations, data availability statements, or supplementary materials included in this article.


