Abstract
Site-specific electrochemical deposition is used to prepare polystyrene (PS)-Ag Janus particle arrays with superhydrophobic properties. The analyte molecules can be significantly enriched using the superhydrophobic property of the PS-Ag Janus particle array before SERS detections, enabling an extremely sensitive detection of molecules in a highly diluted solution (e.g., femtomolar level). This superhydrophobic surface enhanced Raman scattering sensing concept described here is of critical significance in biosensing and bioanalysis. Most importantly, the site-specific electrochemical growth method we developed here is a versatile approach that can be used to prepare Janus particle arrays with different properties for various applications.
1 Introduction
Low-concentration detection of biological species is critical for medical and biological applications.1 For instance, low-concentration biomarker and antigen detections may improve early-stage indentification of diseases (e.g., cancer), where early detection is exceptionally important to the survival of the patients.2–4 Surface enhanced Raman scattering (SERS) is an extensively studied method for low-concentration detection because of its unique benefits including label-free, highly specific, and sensitive sensing capabilities.5–11 In order to further increase SERS sensitivity, various “top down” and “bottom up” fabrication techniques have been developed to generate SERS substrates integrated with numerous “hot spots” (i.e., SERS sensitive sites).8–11 However, it is challenging to significantly enhance SERS sensitivity by solely optimizing the structure of the SERS substrates. Therefore, new concepts capable of further augmenting the SERS sensitivity are highly desirable.
Surface wetting property is important in anti-fogging, self-cleaning, and oil/water separation fields.12–15 Both surface modification and surface microstructure design can adjust surface wetting behaviors.12–15 For example, a hydrophobic surface usually becomes more hydrophobic when increasing its surface roughness.12,13 Coincidentally, roughness also plays an important role in improving SERS performance.5–8 This fact inspires us to combine the superhydrophobic surface design and SERS substrate design together by preparing highly surface-roughened noble metal nanostructure arrays. The designed SERS substrate with a superhydrophobic surface is used first to greatly concentrate molecules by several million-fold in a highly diluted solution (e.g., initially femtomolar level), and then drive the concentrated sample into a localized area bearing dense “hot spots” to be probed by SERS. This superhydrophobic surface enhanced Raman scattering (SSERS) concept opens a new avenue toward significantly augmenting the SERS sensitivity without complex procedures to optimize the substrate structure. The SSERS substrate will find applications in the areas of ultrasensitive biosensing and environmental pollution monitoring. Here, site-specific electrochemical deposition (ED) was used to prepare micro/nanostructured polystyrene (PS)-Ag Janus particle arrays with superhydrophobic surfaces. It is noteworthy to mention that the site-specific ED growth concept greatly expands ED capabilities in fabricating nanomaterials with well-defined structures, which can be immediately extended into other material systems (e.g., Cu, Pt, MnO2, ZnO), and even multi-component systems (e.g., Au/Pt/ZnO) with robust structural control capabilities.
2 Results and Discussion
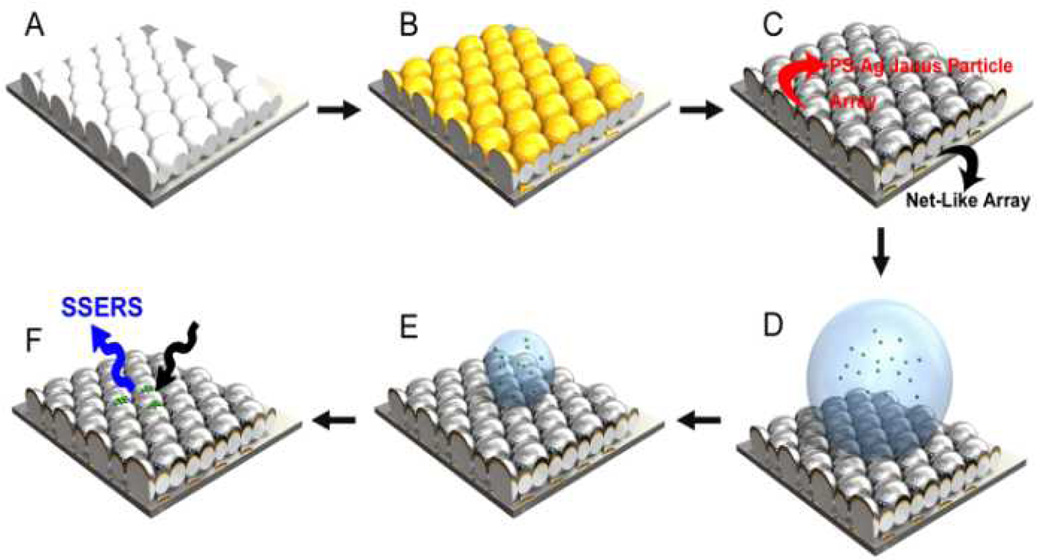
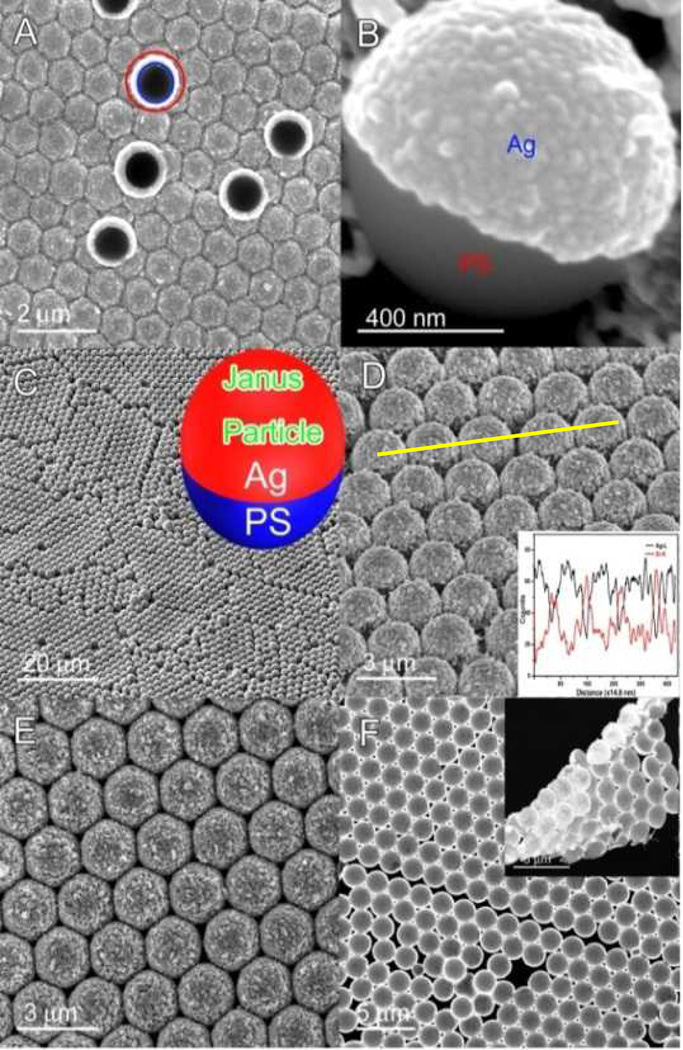
A large-area (> 1 cm2), uniformly structured monolayer colloidal crystal (MCC) template composed of PS spheres was prepared by a spin-coating process as previously reported (Figure 1A).16–20 Considering that the nucleation process during ED is highly dependent on the chemical properties at the material interfaces, a 10 nm-thick Au layer was thermally evaporated on the PS sphere arrays to provide an appropriate surface. Only the top surface of the PS spheres was covered by the Au film, as the bottom halves of the PS spheres were shielded by shadow effects (Figure 1B).18 The MCC template covered by the Au layer was first heated at 110 °C for 10 min to enhance the adhesive force between the PS spheres and the underlying Si substrate, and then used as the cathode electrode to conduct the ED growth of Ag.9 Details can be found in the Supporting Information (Scheme S1 and Figure S1). It was found that Ag was exclusively deposited on the area where covered by the pre-deposited Au film (i.e., site-specific growth), rendering the formation of a hexagonally close-packed PS-Ag Janus particle array and a net-like array (Figure 1C). The PS-Ag Janus particle array is highly ordered (Figure 2A), inherited from the MCC template. Coverage of Ag on the PS sphere surface is about 50% (Figure 2B). Because of the different properties of PS and Ag, PS-Ag Janus particle arrays have valuable application potentials in various fields, including self-assembly,21,22 optics, plasmonics,23–27 and biomedicine.28–32 Moreover, PS spheres are commercially available in sizes ranging from 100 nm to more than 10 µm, any of which can be used to create PS-Ag Janus particles to satisfy application demands in broad areas. As an example, an ordered array consisting of 2 µm diameter PS-Ag Janus particles was also prepared (Figures 2C and D). Line-scan energy dispersive X-ray spectroscopy (EDS) clearly demonstrated that these Janus particles were constituted by PS and Ag (inset in Figure 2D). After dissolving the PS component of the PS-Ag Janus particles using toluene, a well-ordered microcup array was obtained (Figure 2E). The microcups were inverted by peeling them off from the substrate using an adhesive tape, resulting in a concave-up orientation (Figure 2F). Observations at the edge area exhibited the curved structure of the Ag microcups (inset in Figure 2F).
Fig. 1.
Schematic demonstration of the site-specific ED growth of PS-Ag Janus particle array and the net-like array. (A) MCC template. (B) After thermal evaporation of the Au film. (C) Ag was electro-deposited on the Au covered area, giving rise to the formation of PS-Ag Janus particle array and the net-like array in a single ED growth process. (D) The prepared PSAg Janus particle array shows a superhydrophobic property. (E) During water evaporation, concentration of the molecules in the droplet increases. (F) Molecules are delivered to a localized area, facilitating subsequent SERS detections. This concept is called superhydrophobic surface enhanced Raman scattering, or SSERS.
Fig. 2.
(A) SEM image of the site-specific ED growth induced PS-Ag Janus particle array. Circle mark shows an inverted PS-Ag Janus particle. (B) A single PS-Ag Janus particle. (C) 2 µm diameter PS-Ag Janus particle array. (D) Tilt-view image. Inset: EDS line-scan spectrum. Ag microcup array with openings oriented down (E) and upward (F). Inset in (F): Ag microcups at the edge area.
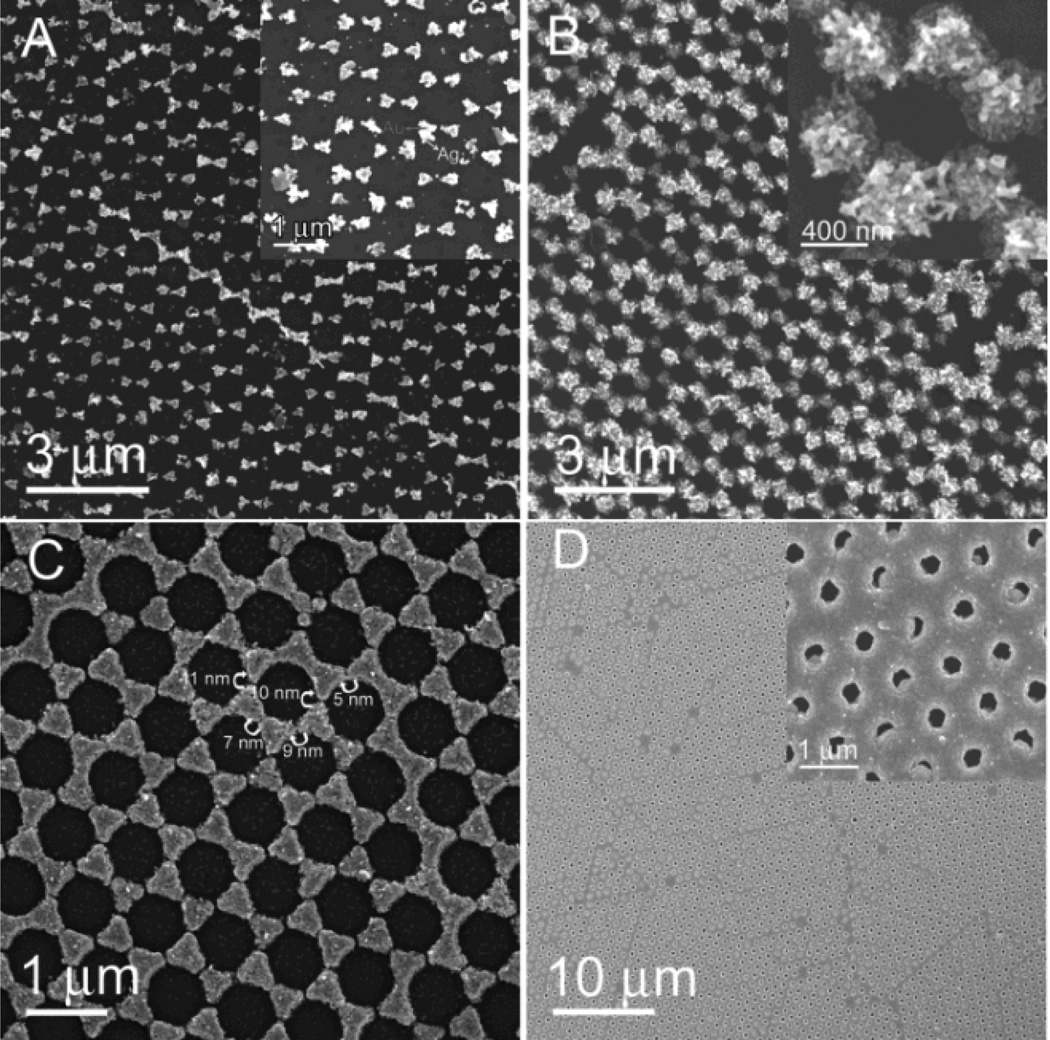
Meanwhile, during thermal evaporation, Au was also deposited on the Si substrate through the gaps within the MCC template, forming a honeycomb array constituted of nanotriangles (known as “nanosphere lithography”).33 Similar to the ED growth of Ag on the Au-coated PS spheres, Ag was preferentially deposited on the Au honeycomb array. As Ag deposition proceeds, neighbouring gold nanotriangles in the honeycomb array were gradually bridged (Figures 3A and B, and insets). By carefully controlling the deposition time, a bow-tie antenna structured Ag surface pattern was obtained (Figure 3C). Gaps as small as 10 nm between adjacent nanotriangles could be achieved (Figure 3C). This level of precision, nearly inaccessible using traditional lithographical methods, further demonstrates that site-specific ED growth is a robust method for preparing surface patterns. The Ag bow-tie surface pattern has significant applications as a plasmonic antenna in particular for SERS sensing applications.34 After a long-time Ag deposition, Ag net-like porous film was prepared (Figure 3D).
Fig. 3.
Selective ED growth of Ag on the Au honeycomb array formed during thermal evaporation. (A), (B), (C), and (D) are related to deposition time for 1 min, 5 min, 15 min, and 30 min, respectively. Insets in (A), (B), and (D) are corresponding to zoom-in images.
In contrast, if a MCC template prepared without the Au seed layer was used as electrode to perform the ED growth, Ag was exclusively deposited on the Si substrate. After removing PS spheres, a macro-porous Ag film was fabricated (Figure S2, Supporting Information). Therefore, surface properties can indeed dominate the nucleation sites during the ED process.
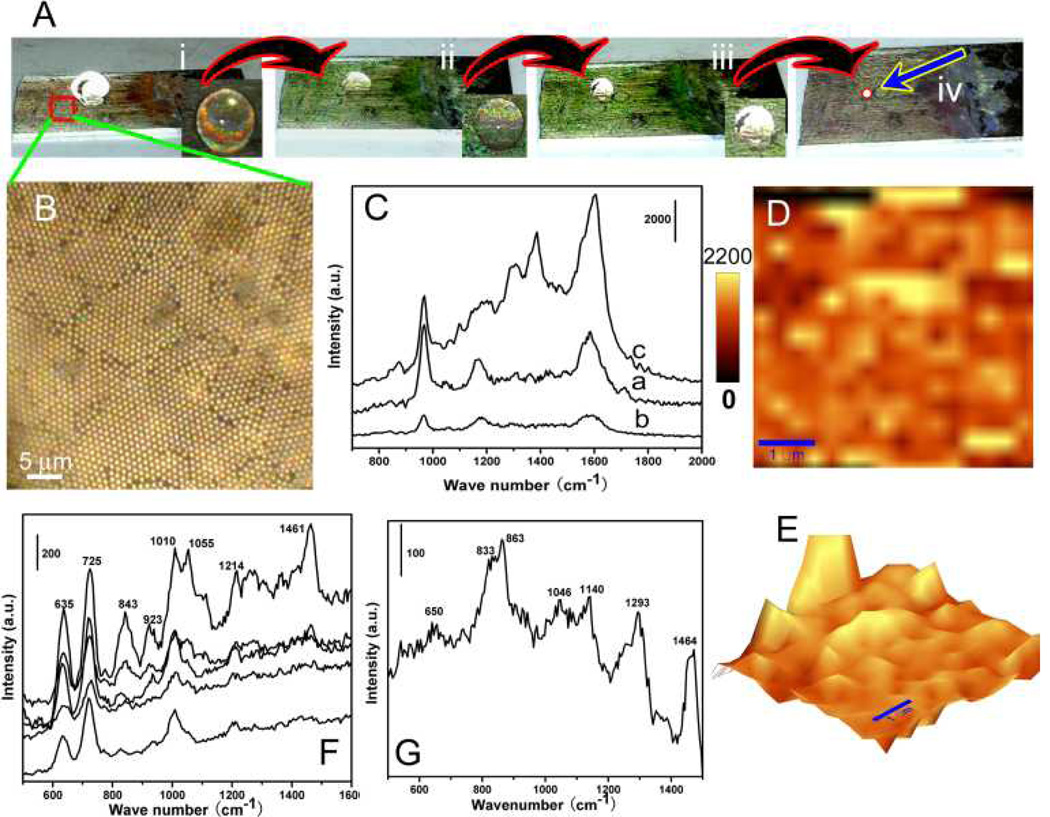
Due to numerous “hot spots” integrated in the highly surface-roughened PS-Ag Janus particles (Figure 2), the as-prepared PS-Ag Janus particle array demonstrated extremely high SERS sensitivity. Also, it exhibited superhydrophobic property with a contact angle of about 150° (Figure 4A and Figure S3 in the Supporting Information).35 A microscope image of the PS-Ag Janus particle array was shown in Figure 4B with an ordered structure. Due to the superhydrophobic property, when a little amount of the analyte solution was put on the PS-Ag Janus particle array, a quasi-spherical liquid droplet formed (Figure 1D). In order to spread the analyte solution on the superhydrophobic PS-Ag Janus particle array to evaluate its SERS performance without employing the superhydrophobic surface-induced enrichment, a little amount (i.e., about 1 wt%) of ethanol was introduced into the Rhodamine 6G (R6G) aqueous solution. Raman spectra of R6G molecules in aqueous solution at a concentrations of 1 nM (curve a) and 1 pM (curve b) were shown in Figure 4C. Predictably, as evaporation proceeds, the spherical droplet formed by the analyte solution becomes more and more concentrated (Figure 1E). Eventually, the analyte molecules are delivered to a localized area, immensely facilitating subsequent SERS detections (Figure 1F). For instance, when 10 µl of R6G solution with a concentration of 1 fM was applied to the superhydrophobic surface of the PS-Ag Janus particle array, the liquid droplet formed a nearly spherical shape (Figure 4A).
Fig. 4.
(A) Experimental results of the superhydrophobic surface-enabled enrichment of analyte molecules. (i) as 10 µl of R6G solution with a concentration of 1 fM was put on the PS-Ag Janus particle array. (ii) after solvent evaporation of 50 mins, (iii) 70 mins, and (iv) 90 mins. After 90-min solvent evaporation, R6G molecules were delivered to a localized area. (B) Optical image of the SSERS substrate. (C) SERS spectra of R6G. Curves a and b are related to SERS spectrum obtained from R6G solutions with concentrations of 10 nM and 1 pM. Curve c is SERS spectrum using the SSERS concept with a starting concentration of 1 fM. (D) and (E) Normal and three-dimensional SERS mapping results of R6G molecules with an integration time of 1 s. Scale bar in (D) and (E) is 1 µm. (F) and (G) Raman spectra of 1 nM protein (PV RdRp) and 1 fM virus (poliovirus type I Sabin) acquired by taking advantage of the SSERS concept.
As water evaporated, the volume of the droplet decreased continuously. Simultaneously, the concentration of R6G in the droplet increased. Evaporation proceeded until the droplet reached a threshold where it became unstable, causing the droplet to collapse and driving the R6G molecules to a localized area (e.g., several tens of square micrometers).36 Supposing that the diameter of the droplet reaches 10 µm before it becomes unstable and collapses, the concentration of R6G will reach as high as 2×10⁻⁸ M. Therefore, more than 10 million-fold enrichment of the molecular concentration can be achieved based on the SSERS concept within 1.5 h.36 By heating the substrate in an oven maintained at 80 °C, the enrichment process could be reduced to less than 10 min. Experimentally, we realized SSERS detections of R6G in aqueous solution at a concentration of 1 fM (curve c in Figure 4C). SERS mapping results verified that an excellent SERS reproducibility was achieved due to the highly ordered structure of the PS-Ag Janus particle array (Figures 4D and E). Since the PS-Ag Janus particle array could detect R6G solutions with a concentration of 1 pM without taking advantage of the superhydrophobic surface-enabled enrichment effect, theoretically, detection of R6G solutions with initial concentrations as low as 1 attomolar could be anticipated using the SSERS concept.
Proteins are the machinery of life and participate in almost every cellular process. As a proof of concept, we showed sensitive protein detection of 1 nM poliovirus (PV) RNA-dependent RNA polymerase (RdRp) (Figure 4F) using the SSERS substrate. SERS spectra at five randomly chosen sites showed some differences, which was most probably induced by the varied protein orientations. Surface modification of the SSERS substrates to anchor protein molecules with the same orientation may solve this problem, which is still under investigation. Low-concentration detection of pathogens is of paramount significance in early-stage disease diagnostics. We further showed low-concentration detection of virus (PV type I Sabin) in about 1 fM solution relying on the SSERS concept (Figure 4G). Origin of the Raman peaks of PV RdRp protein and PV type I Sabin can be found in Table S1 and S2 in the Supporting Information. Further study will achieve ultrasensitive detection of pathogens and biomarkers using PS-Ag Janus particle arrays relying on the SSERS concept, which possesses significant importance in early-stage disease diagnostics (e.g., cancer and HIV early-stage diagnostics).
In the following, we demonstrated that the site-specific ED concept could be extended into other material systems, satisfying application demands in diverse fields. Similar to Ag, Cu deposition on PS spheres occurred exclusively on areas first covered with the Au seed layer, leading to the formation of PS-Cu Janus particle arrays (Figure S4, Supporting Information). The Cu surface of the PS-Cu Janus particles was composed of many octahedrons, which is a robust example of the potential of seed-assisted site-specific ED growth in preparing Janus particle arrays composed of interesting nanostructures. PS-Cu Janus particles featuring this surface structure have never been reported before.
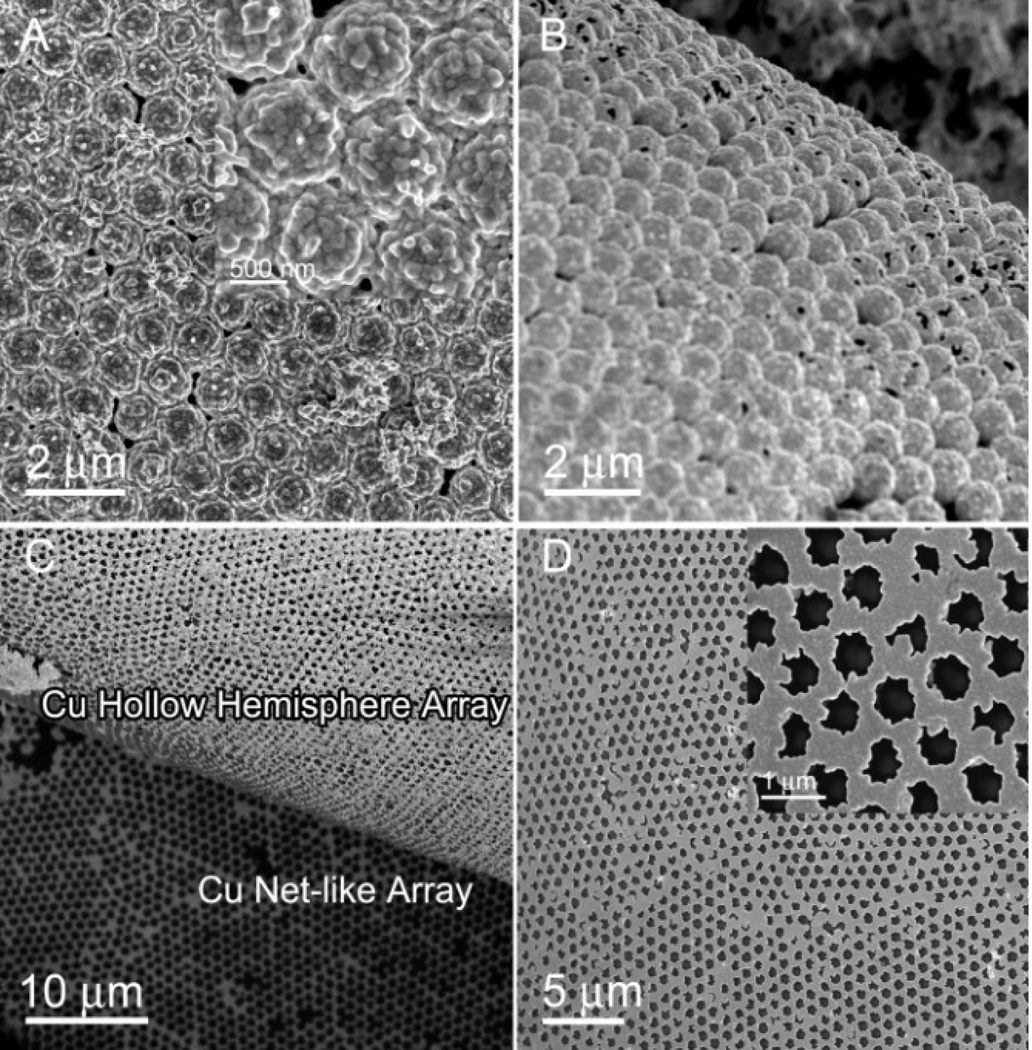
The structure of the PS-Cu Janus particles can be conveniently controlled by changing the deposition voltage. PS-Cu Janus particles with the Cu face composed of many nanoparticles were prepared by increasing the deposition voltage (Figure 5A). After removing the PS spheres, hollow Cu hemisphere arrays were prepared (Figure 5B). A honeycomb array was revealed (Figures 5C and D) after removing the top-layer hollow hemisphere array. This pattern was created by the ED growth of Cu on and around the Au nanotriangles formed by the thermal deposition on the substrate through the gaps within the MCC template. Therefore, PS-Cu Janus particle array and the underlying honeycomb array could be synthesized by a single-step site-specific ED growth.
Fig. 5.
(A) SEM image of the PS-Cu Janus particle array with Cu surface composed of nanoparticles fabricated at 4 V for 5 min. (B) Hollow Cu hemisphere array after dissolving the PS spheres. (C) Hollow Cu hemisphere array and net-like array formed by a single step seed-layer assisted ED process. (D) Enlarged image of the Cu net-like array.
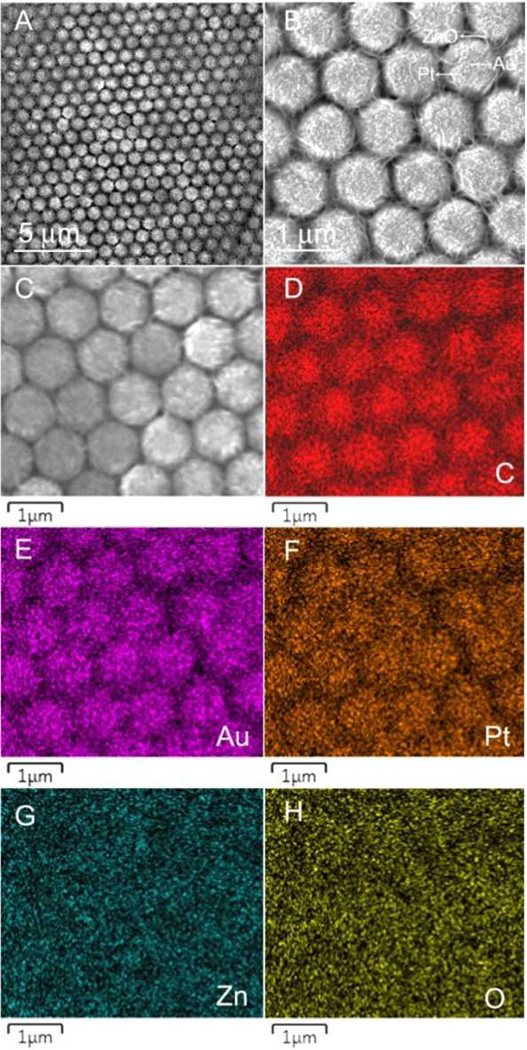
Multi-component nanomaterials can combine many of the merits of the single-component counterpart, as well as introduce unique functionality. For these reasons, more complex multi-component systems are more attractive in many applications.37 We further explored the possibility of creating multi-component nanostructured Janus particles depending on a step-by-step site-specific ED concept. First Pt, and subsequently ZnO was deposited on a 50 nm-thick Au film coated MCC template using ED, resulting in a PS-Au/Pt/ZnO multi-component Janus particle array (Figure 6A). EDS element-mapping results confirmed the formation of the multi-component Janus particles formed ordered array (Figures 6D–H). Because of the broad applications of Au and Pt in catalytic areas and ZnO in solar cells and photocatalytic fields,38 the nest-like PS-Au/Pt/ZnO Janus particle arrays will find applications in diverse fields with greatly improved performances compared with those of single component nanostructures. Multi-component Janus particles comprised of other materials (e.g., Au/Ag/polyaniline, Au/Pt/SnO2, Au/Pt/CdS, etc.) are expected using the step-by-step site-specific ED technique.
Fig. 6.
(A) and (B) SEM images of the nest-like PS-Au/Pt/ZnO Janus particle array. (C) EDS mapping area. (D–H) EDS element mapping results of C, Au, Pt, Zn, and O, respectively.
At last, the underling mechanism of the site-specific growth has to be discussed, which is helpful to rationally engineering unique nanostructures using ED method. It is surprising that materials can be electro-deposited on the Au film where it is without any obvious physical connections to the electrode (i.e., separated from the electrode by the non-conductive PS spheres). Polarization caused by an external electric field induced contactless ED of polymers and metals on the inner wall surface of a micropore have been reported very recently.39 The polarization mechanism might contribute to the contactless site-specific ED growth in our case. However, two fundamental questions are waiting to be clarified in the polarization induced contactless ED deposition: where the metal ions get the electrons and how the current flows in the system.39 Further studies are needed to answer these questions.
Another possibility is that metal ions are first reduced to neutral atoms on the Si substrate, and then some of these atoms aggregate into clusters and grow at the gold nanotriangles, rendering the formation of the bow-tie antenna structured surface patterns (Figure 3). Other atoms migrate from the Si substrate to the Au film located on the top surface of the PS spheres to form nuclei, subsequently giving rise to the formation of Janus particles (Figure 2), as shown in Figure S5 in the Supporting Information.40 If this is the case, considering that PS has poor conductivity and Au is the well-known conductor, the nucleation sites during ED are most probably dependent on the conductivity of the substrate. Further investigations about the formation mechanism of the surface patterns through the contactless site-specific ED technique are still needed. A thorough understanding of the mechanism will allow us to rationally design unique structured surface patterns with strong structural control capabilities.
Conclusions
In summary, we demonstrated that the site-specific electrochemical growth was achieved by introducing an appropriate seed layer. Janus particle arrays comprised of metals, metal oxides, and even multi-component materials were prepared, possessing wide applications in self-assembly, solar cells, catalytic areas, sensors, and biomedicine. Over million-fold enrichment of analyte molecules can be achieved at ease using the superhydrophobic property of the PS-Ag Janus particle array before SERS detections, enabling an extremely sensitive detection of molecules in a highly diluted solution (e.g., femtomolar level). This SSERS concept is of critical significance in biosensing fields (e.g., ultrasensitive biomarker and pathogen detections).
Supplementary Material
Acknowledgements
We gratefully acknowledge the financial support from National Institutes of Health (Director’s New Innovator Award, 1DP2OD007209-01), National Science Foundation (NSF), the Penn State Center for Nanoscale Science (MRSEC)under grant DMR-0820404, and Huck Innovative & Transformational Seed (HITS) Fund. Components of this work were conducted at the Penn State node of the NSF-funded National Nanotechnology Infrastructure Network.
Footnotes
Electronic Supplementary Information (ESI) available: complete experimental details, additional SEM images, and the assignment of the SERS peaks from protein and virus. See DOI: 10.1039/b000000x/
Contributor Information
Shikuan Yang, Email: szy2@psu.edu.
Tony Jun Huang, Email: junhuang@psu.edu.
Notes and references
- 1.Song S, Qin Y, He Y, Huang Q, Fan C, Chen H. Chem. Soc. Rev. 2010;39:4234–4243. doi: 10.1039/c000682n. [DOI] [PubMed] [Google Scholar]
- 2.Cho HS, Yeh EC, Sinha R, Laurence TA, Bearinger JP, Lee LP. ACS Nano. 2012;6:7607–7614. doi: 10.1021/nn203833d. [DOI] [PMC free article] [PubMed] [Google Scholar]
- 3.Law WC, Yong KT, Baev A, Prasad PN. ACS Nano. 2011;5:4858–4864. doi: 10.1021/nn2009485. [DOI] [PubMed] [Google Scholar]
- 4.Han HJ, Kannan RM, Wang SX, Mao GZ, Kusanovic JP, Romero R. Adv. Funct. Mater. 2010;20:409–421. doi: 10.1002/adfm.200901293. [DOI] [PMC free article] [PubMed] [Google Scholar]
- 5.Alvarez-Puebla RA, Liz-Marzan LM. Chem. Soc. Rev. 2012;41:43–51. doi: 10.1039/c1cs15155j. [DOI] [PubMed] [Google Scholar]
- 6.Banholzer MJ, Millstone JE, Qin LD, Mirkin CA. Chem. Soc. Rev. 2008;37:885–897. doi: 10.1039/b710915f. [DOI] [PMC free article] [PubMed] [Google Scholar]
- 7.Rycenga M, Xia XH, Moran CH, Zhou F, Qin D, Li ZY, Xia Y. Angew. Chem. Int. Ed. 2011;50:5473–5477. doi: 10.1002/anie.201101632. [DOI] [PMC free article] [PubMed] [Google Scholar]
- 8.Huang ZL, Meng GW, Huang Q, Yang YJ, Zhu CH, Tang CL. Adv. Mater. 2010;22:4136–4139. doi: 10.1002/adma.201001179. [DOI] [PubMed] [Google Scholar]
- 9.Yang SK, Lapsley MI, Cao BQ, Zhao CL, Zhao YH, Hao QZ, Kiraly B, Scott J, Li WZ, Wang L, Lei Y, Huang TJ. Adv. Funct. Mater. 2013;23:720–730. doi: 10.1002/adfm.201201466. [DOI] [PMC free article] [PubMed] [Google Scholar]
- 10.Yang SK, Xu F, Ostendorp S, Wilde G, Zhao H, Lei Y. Adv. Funct. Mater. 2011;21:2446–2455. [Google Scholar]
- 11.Yang SK, Cai WP, Kong LC, Lei Y. Adv. Funct. Mater. 2010;20:2527–2533. [Google Scholar]
- 12.Chen X, Wu Y, Su B, Wang J, Song Y, Jiang L. Adv. Mater. 2012;24:5884–5889. doi: 10.1002/adma.201202061. [DOI] [PubMed] [Google Scholar]
- 13.Liu KS, Yao X, Jiang L. Chem. Soc. Rev. 2010;39:3240–3255. doi: 10.1039/b917112f. [DOI] [PubMed] [Google Scholar]
- 14.Li Y, Sasaki T, Shimizu Y, Koshizaki N. J. Am. Chem. Soc. 2008;130:14755–14762. doi: 10.1021/ja805077q. [DOI] [PubMed] [Google Scholar]
- 15.Wong TS, Kang SH, Tang SKY, Smythe EJ, Hatton BD, Grinthal A, Aizenberg J. Nature. 2011;477:443–447. doi: 10.1038/nature10447. [DOI] [PubMed] [Google Scholar]
- 16.Ye X, Qi L. Nano Today. 2011;6:608–631. [Google Scholar]
- 17.Vogel N, Fischer J, Mohammadi R, Retsch M, Butt H, Landfester K, Weiss CK, Kreiter M. Nano Lett. 2011;11:446–454. doi: 10.1021/nl103120s. [DOI] [PubMed] [Google Scholar]
- 18.Gwinner MC, Koroknay E, Fu L, Patoka P, Kandulski W, Giersig M, Giessen H. Small. 2009;5:400–406. doi: 10.1002/smll.200800923. [DOI] [PubMed] [Google Scholar]
- 19.Yang SK, Cai WP, Yang JL, Zeng HB. Langmuir. 2009;25:8287–8291. doi: 10.1021/la900496p. [DOI] [PubMed] [Google Scholar]
- 20.Yang SK, Lei Y. Nanoscale. 2011;3:2768–2782. doi: 10.1039/c1nr10296f. [DOI] [PubMed] [Google Scholar]
- 21.Yan J, Bloom M, Bae SC, Luijten E, Granick S. Nature. 2012;491:578–582. doi: 10.1038/nature11619. [DOI] [PubMed] [Google Scholar]
- 22.Chen Q, Whitmer JK, Jiang S, Bae SC, Luijten E, Granick S. Science. 2011;333:199–202. doi: 10.1126/science.1197451. [DOI] [PubMed] [Google Scholar]
- 23.Liu Y, Hao Q, Smalley JST, Liou J, Khoo IC, Huang TJ. Appl. Phys. Lett. 2010;97 09101-3. [Google Scholar]
- 24.Zhang B, Zhao Y, Hao Q, Kiraly B, Khoo IC, Chen S, Huang TJ. Opt. Express. 2011;19:15221–15228. doi: 10.1364/OE.19.015221. [DOI] [PubMed] [Google Scholar]
- 25.Juluri BK, Zheng Y, Ahmed D, Jensen L, Huang TJ. J. Phys. Chem. C. 2008;112:7309–7317. [Google Scholar]
- 26.Zhao Y, Lin SCS, Nawaz AA, Kiraly B, Hao Q, Liu Y, Huang TJ. Opt. Express. 2010;18:23458–23465. doi: 10.1364/OE.18.023458. [DOI] [PubMed] [Google Scholar]
- 27.Zheng Y, Huang TJ, Desai AY, Wang SJ, Tan LK, Gao H, Huan ACH. Appl. Phys. Lett. 2007;90:183117–183119. [Google Scholar]
- 28.Yang S, Guo F, Kiraly B, Mao X, Lu M, Leong KW, Huang TJ. Lab Chip. 2012;12:2097–2102. doi: 10.1039/c2lc90046g. [DOI] [PMC free article] [PubMed] [Google Scholar]
- 29.Mao X, Huang TJ. Lab Chip. 2012;12:1412–1416. doi: 10.1039/c2lc90022j. [DOI] [PMC free article] [PubMed] [Google Scholar]
- 30.Gao W, Pei A, Feng X, Hennessy C, Wang J. J. Am. Chem. Soc. 2013;135:998–1001. doi: 10.1021/ja311455k. [DOI] [PubMed] [Google Scholar]
- 31.Chen Q, Yan J, Zhang J, Bae SC, Granick S. Langmuir. 2012;28:13555–13561. doi: 10.1021/la302226w. [DOI] [PubMed] [Google Scholar]
- 32.Chen Q, Whitmer JK, Jiang S, Bae SC, Luijten E, Granick S. Science. 2011;331:199–202. doi: 10.1126/science.1197451. [DOI] [PubMed] [Google Scholar]
- 33.Vogel N, Jung M, Bocchio NL, Retsch M, Kreiter M, Koper I. Small. 2010;6:104–109. doi: 10.1002/smll.200900497. [DOI] [PubMed] [Google Scholar]
- 34.Ko KD, Kumar A, Fung KH, Ambekar R, Liu G, Fang N, Toussaint KC. Nano Lett. 2011;11:61–65. doi: 10.1021/nl102751m. [DOI] [PubMed] [Google Scholar]
- 35.The superhydrophobic property was induced by the micro/nanostructured Ag surface of the PS-Ag Janus particles. If the gold seed layer was wrapped the entire PS sphere surface, PS-Ag core-shell structures formed array is expected, which should also have superhydrophobic property and can be used as a SSERS substrate.
- 36.Angelis FD, Gentile F, Mecarini F, Das G, Moretti M, Candeloro P, Coluccio ML, Cojoc G, Accardo A, Liberale C, Zaccaria RP, Perozziello G, Tirinato L, Toma A, Cuda G, Cingolani R, Di Fabrizio E. Nature Photon. 2011;5:682–687. [Google Scholar]
- 37.Qu L, Vaia RA, Dai L. ACS Nano. 2011;5:994–1002. doi: 10.1021/nn102411s. [DOI] [PubMed] [Google Scholar]
- 38.Jang ES, Won JH, Hwang SJ, Choy JH. Adv. Mater. 2006;18:3309–3312. [Google Scholar]
- 39.Bouchet A, Descamps E, Mailley P, Livache T, Chatelain F, Haguet V. Small. 2009;5:2297–2303. doi: 10.1002/smll.200900482. [DOI] [PubMed] [Google Scholar]
- 40.Ustarroz J, Hammons JA, Altantzis T, Hubin A, Bals S, Terryn H. J. Am. Chem. Soc. 2013 doi: 10.1021/ja402598k. [DOI] [PubMed] [Google Scholar]
Associated Data
This section collects any data citations, data availability statements, or supplementary materials included in this article.


