

Abstract
Seasonal patterns in behavior and biological parameters are widespread. Here, we examined seasonal changes in whole blood gene expression profiles of 233 healthy subjects. Using weighted gene co-expression network analysis, we identified three co-expression modules showing circannual patterns. Enrichment analysis suggested that this signal stems primarily from red blood cells and blood platelets. Indeed, a large clinical database with 51 142 observations of blood cell counts over 3 years confirmed a corresponding seasonal pattern of counts of red blood cells, reticulocytes and platelets. We found no direct evidence that these changes are linked to genes known to be key players in regulating immune function or circadian rhythm. It is likely, however, that these seasonal changes in cell counts and gene expression profiles in whole blood represent biological and clinical relevant phenomena. Moreover, our findings highlight possible confounding factors relevant to the study of gene expression profiles in subjects collected at geographical locations with disparaging seasonality patterns.
INTRODUCTION
Seasonal patterns in human behavior are widespread and influence mood, sleeping and eating patterns in the general population (1–3). Season-dependent differences have been observed in several diseases. There is latitude-dependent seasonal variation in influenza and respiratory syncytial virus epidemics (4), migraine (5) and incidence and fatality of cardiovascular and cerebrovascular diseases (6,7).
Hematological parameters could be underlying these fluctuations. Infectious diseases affect primarily white blood cells (WBC) (8), and it was recently suggested that seasonality in cardio and cerebrovascular disease could be due to variation in red blood cell health and composition (9,10). Indeed, several hematological parameters including platelet count, neutrophils and mean corpuscular volume (MCV) show seasonal variation with peak values in summer or winter (11–13). Aforementioned small studies addressed seasonality in hematological parameters but with inconsistent and conflicting results. A meta-analysis of circannual patterns in hematocrit levels of 12 793 individuals spanning 18 studies showed that these inconsistencies are likely due to differences in blood volume, age, sex and other within-subject factors (14).
Psychiatric disorders also exhibit seasonal variation. Most notably, mood disorders symptomatology and suicide may be characterized by recurrent patterns throughout the year (15–18). It has been suggested that these seasonal fluctuations in behavior are regulated by the serotonergic system in the brain (19,20). Accordingly, we recently demonstrated a circannual pattern of serotonin metabolite levels in cerebrospinal fluid with a peak in spring (21). Moreover, it has been reported that blood platelet serotonin concentrations show seasonal variation, but with disparaging patterns in controls, depressed patients and schizophrenia subtypes (22).
Besides clinical implications, seasonal variation in hematological parameters is of practical importance for molecular studies involving gene expression since it has been shown that different blood cell types have distinct gene expression profiles (23–25). Differential seasonal variation in gene expression profiles of particular cell types will affect the outcome of such studies when using whole blood.
To address seasonality in gene expression systematically, we investigated circannual patterns of gene expression in whole blood of 233 healthy controls using a systems-biology approach. We subsequently examined circannual variation in blood cell composition of 51 142 subjects collected during a time span of 3 years. We demonstrate for the first time that seasonal patterns in gene expression of whole blood do exist and are correlated with blood cell composition.
RESULTS
Weighted gene co-expression network reconstruction
After quality control of gene expression data, 233 of the 240 samples remained (75% male; mean age 39 years). Detection filtering left 25 361 gene expression probes for analysis. Weighted gene co-expression analysis (WGCNA) resulted in 17 modules, ranging in size from 158 probes in M17 module to 3183 probes in M1. The background module MB contains 7391 probes that do not belong to any of the other modules. This module represents background noise. Figure 1 depicts the network dendrogram.
Figure 1.
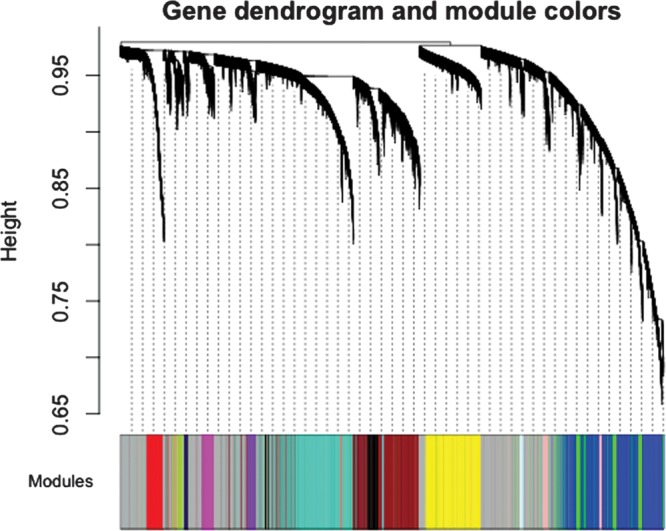
Network construction identifies 17 distinct modules of co-expressed genes in whole blood of 233 healthy human subjects. The dendrogram was produced by average linkage hierarchical clustering of genes using topological overlap. Modules of co-expressed genes were assigned numbers corresponding to the branches indicated by the horizontal bar beneath the dendrogram. Modules are designated by numbers throughout this article: turquoise = M1, blue = M2, brown = M3, yellow = M4, green = M5, red = M6, black = M7, pink = M8, magenta = M9, purple = M10, greenyellow = M11, tan = M12, salmon = M13, cyan = M14, midnightblue = M15, lightcyan = M16, grey60 = M17 and gray background module = MB.
Gene co-expression modules showing a seasonal effect
Significance threshold was set to P = 0.05/(17 × 6) = 4.9 × 10⁻⁴ (Bonferroni correction for number of cosine models × co-expression modules tested). The strongest associations were found for the cosine model with the most significant peaks in August and September. We report correlations and P-values for a seasonal pattern with a peak in August (and trough in February) throughout the article (Supplementary Material, Information 6). M1 (3183 probes) was found to be negatively associated with this seasonal pattern, implying a drop in expression values in August and a peak in February (r = −0.29, P = 5 × 10⁻⁶). M5 (1664 probes) and M16 (215 probes) modules were positively associated, with a peak in expression values in August and a drop in February (r = 0.34, P = 2 × 10⁻⁷ for M5 and r = 0.33, P = 2 × 10⁻⁷ for M16). These modules were not associated with age, sex or season of birth. Results are depicted in the barplot in Figure 2A, D and G.
Figure 2.

Seasonal patterns in gene co-expression modules and blood cell counts. The barplot in (A) depicts the module eigengene values of M16 (215 probes) per month. The barplots in (B) represent standardized red blood cell counts per month for 2008 (months 6–12), 2009 and 2010, respectively. The scatterplot in (C) has standardized red blood cell counts per month on the y-axis versus M16 module eigengene values per month on the x-axis. Colors for each month correspond in all three panels. The barplot in (D) depicts the module eigengene values of M5 (1664 probes) per month. The barplots in (E) represent standardized platelet counts per month for 2008 (months 6–12), 2009 and 2010, respectively. The scatterplot in (F) has standardized platelet counts per month on the y-axis versus M5 module eigengene values per month on the x-axis. Colors for each month correspond in all three panels. The barplot in (G) depicts the module eigengene values of M1 (3183 probes) per month. The barplots in (H) represent standardized proportion of reticulocytes over RBC per month for 2008 (months 6–12), 2009 and 2010, respectively. The scatterplot in (I) has standardized proportion of reticulocytes over RBC per month on the y-axis versus M1 eigengene values per month on the x-axis. Colors for each month correspond in all three panels.
Gene content of season modules suggests association with blood cell composition
The content of M1, M5 and M15 is listed in Supplementary Material, Information 7. The functional annotation tool by DAVID Bioinformatics resources (http://david.abcc.ncifcrf.gov, accessed November 2012) did not yield significant functional enrichment results for M1 and M16. M5 (1458 known genes) was only slightly enriched for ‘acetylation’ compared with background genes (genes detected above detection threshold in current gene expression dataset) with Benjamini & Hochberg corrected P = 5 × 10⁻².
To characterize the gene co-expression modules regarding cell types present in blood, we utilized the userListEnrichment function incorporated in the WGCNA package (26). This function holds 11 lists representing markers for different blood cell types (23,24,25,27). Significance threshold was set to P = 0.05/(3 × 11) = 0.002 (Bonferroni correction for modules × blood list categories). We found M5 to be highly enriched for red blood cell markers (P = 1.0 × 10⁻³³) and to a lesser extent for blood platelets (P = 2.4 × 10⁻⁶) and time of blood draw (P = 2.8 × 10⁻⁵). M16 also shows enrichment for red blood cell markers (P = 2.7 × 10⁻⁶). Finally, M1 is enriched for markers related to red blood cell size distribution (P = 5.7 × 10⁻⁹), red blood cell markers (P = 7.2 × 10⁻⁵) and blood platelet markers (P = 2.0 × 10⁻⁴).
Upon closer inspection we identified many ferritin genes in the modules of interest. Ferritin proteins consist of two subunits, H and L, encoded by separate genes (28). Our gene expression dataset contains 12 probes for ferritin genes, of which 11 end up in the season-related gene networks. M1 contains two probes for FTL (ferritin, light polypeptide). M5 contains FTH1 (ferritin, heavy polypeptide 1) in addition to probes for pseudogenes for FTH1; FTHL2, FTHL8, FTHL11 and two probes for FTHL12. M16 also contains probes for FTH1 pseudogenes; FTHL2, FTHL11 and FTHL3P. Ferritin genes are involved in iron transport, as well as hemoglobin. Red blood cells are the main cell types involved in this process, next to platelets (28). Of the 11 probes for hemoglobin genes available in our dataset, 7 appear in M1: HBB, HBD, HBM, HBQ1, HBZ and 2 probes for HBA2. Both ferritin and hemoglobin genes are reliably expressed in red blood cells and blood platelets (25,29).
Blood cell composition over time confirms seasonal effects
Our results led us to believe that seasonal changes in gene expression could be driven by seasonal variation in blood cell composition. To test this hypothesis, we obtained a large dataset consisting of 51 142 observations of blood cell counts across 3 years. We examined seasonal changes in indices for platelets (platelet count and mean platelet volume), red blood cells (RBC; total RBC, proportion of reticulocytes) and WBC (total WBC, percentages of neutrophils, eosinophils, basophils, lymphocytes and monocytes). Results are displayed in Figure 2B, E and H.
Cross-sectional analysis
The blood cell count data are from different individuals than the ones in our original expression dataset. Therefore, we calculated the mean module eigengenes per month for M1, M5 and M16. Subsequently, we averaged the cell counts for each type per month, over 3 years and performed a one-sided (P < 0.1) correlation test based on expectations from the previous enrichment results. Results are displayed in Figure 2C, F and I.
Both M5 and M16 are enriched for red blood cell markers. Indeed, both module eigengenes correlated positively with the proportion of reticulocytes over RBC (M16: r = 0.82, P = 0.001, M5: r = 0.74, P = 0.006). Although visual inspection of the barplot in Figure 2E does suggest a seasonal pattern in total RBC, the correlation is not significant for either module (M16: r = 0.26, P = 0.42; M5: r = 0.29, P = 0.36). Both modules are correlated negatively with platelet count (M16: r = −0.60, P = 0.04; M5: r = −0.52, P = 0.08). Finally, there was a negative correlation with percentage of monocytes over WBC (M16: r = −0.51, P = 0.09; M5: r = −0.55, P = 0.06). M1 (enriched for platelet markers) was indeed positively correlated with platelet count (r = 0.57, P = 0.05) and negatively to mean platelet volume (r = −0.57, P = 0.05). Finally, the M1 module eigengene was negatively correlated to proportion of reticulocytes over RBC (r = −0.69, P = 0.01).
To confirm a similar seasonal pattern, we performed a linear regression with cosine function peaking in August with above-mentioned blood cell parameters. We selected 2010 since this year contains the most individual measurements. Indeed, we find that mean platelet volume (MPV) (t = 13.2, P = 1.2 × 10−39, difference peak versus trough 0.19 × 10⁻¹⁵l), RBC (t = 7.9, P = 2.0 × 10⁻¹⁵, difference peak versus trough 0.08 × 10⁻¹² l) and proportion of reticulocytes over RBC (t = 5.4, P = 5.3 × 10⁻⁸, difference peak versus trough 1.52) are positively correlated with the cosine function. In addition, percentage of monocytes (t = −3.2, P = 1.4 × 10⁻³, difference peak versus trough 0.27%) and platelet count (t = −12.0, P = 4.3 × 10⁻³³, difference peak versus trough 0.02 × 10⁻⁹ l) are negatively correlated to a seasonal pattern with a peak in August.
Blood cell counts are known to differ between males and females and change over age. All except one parameter were significantly different between sexes (Supplementary Material, Information 8). However, stratified analysis for each sex separately and for two age bins (18–40 and 40–65) resulted in the same seasonal pattern in blood cell counts (Supplementary Material, Information 9).
Longitudinal analysis
To investigate a seasonal pattern within individuals over time, we performed longitudinal analyses. We considered a first season (months 12–5) and second season of the year (months 6–11). We selected individuals with a maximum of two measurements per year and at least one in each season. This resulted in 2459 individuals. A Wilcoxon rank-sum test to test for differences between the two seasons was applied to RBC, proportion of reticulocytes, blood platelets, MPV and percentage of monocytes. Bonferroni correction for multiple testing resulted in a significance threshold of P = 0.05/5 = 0.01. In line with cross-sectional results, RBC (P = 0.001, difference of 0.03 × 10⁻¹² l), proportion of reticulocytes (P = 2.2 × 10⁻⁶, difference of 0.06 proportion over reticulocytes) and MPV (P = 6.0 × 10⁻¹⁴, difference of 0.07 × 10⁻¹⁵ l) showed higher values in the second season and the blood platelet count (P = 4.2 × 10⁻¹⁵, difference of 0.07 × 10⁻⁹ l1) the reverse pattern. Percentage of monocytes did not reach a significant difference between seasons.
DISCUSSION
In this study, we observed a circannual pattern of gene expression in whole blood of a healthy control population using co-expression network analysis. The gene co-expression modules that show seasonal patterns are enriched for particular blood cell types, mainly RBC and blood platelets. We subsequently confirmed that the observed variation of expression profiles are likely to stem from seasonal fluctuation in whole blood cell composition.
Previous studies have addressed seasonality in hematological parameters, but results regarding the peaks and troughs are inconsistent (11–13). Although these inconsistencies are thought to result from factors like age and sex (14), in our large sample we consistently find the same seasonal patterns for men and women as well as for the different age groups. Our results suggest that the fluctuations in whole blood gene expression coincide with particular cell-type counts, which does not exclude the possibility of a different seasonal pattern for remaining cell types. The M1 gene co-expression module is upregulated in the first half of the year and downregulated in the second, with the most significant trough in August. This module is enriched for RBC markers and platelets, which is confirmed by corresponding seasonal fluctuation in platelets in a large blood cell counts dataset. The percentage of monocytes also shows this pattern. Two other gene co-expression modules (M5 and M16) show under-expression in the first half of the year and overexpression in the second. These modules are enriched for RBC markers and this pattern is correlated with the seasonal fluctuation in proportion of reticulocytes.
Although WBC are most transcriptionally active, gene expression differences related to different blood cell-type counts have been reported before (23). Reticulocytes are immature red blood cells and contain residual RNA. This could explain, why the proportion of reticulocytes gives a stronger seasonal signal than the total count of RBC in our analyses. Although RBC discard their nucleus during maturation, they are still found to express some 1000 transcripts (25). Blood platelets are also anuclear but express around roughly 2000 transcripts, of which the majority is mitochondrial (29). A recent study even demonstrates a complex transcriptional landscape in blood platelets (30). The fact that in our study mean platelet volume and platelet count show inverse correlations indicates that, in contrast to RBC, the smaller mature platelets are responsible for the seasonal peak in gene expression. The lesser number of transcripts and the resulting lower variation might be a reason for a subtle seasonal gene expression signal to be picked up from reticulocytes and blood platelets and not WBC.
Although we find important genes involved in regulating circadian rhythm, CLOCK, PER3 and RORA in modules related to season, we do not detect any formal evidence for enrichment of circadian clock genes in any of the modules associated with seasonality (31). Clock genes might have a tight transcriptional pattern related to day and night rhythmicity only and be less important for seasonal cycling. In addition, functional enrichment analyses do not implicate immune-related pathways in the seasonal modules, which suggests that the observed patterns of gene expression changes are unrelated to seasonal exposure of human influenza viruses or other infectious diseases. However, the cell-type markers and ferritin genes point to seasonal fluctuations in iron homeostasis. Ferritin is involved in cellular and organismal iron homeostasis through iron sequestration. Iron is necessary for transport, binding and release of oxygen and disruption of this process is implicated in pathogenesis of disease; e.g. hemochromatosis and diseases characterized by inflammation, infection, injury and repair (such as rheumatoid arthritis, vascular and neurodegenerative diseases) (28). Incidence and fatality of cardio- and cerebrovascular diseases have consistently shown a seasonal pattern with a peak in winter (6,7) possibly linked to the morphology and composition of RBC (9,10), which coincides with the results of the current study. It is unlikely that individuals with seasonal disease confound the current expression sample, since they were screened for cardiovascular, pulmonary and psychiatric disease before inclusion. The involvement of monocytes in iron recycling explains the seasonal fluctuation of monocytes corresponding to that of the M1 blood platelet module (28). It has been hypothesized that hemodilution due to warmer weather decreases the hematocrit values in humans, although measurements are sensitive to within-subject variation (14). In addition, food intake could be involved, since people tend to eat less and lighter food in warmer weather (11). Since subjects in the gene expression part of the study were included after overnight fasting, short-term influence of food intake on gene expression is unlikely.
These results once again highlight the importance of tissue and cell type specificity of gene expression profiles. In addition, it adds a temporal dimension to interpreting laboratory results of whole blood expression data regardless of disease. Researchers should be careful when sampling blood from cases and controls in different seasons. Our study focused on whole blood and observed seasonal differences in gene expression patterns linked to variation in the distribution of cell counts. Other types of tissue might be less temporally reactive, assuming that the patterns of seasonal transcriptional changes are primarily a reflection of circannual changes in the population of cell types in whole blood. Further study is needed to test whether seasonal patterns in gene expression can also be observed in other tissues or within (single) cell types.
One field of research that has to rely on tissue other than that primarily affected (the brain) is that of neurogenetics. It is beyond the scope of this paper to address whether the detected seasonal pattern in blood differs between neuropsychiatric cases and controls, although existing literature hints at a relationship between season on the one hand and disease epidemiology and possibly disturbed seasonal rhythms on the other hand in cases (15–17). Intuitively, case control differences in neuropsychiatric disorders might not necessarily be expected in properties of RBC or blood platelets. However, serotonin is carried by blood platelets and has been shown to exhibit seasonal fluctuation (21,22). A recent study even finds a direct relationship between platelet count and suicidal thoughts (32). In addition, a common variant in the neurogranin (NRGN) gene is associated with schizophrenia (33) and was identified as an intracellular platelet expressed gene highlighted by Gnatenko and colleagues (29). In accordance with this, this gene is assigned to the M1 platelet module in our gene expression results. Finally, medication can influence blood cell counts and several psychoactive drugs, e.g. clozapine, may incur hematological toxicity (34). With regard to healthy individuals, it would be of interest to examine seasonal fluctuations or the absence thereof in geographic locations that have the reverse or no seasonal pattern.
In conclusion, our results indicate a seasonal effect in whole blood gene expression, which is likely caused by fluctuations in whole blood cell composition. This phenomenon may have clinical relevance for incidence and severity of disease but can also be a potential confounding factor in genetic research utilizing whole blood samples.
MATERIALS AND METHODS
Subjects
Two hundred and forty neurological healthy volunteers were recruited as part of a previously published study (20,35) at outpatient pre-operative screening services in four hospitals in The Netherlands, from August 2008 until June 2011. Inclusion criteria were 18–60 years of age and four grandparents born in The Netherlands or other North-Western European countries. Exclusion was based on presence of psychotic or major neurological disorders any use of psychotropic medication (by personal telephone interview). Subjects had fasted at least 6 h before sample collection. Whole blood RNA was collected in PAXgene tubes. All participants gave written informed consent. Medical Research Ethics Committee of the University Medical Center Utrecht, The Netherlands and all local ethics committees approved this study.
Genome-wide expression profiling
Gene expression data for this sample set have been described before (35). In short, for isolation and purification of mRNA from whole blood, the PAXgene extraction kit (Qiagen) was used. Genome-wide RNA expression profiling was obtained with the Illumina HumanRef-12 version 3 arrays at the UCLA Neuroscience Genomics Core. Raw data extraction and background correction were performed using GenomeStudio. The Lumi package in R was used for robust spline normalization and variance stabilizing transformation of the gene expression data (36,37). A probe detection filter was applied to select those probes that were expressed in at least one sample, with the detection P-value as generated by GenomeStudio to P < 0.01. Our gene expression dataset consisted of three batches based on Illumina serial number, normalization between these batches was performed with ComBat (38).
Cosine calculation
For every subject, month of blood draw was recorded (Table 1). A biannual pattern, representing season was calculated using the cosine function (21) for July through December (remaining months represent the opposite correlation by definition). As an example, for a peak in July and trough in January this would be cos((2 × π/12) × (m + 5)) with m being the month # for each month of blood draw with addition of 5 to position the peak in July. Formulae for all months are given in Supplementary Material, Information 1. Cosine outcome was taken as a phenotype in subsequent analyses.
Table 1.
Number of subjects per month
| Month collection | Expression | UPOD 2008 | UPOD 2009 | UPOD 2010 |
|---|---|---|---|---|
| January | 39 | (36) | 2360 | 2785 |
| February | 29 | (57) | 2030 | 2276 |
| March | 24 | (89) | 1808 | 2469 |
| April | 18 | (61) | 1661 | 1708 |
| May | 17 | (57) | 1592 | 1369 |
| June | 19 | 1996 | 1547 | 1475 |
| July | 6 | 2598 | 1399 | 1096 |
| August | 9 | 1865 | 1204 | 1270 |
| September | 17 | 1964 | 1263 | 1293 |
| October | 19 | 1678 | 1293 | 1246 |
| November | 21 | 1586 | 1292 | 1366 |
| December | 15 | 1387 | 1162 | 1104 |
| Total | 233 | 13 074 | 18 611 | 19 457 |
The table contains the number of subjects collected per month, for the expression data and each of the 3 years in the UPOD. Brackets indicate months that have not been included due to limited subjects.
Weighted gene co-expression analysis
Gene expression data were analyzed using WGCNA (39–41). Weighted co-expression networks are based on the matrix of pairwise Pearson correlation coefficients that were constructed using the soft thresholding approach with a β = 6. This method entails raising each correlation to a fixed power by the criterion described by Zhang and Horvath (41). Soft thresholding resulted in a weighted adjacency matrix containing signed pairwise connection strengths.
We define co-expression modules as branches of a hierarchical clustering tree. Specifically, we used average linkage hierarchical clustering with a dissimilarity measure derived from the topological overlap matrix to define a cluster tree. This topological overlap measure is calculated based on the number of shared neighbors (41,42). A dendrogram is produced by hierarchical clustering of 1 − topological overlap; branches of the tree are cut using a dynamic tree cut algorithm to define modules. For branch cutting (module detection), we used the dynamic branch-cutting algorithm implemented in the dynamicTreeCut and WGCNA R library (40,43). Each module (or branch) is subsequently assigned a numeric label based on module size, which is visualized underneath the cluster tree.
To define a representative module expression profile for each module, we summarized the (standardized) gene expression profiles of the module by their first principal component. This statistic is referred to as the module eigengene. The module eigengene can be thought of as an average gene expression value for all probes in a module per sample. Lists of blood cell-type-specific markers were used as input for the userListEnrichment function incorporated in the WGCNA package. This compares the number of overlapping genes to the maximal possible overlap (26).
Blood composition measurements
Data from the Utrecht Patient Oriented Database (UPOD) were used. UPOD is an infrastructure of relational databases comprising data on patient characteristics, hospital discharge diagnoses, medical procedures, medication orders and laboratory tests for all patients treated at the University Medical Center Utrecht (UMC Utrecht) since 2004. The UMC Utrecht is a 1042-bed academic teaching hospital in the Netherlands, with ∼28 000 clinical and 15 000 day care hospitalizations and 334 000 outpatient visits annually. UPOD data acquisition and management are in accordance with current regulations concerning privacy and ethics. The structure and content of UPOD have been described in more detail elsewhere (44). In addition to clinical laboratory data from the laboratory information system, UPOD contains a specific database with hematology data on automated blood cell analyses performed with Abbott Cell-Dyn Sapphire (Abbott Diagnostics, Santa Clara, CA, USA) automated blood cell analyzers used at UMC Utrecht. A feature of this hematology analyzer is that all parameters of the complete blood count are measured irrespective of the requested parameter (45).
We obtained laboratory measurements of patients in 2008 (n = 174 706), 2009 (n = 166 133) and 2010 (n = 177 015). For each measure, we obtained information about age, sex, date of blood draw and the department for which blood was drawn. All departments in the University Medical Center Utrecht measure blood cell counts and, therefore, the data are not biased by hematology department referral. Blood cell parameters included red blood cell count (RBC 10−12 l of blood), mean corpuscular volume (MCV 10−15 l), platelet count (10−9 l of blood), mean platelet volume (MPV 10−15 l) and reticulocytes (10−15 l). Reticulocytes were taken as proportion of total RBC. Parameters also included leukocytes (white blood cells, WBC), neutrophils, basophils, eosinophils, lymphocytes and monocytes (all in 10−9 l of blood). The different types of WBC were converted to a percentage of total WBC.
We performed rigorous quality control in order to select the most complete dataset for the healthiest adult subjects. An overview of all quality control steps and the number of included individuals is outlined in Supplementary Material, Information 2. We disregarded departments with means outside the normal range and >2× SD (list of included/excluded departments and normal values in Supplementary Material, Informations 3 and 4). We also excluded months 1–5 of the year 2008 due to too few observations (n < 100) per month. This resulted in a dataset with n = 13 074 for 2008, n = 18 611 for 2009 and n = 19 457 for 2010. Principal component analysis revealed no systematic effect of admitting department (Supplementary Material, Information 5). For each year, 43% of the individuals were male and the mean age was 44 years old. The number of subjects per month for each year is listed in Table 1. Cross-sectional analysis was performed on this dataset by correlating the mean module eigengene values per month with mean standardized blood cell values for each month over 3 years. Data were standardized (centered by subtracting column mean from each column and scaled by dividing each column by its sample SD). To confirm a similar seasonal pattern, we performed a linear regression with cosine function peaking in August on unstandardized blood cell counts.
For the longitudinal analyses, we divided the year into two seasons, based on seasonal pattern in gene expression: the first season (months 12–5) and second season of the year (months 6–11). Quality control procedures were applied as described above, except for allowing multiple observations per individual. To prevent selecting for the least healthy subjects, we only included individuals with a maximum of two measurements per year, and with at least one measurement per season. This implies that the number of measurements per subject ranges from 3 to 6. Values per season were averaged over the 3 years. This selection resulted in in 2459 individuals (50% male and mean age of 45 years). The difference of the second half versus the first half of the year was tested using a Wilcoxon rank-sum test using the MASS package for R (46).
SUPPLEMENTARY MATERIAL
FUNDING
This work was supported by National Institutes of Health funding R01DA028526 and R01NS058980 to R.A.O.
Supplementary Material
ACKNOWLEDGEMENTS
We thank the participants and staff at the various recruitment centres and Esther Janson and Joe DeYoung for technical assistance.
Conflict of Interest statement.None declared.
REFERENCES
- 1.Harris S., Dawson-Hughes B. Seasonal mood changes in 250 normal women. Psychiatry Res. 1993;49:77–87. doi: 10.1016/0165-1781(93)90031-b. [DOI] [PubMed] [Google Scholar]
- 2.Okawa M., Shirakawa S., Uchiyama M., Oguri M., Kohsaka M., Mishima K., Sakamoto K., Inoue H., Kamei K., Takahashi K. Seasonal variation of mood and behaviour in a healthy middle-aged population in Japan. Acta Psychiatr. Scand. 1996;94:211–216. doi: 10.1111/j.1600-0447.1996.tb09851.x. [DOI] [PubMed] [Google Scholar]
- 3.Chotai J., Smedh K., Johansson C., Nilsson L.G., Adolfsson R. An epidemiological study on gender differences in self-reported seasonal changes in mood and behaviour in a general population of northern Sweden. Nord. J. Psychiatry. 2004;58:429–437. doi: 10.1080/08039480410006052. [DOI] [PubMed] [Google Scholar]
- 4.Bloom-Feshbach K., Alonso W.J., Charu V., Tamerius J., Simonsen L., Miller M.A., Viboud C. Latitudinal variations in seasonal activity of influenza and respiratory syncytial virus (RSV): a global comparative review. PLoS ONE. 2013;8:e54445. doi: 10.1371/journal.pone.0054445. [DOI] [PMC free article] [PubMed] [Google Scholar]
- 5.Alstadhaug K.B., Salvesen R., Bekkelund S.I. Seasonal variation in migraine. Cephalalgia. 2005;25:811–816. doi: 10.1111/j.1468-2982.2005.01018.x. [DOI] [PubMed] [Google Scholar]
- 6.Manfredini R., Fabbian F., Pala M., Tiseo R., De Giorgi A., Manfredini F., Malagoni A.M., Signani F., Andreati C., Boari B., et al. Seasonal and weekly patterns of occurrence of acute cardiovascular diseases: does a gender difference exist? J. Womens Health. 2011;20:1663–1668. doi: 10.1089/jwh.2011.2734. [DOI] [PubMed] [Google Scholar]
- 7.Khan F.A., Engstrom G., Jerntorp I., Pessah-Rasmussen H., Janzon L. Seasonal patterns of incidence and case fatality of stroke in Malmo, Sweden: the STROMA study. Neuroepidemiology. 2005;24:26–31. doi: 10.1159/000081046. [DOI] [PubMed] [Google Scholar]
- 8.Shen H., Li B., Bai B., Hou J., Xu Z., Zhao M., Mao P., Liu A., Li J., Guo T., et al. Laboratory features throughout the disease course of influenza A (H1N1) virus infection. Clin. Lab. 2013;59:337–342. doi: 10.7754/clin.lab.2012.120417. [DOI] [PubMed] [Google Scholar]
- 9.Kurt M., Tanboga I.H., Buyukkaya E., Karakas M.F., Akcay A.B., Sen N. Relation of Red Cell Distribution Width With CHA2DS2-VASc Score in Patients With Nonvalvular Atrial Fibrillation. Clin. Appl. Thrombosis/Hemostasis. 2013 doi: 10.1177/1076029613478157. [Epub ahead of print]. [DOI] [PubMed] [Google Scholar]
- 10.Gaillard C.A., Schiffelers R.M. Red blood cell: barometer of cardiovascular health? Cardiovasc. Res. 2013;98:3–4. doi: 10.1093/cvr/cvt041. [DOI] [PubMed] [Google Scholar]
- 11.Yanai M., Satomura A., Uehara Y., Murakawa M., Takeuchi M., Kumasaka K. Circannual rhythm of laboratory test parameters among chronic haemodialysis patients. Blood Purif. 2008;26:196–203. doi: 10.1159/000117310. [DOI] [PubMed] [Google Scholar]
- 12.Touitou Y., Touitou C., Bogdan A., Reinberg A., Auzeby A., Beck H., Guillet P. Differences between young and elderly subjects in seasonal and circadian variations of total plasma proteins and blood volume as reflected by hemoglobin, hematocrit, and erythrocyte counts. Clin. Chem. 1986;32:801–804. [PubMed] [Google Scholar]
- 13.Frohlich M., Sund M., Russ S., Hoffmeister A., Fischer H.G., Hombach V., Koenig W. Seasonal variations of rheological and hemostatic parameters and acute-phase reactants in young, healthy subjects. Arterioscler. Thromb. Vasc. Biol. 1997;17:2692–2697. doi: 10.1161/01.atv.17.11.2692. [DOI] [PubMed] [Google Scholar]
- 14.Thirup P. Haematocrit: within-subject and seasonal variation. Sports Med. 2003;33:231–243. doi: 10.2165/00007256-200333030-00005. [DOI] [PubMed] [Google Scholar]
- 15.Faedda G.L., Tondo L., Teicher M.H., Baldessarini R.J., Gelbard H.A., Floris G.F. Seasonal mood disorders. Patterns of seasonal recurrence in mania and depression. Arch. Gen. Psychiatry. 1993;50:17–23. doi: 10.1001/archpsyc.1993.01820130019004. [DOI] [PubMed] [Google Scholar]
- 16.Friedman E., Gyulai L., Bhargava M., Landen M., Wisniewski S., Foris J., Ostacher M., Medina R., Thase M. Seasonal changes in clinical status in bipolar disorder: a prospective study in 1000 STEP-BD patients. Acta Psychiatr. Scand. 2006;113:510–517. doi: 10.1111/j.1600-0447.2005.00701.x. [DOI] [PubMed] [Google Scholar]
- 17.Ajdacic-Gross V., Bopp M., Ring M., Gutzwiller F., Rossler W. Seasonality in suicide – a review and search of new concepts for explaining the heterogeneous phenomena. Social Sci. Med. 2010;71:657–666. doi: 10.1016/j.socscimed.2010.05.030. [DOI] [PubMed] [Google Scholar]
- 18.Heerlein A., Valeria C., Medina B. Seasonal variation in suicidal deaths in Chile: its relationship to latitude. Psychopathology. 2006;39:75–79. doi: 10.1159/000090596. [DOI] [PubMed] [Google Scholar]
- 19.Deisenhammer E.A. Weather and suicide: the present state of knowledge on the association of meteorological factors with suicidal behaviour. Acta Psychiatr. Scand. 2003;108:402–409. doi: 10.1046/j.0001-690x.2003.00209.x. [DOI] [PubMed] [Google Scholar]
- 20.Luykx J.J., Bakker S.C., van Geloven N., Eijkemans M.J., Horvath S., Lentjes E., Boks M.P., Strengman E., DeYoung J., Buizer-Voskamp J.E., et al. Seasonal variation of serotonin turnover in human cerebrospinal fluid, depressive symptoms and the role of the 5-HTTLPR. Transl. Psychiatry. 2013;3:e311. doi: 10.1038/tp.2013.84. [DOI] [PMC free article] [PubMed] [Google Scholar]
- 21.Luykx J.J., Bakker S.C., Lentjes E., Boks M.P., van Geloven N., Eijkemans M.J., Janson E., Strengman E., de Lepper A.M., Westenberg H., et al. Season of sampling and season of birth influence serotonin metabolite levels in human cerebrospinal fluid. PLoS ONE. 2012;7:e30497. doi: 10.1371/journal.pone.0030497. [DOI] [PMC free article] [PubMed] [Google Scholar]
- 22.Jakovljevic M., Muck-Seler D., Pivac N., Ljubicic D., Bujas M., Dodig G. Seasonal influence on platelet 5-HT levels in patients with recurrent major depression and schizophrenia. Biol. Psychiatry. 1997;41:1028–1034. doi: 10.1016/s0006-3223(96)00212-0. [DOI] [PubMed] [Google Scholar]
- 23.Whitney A.R., Diehn M., Popper S.J., Alizadeh A.A., Boldrick J.C., Relman D.A., Brown P.O. Individuality and variation in gene expression patterns in human blood. Proc. Natl. Acad. Sci. USA. 2003;100:1896–1901. doi: 10.1073/pnas.252784499. [DOI] [PMC free article] [PubMed] [Google Scholar]
- 24.Gnatenko D.V., Dunn J.J., Schwedes J., Bahou W.F. Transcript profiling of human platelets using microarray and serial analysis of gene expression (SAGE) Methods Mol. Biol. 2009;496:245–272. doi: 10.1007/978-1-59745-553-4_16. [DOI] [PubMed] [Google Scholar]
- 25.Kabanova S., Kleinbongard P., Volkmer J., Andree B., Kelm M., Jax T.W. Gene expression analysis of human red blood cells. Int. J. Med. Sci. 2009;6:156–159. doi: 10.7150/ijms.6.156. [DOI] [PMC free article] [PubMed] [Google Scholar]
- 26.Miller J.A., Cai C., Langfelder P., Geschwind D.H., Kurian S.M., Salomon D.R., Horvath S. Strategies for aggregating gene expression data: the collapseRows R function. BMC Bioinformatics. 2011;12:322. doi: 10.1186/1471-2105-12-322. [DOI] [PMC free article] [PubMed] [Google Scholar]
- 27.Gnatenko D.V., Zhu W., Xu X., Samuel E.T., Monaghan M., Zarrabi M.H., Kim C., Dhundale A., Bahou W.F. Class prediction models of thrombocytosis using genetic biomarkers. Blood. 2010;115:7–14. doi: 10.1182/blood-2009-05-224477. [DOI] [PMC free article] [PubMed] [Google Scholar]
- 28.Torti F.M., Torti S.V. Regulation of ferritin genes and protein. Blood. 2002;99:3505–3516. doi: 10.1182/blood.v99.10.3505. [DOI] [PubMed] [Google Scholar]
- 29.Gnatenko D.V., Dunn J.J., McCorkle S.R., Weissmann D., Perrotta P.L., Bahou W.F. Transcript profiling of human platelets using microarray and serial analysis of gene expression. Blood. 2003;101:2285–2293. doi: 10.1182/blood-2002-09-2797. [DOI] [PubMed] [Google Scholar]
- 30.Bray P.F., McKenzie S.E., Edelstein L.C., Nagalla S., Delgrosso K., Ertel A., Kupper J., Jing Y., Londin E., Loher P., et al. The complex transcriptional landscape of the anucleate human platelet. BMC Genomics. 2013;14:1. doi: 10.1186/1471-2164-14-1. [DOI] [PMC free article] [PubMed] [Google Scholar]
- 31.Moller-Levet C.S., Archer S.N., Bucca G., Laing E.E., Slak A., Kabiljo R., Lo J.C., Santhi N., von Schantz M., Smith C.P., Dijk D.J. Effects of insufficient sleep on circadian rhythmicity and expression amplitude of the human blood transcriptome. Proc. Natl. Acad. Sci. USA. 2013;110:E1132–E1141. doi: 10.1073/pnas.1217154110. [DOI] [PMC free article] [PubMed] [Google Scholar]
- 32.Ragolsky M., Shimon H., Shalev H., Weizman A., Rubin E. Suicidal thoughts are associated with platelet counts in adolescent inpatients. J. Child Adolesc. Psychopharmacol. 2013;23:49–53. doi: 10.1089/cap.2012.0057. [DOI] [PubMed] [Google Scholar]
- 33.Stefansson H., Ophoff R.A., Steinberg S., Andreassen O.A., Cichon S., Rujescu D., Werge T., Pietilainen O.P., Mors O., Mortensen P.B., et al. Common variants conferring risk of schizophrenia. Nature. 2009;460:744–747. doi: 10.1038/nature08186. [DOI] [PMC free article] [PubMed] [Google Scholar]
- 34.Nooijen P.M., Carvalho F., Flanagan R.J. Haematological toxicity of clozapine and some other drugs used in psychiatry. Hum. Psychopharmacol. 2011;26:112–119. doi: 10.1002/hup.1181. [DOI] [PubMed] [Google Scholar]
- 35.Luykx J.J., Bakker S.C., Lentjes E., Neeleman M., Strengman E., Mentink L., DeYoung J., de Jong S., Sul J.H., Eskin E., et al. Genome-wide association study of monoamine metabolite levels in human cerebrospinal fluid. Mol. Psychiatry. 2013 doi: 10.1038/mp.2012.183. [Epub ahead of print] [DOI] [PubMed] [Google Scholar]
- 36.Du P., Kibbe W.A., Lin S.M. lumi: a pipeline for processing Illumina microarray. Bioinformatics. 2008;24:1547–1548. doi: 10.1093/bioinformatics/btn224. [DOI] [PubMed] [Google Scholar]
- 37.Lin S.M., Du P., Huber W., Kibbe W.A. Model-based variance-stabilizing transformation for Illumina microarray data. Nucleic Acids Res. 2008;36:e11. doi: 10.1093/nar/gkm1075. [DOI] [PMC free article] [PubMed] [Google Scholar]
- 38.Johnson W.E., Li C., Rabinovic A. Adjusting batch effects in microarray expression data using empirical Bayes methods. Biostatistics. 2007;8:118–127. doi: 10.1093/biostatistics/kxj037. [DOI] [PubMed] [Google Scholar]
- 39.Horvath S. Weighted Network Analysis: Applications in Genomics and Systems Biology. New York: Springer; 2011. [Google Scholar]
- 40.Langfelder P., Horvath S. WGCNA: an R package for weighted correlation network analysis. BMC Bioinformatics. 2008;9:559. doi: 10.1186/1471-2105-9-559. [DOI] [PMC free article] [PubMed] [Google Scholar]
- 41.Zhang B., Horvath S. A general framework for weighted gene co-expression network analysis. Stat. Appl. Genet. Mol. Biol. 2005;4 doi: 10.2202/1544-6115.1128. Article17. [DOI] [PubMed] [Google Scholar]
- 42.Yip A.M., Horvath S. Gene network interconnectedness and the generalized topological overlap measure. BMC Bioinformatics. 2007;8:22. doi: 10.1186/1471-2105-8-22. [DOI] [PMC free article] [PubMed] [Google Scholar]
- 43.Langfelder P., Zhang B., Horvath S. Defining clusters from a hierarchical cluster tree: the Dynamic Tree Cut package for R. Bioinformatics. 2008;24:719–720. doi: 10.1093/bioinformatics/btm563. [DOI] [PubMed] [Google Scholar]
- 44.ten Berg M.J., Huisman A., van den Bemt P.M., Schobben A.F., Egberts A.C., van Solinge W.W. Linking laboratory and medication data: new opportunities for pharmacoepidemiological research. Clin. Chem. Lab. Med. 2007;45:13–19. doi: 10.1515/CCLM.2007.009. [DOI] [PubMed] [Google Scholar]
- 45.Muller R., Mellors I., Johannessen B., Aarsand A.K., Kiefer P., Hardy J., Kendall R., Scott C.S. European multi-center evaluation of the Abbott cell-Dyn sapphire hematology analyzer. Lab. Hematol. 2006;12:15–31. doi: 10.1532/LH96.05041. [DOI] [PubMed] [Google Scholar]
- 46.Venables W.N., Ripley B.D. Modern Applied Statistics with S. New York: Springer; 2002. [Google Scholar]
- 47.Amr M., Volpe F.M. Seasonal influences on admissions for mood disorders and schizophrenia in a teaching psychiatric hospital in Egypt. J. Affect. Disord. 2012;137:56–60. doi: 10.1016/j.jad.2011.12.039. [DOI] [PubMed] [Google Scholar]
- 48.de Jong S., Boks M.P., Fuller T.F., Strengman E., Janson E., de Kovel C.G., Ori A.P., Vi N., Mulder F., Blom J.D., et al. A gene co-expression network in whole blood of schizophrenia patients is independent of antipsychotic-use and enriched for brain-expressed genes. PLoS ONE. 2012;7:e39498. doi: 10.1371/journal.pone.0039498. [DOI] [PMC free article] [PubMed] [Google Scholar]
- 49.Kurian S.M., Le-Niculescu H., Patel S.D., Bertram D., Davis J., Dike C., Yehyawi N., Lysaker P., Dustin J., Caligiuri M., et al. Identification of blood biomarkers for psychosis using convergent functional genomics. Mol. Psychiatry. 2011;16:37–58. doi: 10.1038/mp.2009.117. [DOI] [PubMed] [Google Scholar]
- 50.Tsuang M.T., Nossova N., Yager T., Tsuang M.M., Guo S.C., Shyu K.G., Glatt S.J., Liew C.C. Assessing the validity of blood-based gene expression profiles for the classification of schizophrenia and bipolar disorder: a preliminary report. Am. J. Med. Genet. B Neuropsychiatr. Genet. 2005;133B:1–5. doi: 10.1002/ajmg.b.30161. [DOI] [PubMed] [Google Scholar]
- 51.Altar C.A., Vawter M.P., Ginsberg S.D. Target identification for CNS diseases by transcriptional profiling. Neuropsychopharmacology. 2009;34:18–54. doi: 10.1038/npp.2008.172. [DOI] [PMC free article] [PubMed] [Google Scholar]
- 52.Booij B.B., Lindahl T., Wetterberg P., Skaane N.V., Saebo S., Feten G., Rye P.D., Kristiansen L.I., Hagen N., Jensen M., et al. A gene expression pattern in blood for the early detection of Alzheimer's disease. J. Alzheimer‘s Dis. 2011;23:109–119. doi: 10.3233/JAD-2010-101518. [DOI] [PubMed] [Google Scholar]
- 53.Saris C.G., Horvath S., van Vught P.W., van Es M.A., Blauw H.M., Fuller T.F., Langfelder P., DeYoung J., Wokke J.H., Veldink J.H., et al. Weighted gene co-expression network analysis of the peripheral blood from Amyotrophic Lateral Sclerosis patients. BMC Genomics. 2009;10:405. doi: 10.1186/1471-2164-10-405. [DOI] [PMC free article] [PubMed] [Google Scholar]
Associated Data
This section collects any data citations, data availability statements, or supplementary materials included in this article.