Abstract
Background
The impact of HIV-infection and CD4 count on diagnosis of tuberculosis (TB) at a population level is incompletely defined.
Objective
To determine how HIV-infection and CD4 count affect disease site, sputum smear status and overall rate of laboratory confirmation (sputum smear microscopy or culture) of TB cases under routine programme conditions.
Design
Retrospective analysis of the 2009 electronic TB register for Cape Town, South Africa.
Results
Of 29,478 TB cases notified in 2009, HIV-status was known in 25,744 (87.3%) of cases of which 13,237 (51.4%) were HIV-positive. Of these, 61.2% had CD4 cell counts <200 cells/μL, 82.7% had counts <350 cells/μL. Laboratory confirmation of TB (by smear or culture) was obtained less frequently in HIV-infected than HIV-uninfected adult cases (53.9% versus 74.3%; P<0.001). HIV-infection was associated with higher proportions of sputum smear-negative and extrapulmonary TB and lower grades of sputum smear-positivity even among those with CD4 counts ≥ 500 cells/μL. However, the relationship between the proportion of cases testing smear-positive and CD4 count was non-linear.
Conclusion
Much TB lacks laboratory confirmation in this setting despite good laboratory services. HIV-associated TB is more difficult to diagnose even at high CD4 cell counts >500 cells/μL, suggesting an early impact after HIV-sero-conversion.
Keywords: tuberculosis, HIV, diagnosis, smear microscopy, culture, acid-fast bacilli
INTRODUCTION
The HIV epidemic has had a devastating impact on tuberculosis (TB) control in sub-Saharan Africa, which currently accounts for 79% of the global burden of HIV-associated TB.1 This is one of the key factors why sub-Saharan Africa is not on track to attain the key STOP TB Partnership goals of halving the 1990 TB prevalence and mortality rates by 2015. South Africa has the highest burden of any country in the region, with TB developing in approximately 1% of the population each year.1 Although a total of 343,715 cases were notified nationally in 2011, this is only 69% of the estimated total burden of disease.1 Moreover, of new notified cases, only 47% tested sputum smear-positive, and these represented just one third of total estimated cases.1 Thus, TB case ascertainment remains a formidable challenge, even in this country that is relatively well resourced with laboratory services compared to much of the rest of Africa.
HIV-coinfection is well recognised to render TB more difficult to diagnose.2–4 To estimate the potential impact of the implementation of new diagnostic tools such as the Xpert MTB/RIF assay in the region, examination of the impact of HIV on TB diagnosis at a population level in sub-Saharan Africa would be helpful. However, for many years this has been hindered by low rates of HIV testing among TB patients, inevitably leading to patient selection and potential for bias in small cross-sectional studies. We have previously reported on 29,478 TB notifications in 2009 in the South African city of Cape Town, which has a population of approximately 3.5 million people and in 2008 had an HIV prevalence of 17.9% among antenatal women aged 15–49 years.5 The high rate of HIV testing (87%) among notified TB cases permitted us to examine the impact of HIV status on TB diagnosis using data from the city’s electronic TB register. Here we report on the population-level impact of HIV-infection and declining CD4 counts on the site of TB disease, sputum smear status and the overall rate of laboratory confirmation by smear or culture.
METHODS
Data sources
Anonymised data were obtained from the Cape Town electronic TB register for the full calendar year of 2009. This is a computerised database collating all data from district TB registers. Notifications were recorded in the register as per national guidelines.6 TB cases ‘transferred in’ from outside Cape Town were excluded. Smear and culture results were recorded in the register, along with use of chest radiographs, tuberculin skin tests (in children) and lymph node aspirates or biopsies. Since this analysis was based on population-level anonymised notification data, ethical review and informed consent were not obtained.
Microbiological investigations
Microbiological investigations for TB were routinely done by the centralised National Health Laboratory Service (NHLS), which participates in a mycobacteriology external quality assurance programme. South African policy was to use sputum smear as the first-line investigation for pulmonary TB and to use culture in addition for retreatment cases, suspected drug-resistance and smear-negative disease.6 Positive smears were graded as ‘scanty’ in the presence of 1–9 acid-fast bacilli (AFB) per 100 oil immersion fields, ‘1+’ with 10–99 AFB per 100 immersion fields, ‘2+’ with 1–10 AFB per 1 immersion field, and ‘3+’ with >10 AFB per immersion field.
Study Definitions
A ‘new’ case was defined as a patient who had never received treatment for TB or who had taken anti-tuberculosis therapy for <4 weeks. A ‘retreatment’ case was defined as any patient who had previously received TB treatment for >4 weeks. Disease site was recorded according to ICD-10 classification codes and classified as ‘pulmonary’, ‘extra-pulmonary’, or ‘both’.
‘Smear-positive’ TB was defined as a case with ≥ 1 documented positive smear. ‘Smear-negative’ TB was defined as a case with no positive smear and ≥ 1 documented negative smears (note: the national TB programme requires 2 negative smears for this definition)6. ‘Smear-negative, culture-positive’ TB was defined as a case with no positive smear, ≥ 1 negative smears and ≥ 1 positive cultures. The highest documented bacillary grading observed was recorded for each smear-positive case. HIV status was defined by serology as positive, negative or unknown. Adults were defined as aged ≥ 15 years.
Statistical analysis
Simple descriptive statistics were used, with the Wilcoxon rank sum test, chi-squared test and chi-squared test-for-trend used when appropriate, and 95% confidence intervals were calculated using the binomial exact method. Data were analysed using Stata version 11.0 (College Station, Texas, USA).
RESULTS
Characteristics of cases
Having excluded cases who were transferred in during treatment (n=1615), a total of 29,478 cases of TB were notified and were eligible for inclusion in this analysis. The median age was 32 years; a majority (67%) of cases were aged 15–44 years and 13.5% were children (Table 1). Pulmonary TB (PTB) was reported in 87.4% of cases and 16.1% were classified as having extra-pulmonary TB (EPTB) with or without concomitant PTB. A wide range of forms of EPTB were reported, but pleural disease accounted for almost half of these (Table 1). Retreatment cases accounted for 26.4% of notifications.
Table 1.
Characteristics of tuberculosis (TB) notifications, stratified by HIV-status.
| ALL n=29,478 |
HIV+ n=13237 |
HIV− n=12,507 |
HIV Unknown n=3,734 |
|
|---|---|---|---|---|
| PROPORTION OF DIAGNOSES | 100% | 44.9% | 42.4% | 12.7% |
| GENDER | ||||
| Female | 13379 (45.4%) | 7091 (53.6%) | 4800 (38.4%) | 1488 (39.9%) |
| AGE | ||||
| Median (IQR) | 32 (23–41) | 33 (28–40) | 30 (19–45) | 24 (4–38) |
| 0 to 4 | 2853 (9.7%) | 313 (2.4%) | 1582 (12.7%) | 958 (25.7%) |
| 5 to 9 | 722 (2.5%) | 133 (1.0%) | 372 (3.0%) | 217 (5.8%) |
| 10 to 14 | 393 (1.3%) | 75 (0.6%) | 227 (1.8%) | 91 (2.4%) |
| 15 to 19 | 1436 (4.9%) | 197 (1.5%) | 988 (7.9%) | 251 (6.7%) |
| 20 to 24 | 3184 (10.8%) | 1098 (8.3%) | 1693 (13.5%) | 393 (10.5%) |
| 25 to 29 | 4294 (14.6%) | 2538 (19.2%) | 1380 (11.0%) | 376 (10.1%) |
| 30 to 34 | 4284 (14.5%) | 2974 (22.5%) | 1015 (8.1%) | 295 (7.9%) |
| 35 to 39 | 3762 (12.8%) | 2452 (18.5%) | 1042(8.3%) | 268 (7.2%) |
| 40 to 44 | 2840 (9.6%) | 1584 (12.0%) | 1053 (8.4%) | 203 (5.4%) |
| 45 to 49 | 2245 (7.6%) | 954 (7.2%) | 1076 (8.6%) | 215 (5.8%) |
| 50 to 54 | 1479 (5.0%) | 493 (3.7%) | 829 (6.6%) | 157 (4.2%) |
| ≥55 | 1986 (6.7%) | 426 (3.2%) | 1250 (10.0%) | 310 (8.3%) |
| CATEGORY | ||||
| New | 21696 (73.6%) | 9290 (70.2%) | 9290 (74.3%) | 3116 (83.5%) |
| Retreatment | 7782 (26.4%) | 3947 (29.8%) | 3217 (25.7%) | 618 (16.6%) |
| SITE | ||||
| PTB | 24721 (83.9%) | 10089 (76.2%) | 11336 (90.6%) | 3296 (88.3%) |
| EPTB | 3723 (12.6%) | 2328 (17.6%) | 1026 (8.2%) | 369 (9.9%) |
| PTB + EPTB | 1034 (3.5%) | 820 (6.2%) | 145 (1.2%) | 69 (1.9%) |
| SITE OF EPTB‡ | ||||
| Pleural | 2,232 (46.9%) | 1,347 (42.8%) | 646 (55.2%) | 239 (54.6%) |
| Miliary | 573 (12.0%) | 481 (15.3%) | 56 (4.8%) | 36 (8.2%) |
| Lymph nodes | 565 (11.9%) | 368 (11.7%) | 152 (13.0%) | 45 (10.3%) |
| Meningitis | 448 (9.4%) | 303 (9.6%) | 99 (8.5%) | 46 (10.5%) |
| Bones / joints | 153 (3.2%) | 98 (3.1%) | 43 (3.7%) | 12 (2.7%) |
| Genito-urinary | 42 (0.9%) | 20 (0.6%) | 21 (1.8%) | 1 (0.2%) |
| Not specified | 801 (16.8%) | 578 (18.4%) | 161 (13.8%) | 62 (14.2%) |
| CD4 (cells/μL)# | ||||
| Median (IQR) | 153 (70–282) | |||
| LABORATORY CONFIRMATION | ||||
| Smear + | 12311 (41.8%) | 4310 (32.6%) | 6539 (52.3%) | 1462 (39.2%) |
| Smear − Culture + | 4184 (14.2%) | 2588 (19.6%) | 1290 (10.3%) | 306 (8.2%) |
| No Confirmation | 12983 (44.0%) | 6339 (47.9%) | 4678 (37.4%) | 1966 (52.7%) |
Data presented as number (%) or median (IQR). Column percentages are shown.
Percentages shown for sites of EPTB reflect proportions of those with extra-pulmonary disease with or without concomitant PTB.
CD4 count available for 89.3% of HIV-infected cases.
PTB = pulmonary TB; EPTB = extra-pulmonary TB; ART = antiretroviral therapy.
HIV status
HIV-status was known for 87.3% of cases and, of these, 51.4% tested HIV-positive. Cases of HIV-associated TB were observed across all age categories (Table 1), but adults aged 20–49 years accounted for 87.7% of these. A majority of total TB cases were male. However, of HIV-associated cases, more than half were female. EPTB was much more frequent in HIV-infected cases (23.8% vs. 9.4%; p<0.001) and much of this difference was due to the higher proportion of miliary disease in those with HIV-coinfection (15.3% vs. 4.8% of those with EPTB; p<0.001).
CD4 cell counts of HIV-infected cases
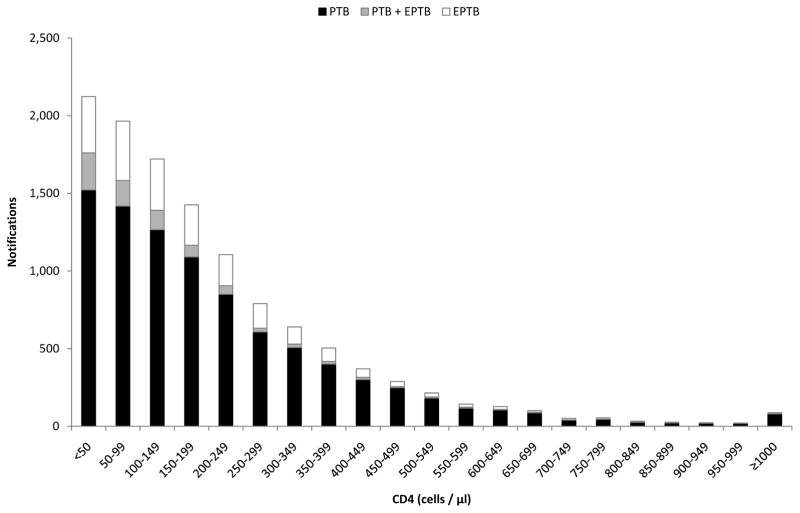
CD4 counts were available for 89.3% of HIV-infected cases (median, 153 cells/μL; inter-quartile range (IQR) 70–282). Figure 1 reveals that although patients with HIV-associated TB had a wide spectrum of CD4 cell counts, the distribution was highly skewed; 61.2% of cases had a CD4 count <200 cells/μL, 21.5% had counts of 200–349 cells/μL, 9.8% had counts of 350–499 cells/μL and 7.5% had counts ≥ 500 cells/μL. Table 2 shows the characteristics of HIV-infected adults and adolescents stratified by CD4 count. Compared to those in higher CD4 count strata, those in lower strata were more likely to be male, less likely to be retreatment cases and a greater proportion had extrapulmonary (especially miliary) disease.
Figure 1.
Bar chart showing notifications of HIV-associated tuberculosis (TB) stratified by CD4 count and disease site (Footnotes: PTB = pulmonary TB; EPTB = extra-pulmonary TB).
Table 2.
Characteristics of HIV-infected patients with tuberculosis (TB) aged ≥ 10 years (n=11,534) stratified by CD4 count.
| CD4 (cells/μL) | ALL (n=11,534) | <50 (n=2,061) | 50–99 (n=1,952) | 100–149 (n=1,704) | 150–199 (n=1,406) | 200–349 (n=2,501) | 350–499 (n=1,126) | ≥500 (n=784) |
|---|---|---|---|---|---|---|---|---|
| PROPORTION OF DIAGNOSES | 100.0% | 17.9% | 16.9% | 14.8% | 12.2% | 21.7% | 9.8% | 6.8% |
| GENDER | ||||||||
| Female | 6244 (54.1%) | 1011 (49.1%) | 940 (48.2%) | 915 (53.7%) | 795 (56.5%) | 1411 (56.4%) | 688 (61.1%) | 484 (61.7%) |
| AGE | ||||||||
| Median (IQR) | 34 (28–40) | 33 (29–40) | 34 (29–41) | 33 (28–40) | 34 (28–40) | 33 (28–40) | 33 (27–40) | 33 (27–40) |
| CATEGORY | ||||||||
| New | 8043 (69.7%) | 1507 (73.1%) | 1393 (73.4%) | 1213 (71.2%) | 986 (70.1%) | 1670 (66.8%) | 758 (67.3%) | 516 (65.8%) |
| Retreatment | 3491 (30.3%) | 554 (26.9%) | 559 (28.6%) | 491 (28.8%) | 420 (29.8%) | 831 (33.2%) | 368 (32.7%) | 268 (34.2%) |
| SITE | ||||||||
| PTB | 8693 (75.4%) | 1464 (71.0%) | 1406 (72.0%) | 1250 (73.4%) | 1072 (76.2%) | 1932 (77.3%) | 916 (81.4%) | 653 (83.3%) |
| EPTB | 2083 (18.1%) | 361 (17.5%) | 381 (19.5%) | 330 (19.4%) | 259 (18.4%) | 468 (18.7%) | 173 (15.4%) | 111 (14.2%) |
| PTB + EPTB | 758 (6.6%) | 236 (11.5%) | 165 (8.5%) | 124 (7.3%) | 75 (5.3%) | 101 (4.0%) | 37 (3.3%) | 20 (2.6%) |
| SITE OF EPTB‡ | ||||||||
| Pleural | 1212 (42.7%) | 171 (29.6%) | 230 (42.1%) | 213 (46.9%) | 153 (45.8%) | 285 (50.1%) | 101 (48.1%) | 59 (45.0%) |
| Miliary | 444 (15.6%) | 152 (25.5%) | 103 (18.9%) | 76 (16.7%) | 36 (10.8%) | 54 (9.5%) | 17 (8.1%) | 6 (4.6%) |
| Lymph nodes | 331 (11.7%) | 72 (12.1%) | 60 (11.0%) | 51 (11.2%) | 48 (14.4%) | 68 (12.0%) | 17 (8.1%) | 15 (11.5%) |
| Meningitis | 277 (9.8%) | 52 (8.7%) | 42 (7.7%) | 33 (7.3%) | 28 (8.4%) | 65 (11.4%) | 36 (17.1%) | 21 (16.0%) |
| Bones / joints | 85 (3.0%) | 23 (3.9%) | 9 (1.7%) | 11 (2.4%) | 18 (5.4%) | 12 (2.1%) | 8 (3.8%) | 4 (3.1%) |
| Genito-urinary | 20 (0.7%) | 8 (1.3%) | 5 (0.9%) | 3 (0.7%) | 1 (0.3%) | 2 (0.4%) | 0 (0.0%) | 1 (0.8%) |
| Not specified | 517 (18.2%) | 133 (22.3%) | 104 (19.1%) | 73 (16.1%) | 55 (16.5%) | 94 (16.5%) | 33 (15.7%) | 25 (19.1%) |
| LABORATORY CONFIRMATION | ||||||||
| Smear + | 3798 (32.9%) | 684 (33.2%) | 578 (29.6%) | 496 (29.1%) | 431 (30.7%) | 838 (33.5%) | 460 (40.9%) | 311 (39.7%) |
| Smear − Culture + | 2394 (20.8%) | 345 (16.7%) | 387 (19.8%) | 386 (22.7%) | 353 (25.1%) | 525 (21.0%) | 228 (20.3%) | 170 (21.7%) |
| No Confirmation | 5342 (46.3%) | 1032 (50.1%) | 987 (50.6%) | 822 (48.2%) | 622 (44.2%) | 1138 (45.5%) | 438 (38.9%) | 303 (38.6%) |
Data presented as number (%) or median (IQR). Column percentages are shown.
Percentages shown for sites of EPTB reflect proportions of those with extra-pulmonary disease with or without concomitant PTB.
PTB = pulmonary TB; EPTB = extra-pulmonary TB; ART = antiretroviral therapy.
PTB and EPTB
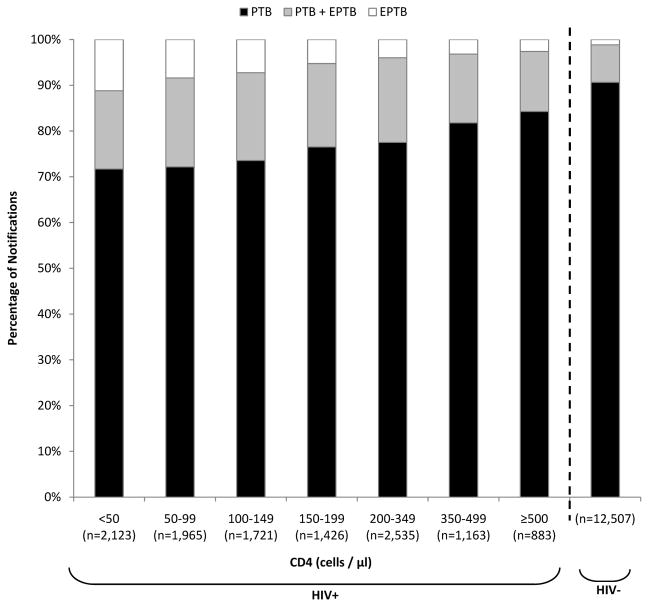
EPTB was more frequent in cases with lower CD4 counts and was three-fold more common in those with CD4 cell counts <50 cells/μL compared to those who were HIV-uninfected (28.3% versus 9.4%; p<0.001) (Figure 2). Even in HIV-infected cases in the highest CD4 count stratum (≥500 cells/μL), extrapulmonary involvement was also more frequent (15.7% versus 9.4%; p<0.001).
Figure 2.
Bar chart showing the proportions of pulmonary tuberculosis (PTB) and extrapulmonary tuberculosis (EPTB) stratified by HIV status and CD4 cell count.
Investigations
Of adults with PTB, sputum smear microscopy and culture were done in 94.5% and 43.3% of cases, respectively, whereas the corresponding proportions in children were 13.2% and 3.8%. Culture was done more frequently in cases of retreatment disease compared to new disease (66.5% versus 24.5%; p<0.001) and smear-negative cases (58.8% versus 35.1%; p<0.001), reflecting national policy. Of cases for which smear microscopy was done, ≥ 2 samples were tested in 96.1% whereas culture was requested on a single sample in most (97.5%). Chest radiographs were done in 28.4% of cases (30.3% of HIV-infected cases versus 27% in HIV-uninfected cases) and lymph node aspirations or biopsies were performed in just 1.6% of all cases. Tuberculin skin tests were performed in 26.7% of cases in children <5 years (14.1% of HIV-infected versus 31.9% of HIV-uninfected children).
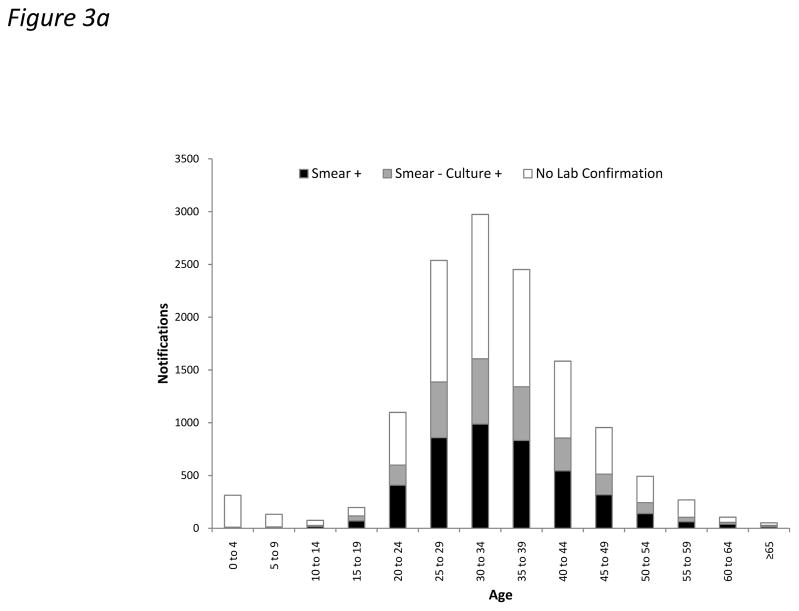
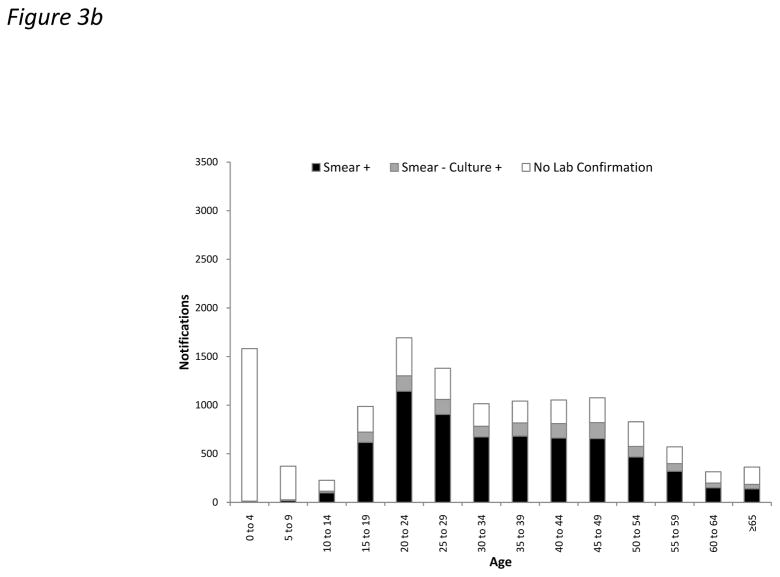
Laboratory confirmation by positive smear or culture was obtained in 56.0% of all notifications. However, this proportion was substantially lower for HIV-infected cases compared to uninfected cases in adults (53.9% versus 74.3%; p<0.001) (Figure 3). This difference was largely attributable to laboratory confirmation of PTB cases (62.9% versus 80.4%, respectively; p<0.001) rather than extrapulmonary disease (12.9% versus 10.3%, respectively; p=0.052). EPTB was laboratory confirmed in 11.8% of cases overall. TB diagnoses were laboratory confirmed in only 2.0% of cases in children <10 years (Figure 3). The high proportion of cases lacking laboratory confirmation among those with unknown HIV status was largely attributable to disease in children (Table 1).
Figure 3.
Bar charts showing absolute numbers of all tuberculosis (TB) notifications stratified by age and laboratory confirmation (by smear or culture) in (a) HIV-infected and (b) HIV-uninfected cases.
Sputum smear microscopy
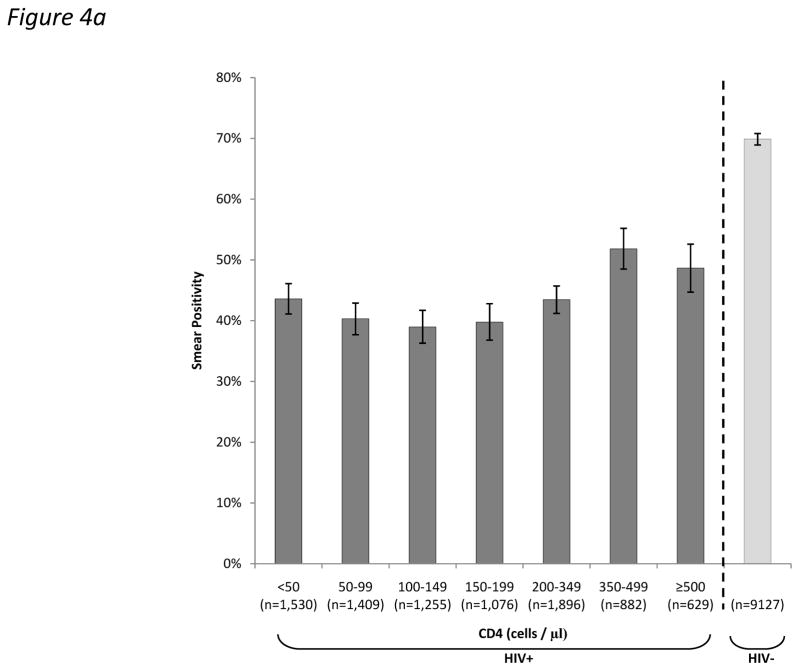
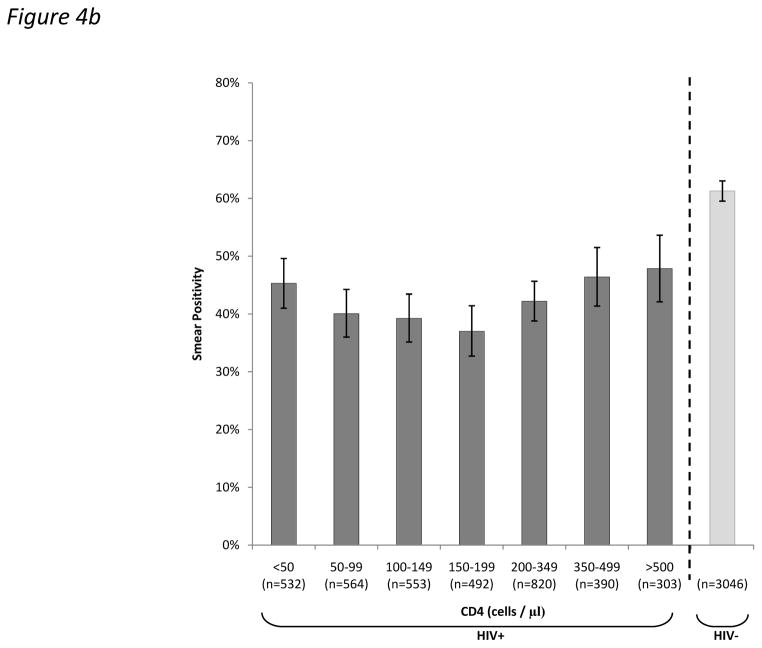
In adult cases of PTB, the proportion testing sputum smear-positive was substantially lower in HIV-infected than HIV-uninfected cases (43.9% vs. 69.9%; p<0.001). This proportion varied by CD4 cell count (Figure 4a), but it was striking that even in the highest CD4 count stratum (≥500 cells/μL), the proportion was much lower than in HIV-uninfected cases (48.6% versus 69.9%; p<0.001). The relationship between the proportion testing sputum smear positive and CD4 cell count was not linear. As CD4 cell counts declined from 500 cells/μL to <50 cells/μL, the smear-positive proportion initially decreased but then increased in the very lowest CD4 count strata (Figure 4a; p<0.001 for trend). This analysis was repeated restricted to patients with culture-confirmed TB and the same pattern was observed (Figure 4b).
Figure 4.
Bar charts showing the proportions (95%CI) of (a) total adult pulmonary tuberculosis (TB) cases and (b) culture-positive adult pulmonary tuberculosis (TB) cases who tested sputum smear-positive stratified by HIV-status and by CD4 count.
Of sputum samples from adults with smear-positive PTB cases and HIV-coinfection, a smaller proportion were graded as ‘3+’ (48.8% versus 61.1%; p<0.001) and a larger proportion were graded as ‘1+’ (27.9% versus 19.1%; p<0.001) compared to samples from HIV-uninfected patients. Furthermore, among HIV-infected cases, lower CD4 counts were associated with lower smear grades (p<0.001 for trend) (Figure 5).
Figure 5.
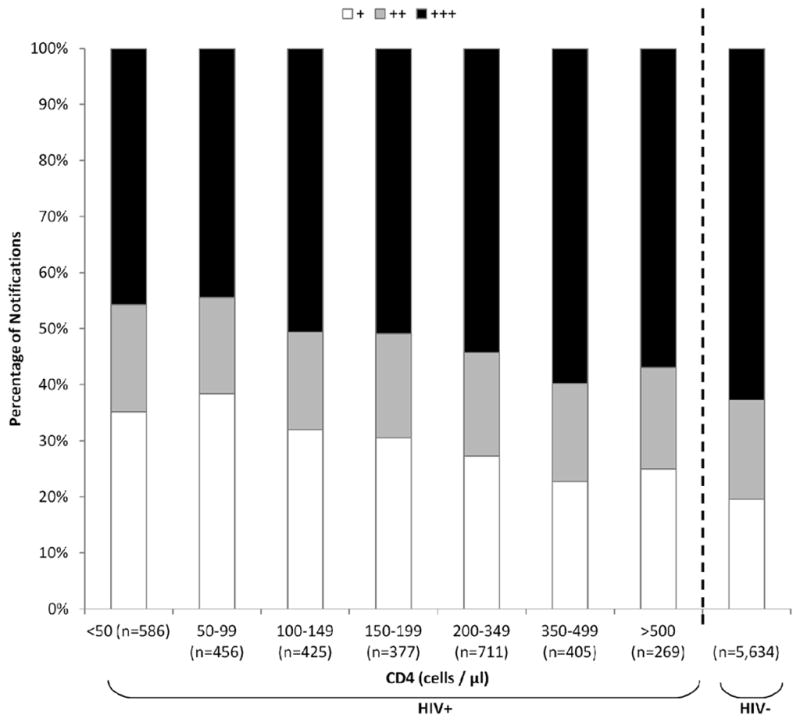
Bacillary grading (+, ++ or +++) of smear-positive pulmonary tuberculosis (TB) notifications in adults, stratified by HIV-status and by CD4 count and shown as relative proportions.
Time from investigation to treatment
Median times from microbiology sample collection to TB treatment initiation was 7 days (IQR 3–11) in smear-positive cases and 24 days (IQR 3–42) in those with smear-negative, culture-positive disease. The time from first contact with health care services to diagnosis of smear-negative cases, however, was not known.
DISCUSSION
In this study, we report on the diagnosis of 29,478 cases of TB notified in just one year from a single city in South Africa - a country that is among the worst affected by the global TB and HIV epidemics. High rates of HIV testing and CD4 cell count measurement allowed us to examine how TB diagnosis varies according to these parameters at a population level. Key findings were that the CD4 count distribution among HIV-infected patients was markedly skewed, with a majority of cases having CD4 cell counts <200 cells/μL. HIV coinfection and lower CD4 cell counts were associated with lower rates of laboratory confirmed disease, a higher proportion of EPTB and lower sputum smear grades even among those with the highest CD4 cell counts. However, decreasing CD4 cell counts were not associated with a linear decline in the proportion of pulmonary cases testing sputum smear-positive.
Although HIV coinfection is well recognized to be associated with higher proportions of smear-negative PTB and EPTB compared to HIV-uninfected cases,7–10 this study demonstrated that these patterns are seen across all CD4 strata, even in those with CD4 counts ≥ 500 cells/μL. This may reflect the profound impact that HIV sero-conversion has on host anti-mycobacterial immune responses.11–13 In smear-positive PTB cases in HIV-infected patients, bacillary grading decreased in a linear fashion with declining CD4 count, supporting the findings of previous studies.14,15 A potential underlying mechanism is that waning immunity is associated with reduced pulmonary immunopathology11,16 with consequent liberation of lower concentrations of bacilli into the airways.
When smears were classified simply as positive or negative, it might have been anticipated that the proportion testing smear-positive would also decrease in a simple linear fashion with declining CD4 cell count. However, this was not observed. Instead, the overall decrease in the smear-positive proportion with declining CD4 count was small and non-linear and increased in the very lowest CD4 count strata. This pattern was clearly evident regardless of whether all PTB cases were considered or whether analysis was restricted to culture-positive cases only (Fig. 4a and b). This has not previously been observed and this may be because we studied a large number of unselected cases and since we were able to use a fine resolution of CD4 strata. We suggest that overwhelming total bacillary burden within pulmonary tissues and possibly the high frequency of miliary disease (Table 2) might contribute to smear positivity in patients with CD4 cell counts <100 cells/μL. This would be entirely consistent with data from post-mortem studies17–19 and recent evaluations of new TB diagnostic assays conducted in Cape Town in which bacillary load and the sensitivity of the Xpert MTB/RIF test on sputum was observed to substantially increase in patients within the very lowest CD4 count strata.20–22 Further data are required to confirm this observation and underlying mechanisms.
Patients with HIV-associated TB typically had very low CD4 cell counts. This highly skewed CD4 count distribution reflects the huge increases in TB risk at lower CD4 cell counts in this setting23 and the fact that TB is one of the most common reasons for initial presentation to health care services for patients with advanced immunodeficiency in Cape Town. This distribution may also reflect the potent TB preventive effect of ART mediated by increases in CD4 cell counts.24,25 Moreover, these data suggest that much of this disease might be prevented by wide coverage of ART started at much higher baseline CD4 cell counts.26
Cape Town is a city with more resources than the vast majority of settings in sub-Saharan Africa. However, despite the availability of culture, it was only performed in 58.8% of smear-negative TB cases. The large proportion of microbiologically unconfirmed TB cases may include some with other pathologies that were misdiagnosed and inappropriately treated. As culture results often take several weeks, a major disincentive to performing culture in smear-negative cases may be that results are too slow to influence clinical decisions, particularly in the most unwell patients. A median of 7 days elapsed between obtaining sputum samples and starting TB treatment in those with smear-positive disease. This highlights a need for sensitive diagnostics that yield produce rapid results preferably at the point-of-care to maximise impact on clinical decision-making.27
Rapid progress has been made recently in developing new TB diagnostics.28 The most promising is the Xpert MTB/RIF assay29 and national implementation of this assay in South Africa started in 2011. In addition to diagnosing almost all smear-positive cases, it allows prompt diagnosis of a substantial proportion of smear-negative cases, reducing treatment delays.30 Furthermore, a negative Xpert MTB/RIF result may encourage clinicians to consider alternative diagnoses earlier in the clinical course, reducing risk of misdiagnosis. However, early reports of national implementation suggest that the anticipated increase in TB case finding may not be as great as hoped as introduction of the assay may simply increase the proportion of cases with laboratory confirmation but which may have been treated empirically anyway.31 Studies of the clinical and programmatic impact of Xpert MTB/RIF assay roll-out in South Africa are awaited. Another promising new diagnostic is a point-of-care urine antigen test for lipoarabinomannan (LAM)21,32 for which utility is restricted to patients with known HIV infection, low CD4 cell counts (<200 cells/μL) and the worst prognosis.32–344 The present study highlights that a substantial proportion of the HIV-associated TB cases have CD4 cell counts <200 cells/μL in whom this assay is useful..
TB in children <10 years accounted for 12% of all cases, of which only 5.6% had microbiological samples collected, and only 2.0% had laboratory confirmation. Low rates of HIV-testing in children meant that we were unable to assess the impact of HIV on TB diagnosis in this age group. However, these data illustrate the extraordinary challenge of paediatric TB diagnosis, which not only requires new high sensitivity diagnostic assays but there is also a critical need for new means of obtaining appropriate clinical samples.35
Strengths of this study include the analysis of a very large number of unselected TB notifications on a city-wide basis. The high rate of HIV testing and CD4 count assessment allowed careful assessment of the impact of these parameters on TB diagnosis among very large numbers of unselected cases. A weakness of this study is that the diagnosis of TB was not confirmed by culture for all cases, the burden of undiagnosed TB is not known, a proportion of cases may be misdiagnoses and reliable data on the ART status of HIV-infected patients was not available. Furthermore, routine notification data were used, making it subject to the quality of data collection and input. Finally, ascertainment of EPTB is likely to have been incomplete due to the much greater difficulty of diagnosis compared to PTB.
In conclusion, this study highlights the challenges of TB diagnosis in southern Africa even in a city that has very good laboratory infrastructure. Much treated disease lacks laboratory confirmation, especially among those with HIV coinfection and even at high CD4 cell counts. These data provide an important baseline assessment prior to the national scale-up of the Xpert MTB/RIF assay in South Africa. Subsequent studies must document the impact of scale-up but ongoing efforts must be made to develop a simple, low-cost, accurate assay that can be used at the point-of-care and be readily implemented and scaled-up.
Acknowledgments
We would like to acknowledge the Health Department, City of Cape Town, for kindly granting us access to TB notification data, as we continue to collaborate in an attempt to improve our understanding of the TB epidemic. SDL is funded by the Wellcome Trust. RW was funded in part by the International Epidemiologic Database to Evaluate Aids with a grant from the National Institute of Allergy and Infectious Diseases (NIAID: 5U01AI069924-02); Cost-Effectiveness of Preventing AIDS Complications (CEPAC) funded by the National Institutes of Health (NIH, 5 R01AI058736-02); USAID Right to Care (CA 674 A 00 08 0000 700) and the South African Centre for Epidemiological Modelling and Analysis (SACEMA).
Footnotes
CONFLICTS OF INTEREST
None to declare
References
- 1.World Health Organization. Global Tuberculosis Control Report 2012. World Health Organization; Geneva: 2012. Accessed at the following URL: http://apps.who.int/iris/bitstream/10665/75938/1/9789241564502_eng.pdf. [Google Scholar]
- 2.Reid MJ, Shah NS. Approaches to tuberculosis screening and diagnosis in people with HIV in resource-limited settings. Lancet Infect Dis. 2009;9:173–84. doi: 10.1016/S1473-3099(09)70043-X. [DOI] [PubMed] [Google Scholar]
- 3.Lawn SD, Wood R. Tuberculosis in antiretroviral treatment services in resource-limited settings: addressing the challenges of screening and diagnosis. J Infect Dis. 2011;204 (Suppl 4):S1159–S1167. doi: 10.1093/infdis/jir411. [DOI] [PMC free article] [PubMed] [Google Scholar]
- 4.Getahun H, Harrington M, O’Brien R, Nunn P. Diagnosis of smear-negative pulmonary tuberculosis in people with HIV infection or AIDS in resource-constrained settings: informing urgent policy changes. Lancet. 2007;369:2042–9. doi: 10.1016/S0140-6736(07)60284-0. [DOI] [PubMed] [Google Scholar]
- 5.Wood R, Lawn SD, Caldwell J, et al. Burden of New and Recurrent Tuberculosis in a Major South African City Stratified by Age and HIV-Status. PLoS One. 2011;6:e25098. doi: 10.1371/journal.pone.0025098. [DOI] [PMC free article] [PubMed] [Google Scholar]
- 6.The South African National Tuberculosis Control Programme. Practical Guidelines. Department of Health; South Africa: 2004. [Accessed on 15th April 2010]. at the following URL: http://www.kznhealth.gov.za/chrp/documents/Guidelines/Guidelines%20National/Tuberculosis/SA%20TB%20Guidelines%202004.pdf. [Google Scholar]
- 7.Klein NC, Duncanson FP, Lenox TH, et al. Use of mycobacterial smears in the diagnosis of pulmonary tuberculosis in AIDS/ARC patients. Chest. 1989;95:1190–2. doi: 10.1378/chest.95.6.1190. [DOI] [PubMed] [Google Scholar]
- 8.Elliott AM, Halwiindi B, Hayes RJ, et al. The impact of human immunodeficiency virus on presentation and diagnosis of tuberculosis in a cohort study in Zambia. J Trop Med Hyg. 1993;96:1–11. [PubMed] [Google Scholar]
- 9.Elliott AM, Namaambo K, Allen BW, et al. Negative sputum smear results in HIV-positive patients with pulmonary tuberculosis in Lusaka, Zambia. Tuber Lung Dis. 1993;74:191–4. doi: 10.1016/0962-8479(93)90010-U. [DOI] [PubMed] [Google Scholar]
- 10.Harries AD, Nyangulu DS, Kangombe C, et al. The scourge of HIV-related tuberculosis: a cohort study in a district general hospital in Malawi. Ann Trop Med Parasitol. 1997;91:771–6. doi: 10.1080/00034989760527. [DOI] [PubMed] [Google Scholar]
- 11.Lawn SD, Butera ST, Shinnick TM. Tuberculosis unleashed: the impact of human immunodeficiency virus infection on the host granulomatous response to Mycobacterium tuberculosis. Microbes Infect. 2002;4:635–46. doi: 10.1016/s1286-4579(02)01582-4. [DOI] [PubMed] [Google Scholar]
- 12.Diedrich CR, Mattila JT, Klein E, et al. Reactivation of latent tuberculosis in cynomolgus macaques infected with SIV is associated with early peripheral T cell depletion and not virus load. PLoS ONE. 2010;5:e9611. doi: 10.1371/journal.pone.0009611. [DOI] [PMC free article] [PubMed] [Google Scholar]
- 13.Geldmacher C, Ngwenyama N, Schuetz A, et al. Preferential infection and depletion of Mycobacterium tuberculosis-specific CD4 T cells after HIV-1 infection. J Exp Med. 2010;207:2869–81. doi: 10.1084/jem.20100090. [DOI] [PMC free article] [PubMed] [Google Scholar]
- 14.Mugusi F, Villamor E, Urassa W, et al. HIV co-infection, CD4 cell counts and clinical correlates of bacillary density in pulmonary tuberculosis. Int J Tuberc Lung Dis. 2006;10:663–9. [PubMed] [Google Scholar]
- 15.Chamie G, Luetkemeyer A, Walusimbi-Nanteza M, et al. Significant variation in presentation of pulmonary tuberculosis across a high resolution of CD4 strata. Int J Tuberc Lung Dis. 2010;14:1295–302. [PMC free article] [PubMed] [Google Scholar]
- 16.Post FA, Wood R, Pillay GP. Pulmonary tuberculosis in HIV infection: radiographic appearance is related to CD4+ T-lymphocyte count. Tuber Lung Dis. 1995;76:518–21. doi: 10.1016/0962-8479(95)90527-8. [DOI] [PubMed] [Google Scholar]
- 17.Lucas SB, Hounnou A, Peacock C, et al. The mortality and pathology of HIV infection in a West African city. AIDS. 1993;7:1569–79. doi: 10.1097/00002030-199312000-00005. [DOI] [PubMed] [Google Scholar]
- 18.Rana F, Hawken MP, Meme HK, et al. Autopsy findings in HIV-1-infected adults in Kenya. J Acquir Immune Defic Syndr Hum Retrovirol. 1997;14:83–5. doi: 10.1097/00042560-199701010-00017. [DOI] [PubMed] [Google Scholar]
- 19.Cohen T, Murray M, Wallengren K, et al. The prevalence and drug sensitivity of tuberculosis among patients dying in hospital in KwaZulu-Natal, South Africa: a postmortem study. PLoS Med. 2010;7:e1000296. doi: 10.1371/journal.pmed.1000296. [DOI] [PMC free article] [PubMed] [Google Scholar]
- 20.Lawn SD, Kerkhoff AD, Vogt M, et al. Characteristics and Early Outcomes of Patients With Xpert MTB/RIF-Negative Pulmonary Tuberculosis Diagnosed During Screening Before Antiretroviral Therapy. Clin Infect Dis. 2012;54:1071–1079. doi: 10.1093/cid/cir1039. [DOI] [PMC free article] [PubMed] [Google Scholar]
- 21.Lawn SD, Kerkhoff AD, Vogt M, Wood R. Diagnostic accuracy of a low-cost, urine antigen, point-of-care screening assay for HIV-associated pulmonary tuberculosis before antiretroviral therapy: a descriptive study. Lancet Infect Dis. 2012;12:201–9. doi: 10.1016/S1473-3099(11)70251-1. [DOI] [PMC free article] [PubMed] [Google Scholar]
- 22.Lawn SD, Kerkhoff AD, Vogt M, Wood R. High diagnostic yield of tuberculosis from screening urine samples from HIV-infected patients with advanced immunodeficiency using the Xpert MTB/RIF assay. J Acquir Immune Defic Syndr. 2012;60:289–94. doi: 10.1097/QAI.0b013e318258c6af. [DOI] [PMC free article] [PubMed] [Google Scholar]
- 23.Holmes CB, Wood R, Badri M, et al. CD4 decline and incidence of opportunistic infections in Cape Town, South Africa: implications for prophylaxis and treatment. J Acquir Immune Defic Syndr. 2006;42:464–9. doi: 10.1097/01.qai.0000225729.79610.b7. [DOI] [PubMed] [Google Scholar]
- 24.Suthar AB, Lawn SD, Del Amo J, et al. Antiretroviral Therapy for Prevention of Tuberculosis in Adults with HIV: A Systematic Review and Meta-Analysis. PLoS Med. 2012;9:e1001270. doi: 10.1371/journal.pmed.1001270. [DOI] [PMC free article] [PubMed] [Google Scholar]
- 25.Lawn SD, Myer L, Edwards D, Bekker LG, Wood R. Short-term and long-term risk of tuberculosis associated with CD4 cell recovery during antiretroviral therapy in South Africa. AIDS. 2009;23:1717–25. doi: 10.1097/QAD.0b013e32832d3b6d. [DOI] [PMC free article] [PubMed] [Google Scholar]
- 26.Lawn SD, Harries AD, Williams BG, et al. Antiretroviral therapy and the control of HIV-associated tuberculosis. Will ART do it? Int J Tuberc Lung Dis. 2011;15:571–81. doi: 10.5588/ijtld.10.0483. [DOI] [PMC free article] [PubMed] [Google Scholar]
- 27.Perkins MD, Cunningham J. Facing the crisis: improving the diagnosis of tuberculosis in the HIV era. J Infect Dis. 2007;196 (Suppl 1):S15–S27. doi: 10.1086/518656. [DOI] [PubMed] [Google Scholar]
- 28.UNITAID Secretariat. Tuberculosis diagnostic technology landscape 2012. World Health Organization; Geneva: 2012. Accessible at: http://www.unitaid.eu/images/marketdynamics/publications/UNITAID-Tuberculosis-Landscape_2012.pdf. [Google Scholar]
- 29.Lawn SD, Nicol MP. Xpert(R) MTB/RIF assay: development, evaluation and implementation of a new rapid molecular diagnostic for tuberculosis and rifampicin resistance. Future Microbiol. 2011;6:1067–82. doi: 10.2217/fmb.11.84. [DOI] [PMC free article] [PubMed] [Google Scholar]
- 30.Boehme CC, Nicol MP, Nabeta P, et al. Feasibility, diagnostic accuracy, and effectiveness of decentralised use of the Xpert MTB/RIF test for diagnosis of tuberculosis and multidrug resistance: a multicentre implementation study. Lancet. 2011;377:1495–505. doi: 10.1016/S0140-6736(11)60438-8. [DOI] [PMC free article] [PubMed] [Google Scholar]
- 31.Stevens W. Analysis of needed interface between molecular diagnostic tests and conventional mycobacteriology. Programme of the 43rd Union World Confrence on Lung Health; November 2012; Kuala Lumpur, Malaysia. Symposium 24. [Google Scholar]
- 32.Lawn SD. Point-of-care detection of lipoarabinomannan (LAM) in urine for diagnosis of HIV-associated tuberculosis: a state of the art review. BMC Infect Dis. 2012;12:103. doi: 10.1186/1471-2334-12-103. [DOI] [PMC free article] [PubMed] [Google Scholar]
- 33.Minion J, Leung E, Talbot E, et al. Diagnosing tuberculosis with urine lipoarabinomannan: systematic review and meta-analysis. Eur Respir J. 2011;38:1398–405. doi: 10.1183/09031936.00025711. [DOI] [PubMed] [Google Scholar]
- 34.Lawn SD, Kerkhoff AD, Vogt M, Wood R. Clinical significance of lipoarabinomannan detection in urine using a low-cost point-of-care diagnostic assay for HIV-associated tuberculosis. AIDS. 2012;26:1635–43. doi: 10.1097/QAD.0b013e3283553685. [DOI] [PubMed] [Google Scholar]
- 35.Whittaker E, Zar HJ. Promising directions in the diagnosis of childhood tuberculosis. Expert Rev Respir Med. 2012;6:385–95. doi: 10.1586/ers.12.36. [DOI] [PubMed] [Google Scholar]


