In this study, a new optical system was developed that simultaneously measured optical quality and visual performance during monitoring of tear film instability. The results confirmed that blurry vision symptoms reported by contact lens patients are caused by the poor quality of the retinal image due to tear break-up.
Abstract
Purpose.
To compare changes in optical quality and visual performance that accompany tear break-up (TBU) during blink suppression.
Methods.
A three-channel optical system was developed that simultaneously measured refractive aberrations (Shack-Hartmann aberrometer), 20/40 letter contrast sensitivity (CS), and TBU (retroillumination, RI). Ten wearers of silicone hydrogel contact lenses were asked to keep one eye open for approximately 18 seconds, while CS, wavefront aberrations, and RI images were collected. The wavefront was reconstructed by zonal methods, and image quality was quantified with a series of metrics including RMS fit error. Novel metrics for quantifying TBU over the contact lens surface were developed by quantifying the contrast of the RI image and by using Fourier descriptors of the first Purkinje (PJ) image shape.
Results.
There was a full range of TBU over the lens surface, with four subjects showing TBU across the corneal center and one subject with TBU in the inferior peripheral pupil. Among the four subjects with central corneal TBU, RMS fit error, RI contrast, and PJ Fourier descriptors showed high correlation with CS (r2 range, 0.9187–0.9414, 0.6261–0.975, and 0.4917–0.8986, respectively). Some of the general optical-quality metrics such as blur strength, neural sharpness, and area of modulation transfer function (MTF) also showed that change correlated with CS loss.
Conclusions.
Optical metrics of tear quality and retinal image quality are associated with the decline in vision that occurs with TBU. The evidence supports the hypothesis that blurry vision symptoms reported by contact lens wearers are caused by poor quality of the retinal image due to TBU.
Dry eye patients and contact lens wearers commonly report transiently blurry vision that clears temporarily with a blink.1–5 Recently, visual disturbance has been formally recognized as a symptom of dry eye and was added as a separate category in the definition.6 An unstable tear film or poor contact lens wetting is thought to be the cause of the blurry vision, which can be temporarily resolved by blinking.7–10
The changes in tear film thickness associated with tear break-up disrupt the eye's smooth refractive surface, which leads to reductions in optical quality.7,8,11,12 This reduction has been attributed to increased optical aberrations due to the uneven optical surface8,13–15 and increased scatter16 due to the exposure of the rough surface of corneal epithelium or contact lens after tear break-up.3,11,17 Studies have also shown that tear instability reduces both contrast sensitivity (CS) and visual acuity (VA),7,18 which can be improved by instillation of artificial tears.8,19–22
In none of these previous studies was optical quality and visual performance measured simultaneously during tear break-up, nor has there been an investigation of the connection between these two effects and their associations with tear break-up. It was our purpose in the present study to address this gap in our knowledge by developing and using a three-channel system that simultaneously monitors wavefront aberrometry, tear film instability through the technique of retroillumination (RI),13 and CS during blink suppression. We also sought to identify and develop metrics that could be used to quantify the optical effects of tear instability. Wearers of silicone hydrogel contact lenses were asked to participate in the study because blink suppression is more comfortable with a lens on the eye and we were seeking to correlate tear break-up and visual effects.
Methods
Subjects
This study was conducted according to a protocol approved by the Indiana University Human Subjects Committee and in accordance with the tenets of the Declaration of Helsinki. Informed consent was obtained from all participants. Subjects were selected on the basis of silicone hydrogel contact lens wear, no history of eye disease or ocular surgery, and no use of eye drops for dry eye or any other ocular condition.
Apparatus and Experimental Design
Tests were performed monocularly on a randomly selected eye in a dimly lit room where pupil diameter exceeded 5 mm. After the subjects were trained, baseline data were collected during a period of normal blinking, and then the impact of tear break-up was monitored during a period of approximately 18 seconds, during which the subjects were asked to suppress blinking. The untested eye was patched.
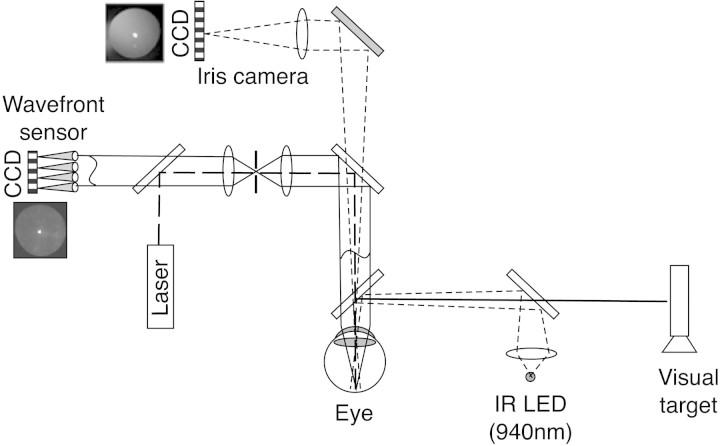
A three-channel optical system (Fig. 1) was developed to simultaneously measure monochromatic ocular aberrations, tear film quality, and visual performance. Aberrations were measured with a high-resolution Shack-Hartmann (S-H) wavefront aberrometer23 (COAS-HD [Complete Optical Analysis System-High Definition]; Wavefront Sciences, Inc., Albuquerque, NM). Tear film quality was observed with RI7,13 as well as by direct reflection of the light source from the tear film surface (first Purkinje [PJ] image). Visual performance was monitored with a forced-choice CS task with 20/40 letters.24
Figure 1.
The optical quality system. The wavefront sensor and iris camera are components of the aberrometer. The IR LED and visual target are external, custom modifications. Solid lines: the path of rays for images conjugate to the retina. Dotted lines: the path of rays for images conjugate to the iris. Dashed line: the path of the laser probe (drawing is not to scale).
Channel 1.
The S-H aberrometer (COAS-HD; Wavefront Sciences, Inc.) was used to monitor refractive monochromatic aberrations (λ = 835 nm) of the whole eye. This aberrometer samples the pupil plane every 0.160 mm and records aberrations approximately every 1.5 seconds.
Modal reconstruction of the wavefront error (WFE) function was performed by the conventional practice of least-squares fitting of slope data to the derivatives of Zernike polynomials. However, because tear film instability results in spatially local fluctuations in the wavefront, the spatial smoothing inherent in Zernike fitting may be less appropriate for representing tear break-up than other ocular aberrations. For that reason, in addition to the traditional modal reconstruction of the wavefront, we also used the zonal integration method of the aberrometer.25 This method integrates the slope of the wavefront measured by each lenslet without smoothing and is therefore more sensitive to local fluctuations. To isolate the local irregularities in the wavefront due to tear film break-up, we calculated the difference between modal and zonal wavefront reconstructions. The magnitude of this difference could be summarized by the RMS value of the difference map. However, it was more convenient to draw the comparison in the slope domain with a quantitative measure in the aberrometer software called RMS fit error. This is also known as the gradient fit error as defined in American National Standard Institute (ANSI) standard z80.28 (see Section 5.3 of the Standard for the mathematical formula). This quantity represents the variance between the measured slopes and the smooth polynomials fitted to the slope data. It is computed as the square root of the sum of squared differences in slope between the measured slope values and the slope values computed from the fitted derivatives of Zernike polynomials (modal method).
To evaluate the change in optical quality during tear break-up, we and others have developed 31 metrics of optical quality26,27 calculated from the wavefront aberration data for a 5-mm pupil diameter26,27 reconstructed by the zonal method.
Channel 2.
A Maxwellian-view illumination system produced dioptric and catoptric images that revealed the degradation of tear film quality between blinks. We have reported the use of RI for viewing the tear film,13 but using the degradation of the PJ represents a new method of assessing tear break-up. The dioptric RI image was formed by light reflected from the fundus, whereas the catoptric PJ image was formed by light reflected from the anterior tear film surface. Both of these images were captured simultaneously with an iris camera (COAS; Wavefront Sciences, Inc.), approximately every 1.5 seconds. The light source of the Maxwellian viewing system was an infrared light-emitting diode (LED), with the image at the pupil plane (5 mm diameter) fitting inside the pupil. The LED output spectrum peaked at 940 nm and produced 0.15 mW/cm2 at the cornea, which is approximately 0.5% of the maximum safe exposure level recommended by ANSI.28 Spatial contrast within the RI image is caused by the localized modulations of tear film thickness that accompany tear break-up.13 The contrast (C) within the RI image was computed from pixel intensity (I) as:
where SDI is the standard deviation of the intensity and Ī is the average of the pixel intensities.
The first PJ image of the infrared source was also apparent in the RI image. Because topographical disruptions in tear film create spatial distortion in the PJ image, we monitored and quantified the changes in the spatial structure of this catoptric image. Since the intensity of the PJ was much greater than the remaining RI image, a simple threshold technique was sufficient to convert the image to a binary image from which the perimeter was extracted. The Fourier descriptors technique was used to quantify the complexity of the shape of the PJ by performing a Fourier analysis on the evenly sampled perimeter.29 The resulting vector of Fourier coefficients (Fourier descriptors) is related to the complexity of the shape. For a simple circle, only one Fourier descriptor would be retrieved, whereas for an ellipse, two coefficients would be retrieved. The more complex the shape, the longer a vector of Zernike coefficients would be retrieved. Therefore, by calculating the sum of squares of the Fourier coefficients, we reduced the vector of coefficients to a scalar metric of the relative irregularity of PJ shape. The change in PJ shape was emphasized by subtracting the Fourier coefficient vectors observed immediately after a blink from the later vectors.
Because the PJ image lies in a plane close to the tear film (D = 4 mm, where D is the distance to the tear film), imaging of the precorneal tear film by an objective lens (119 mm from the corneal apex) with long focal length and small aperture (4 mm) captures the PJ and the RI images with approximately the same magnification. Consequently, the area of the PJ recorded by the camera is approximately equal to the area of the cornea reflecting light into the camera.
Channel 3.
Subjects viewed a computer screen (105 cd/m2; Macintosh; Apple, Inc., Cupertino, CA) displaying one 20/40 letter through the hot mirror and beam splitter. Letter contrast was adjustable by the subjects by using the up–and–down arrow keys. During a training session, letter contrast was varied and subjects learned to maintain it at a threshold level. During the main experiment, the subjects were instructed to adjust letter contrast until the letters were just recognizable and to maintain them as just visible throughout the 18-second trial.
Results
The average age of subjects in this investigation was 27.6 ± 7.9 years (range, 23–49). Three subjects were men and seven were women. All were habitual contact lens wearers and were fitted with a silicone hydrogel contact lens 30 minutes before the experiment.
For some analyses, the subjects were divided into two main groups, depending on whether their RI images showed tear break-up during trials. According to this criterion, five subjects showed tear break-up and five showed no obvious tear break-up during the ∼18-second blink-suppression period.
Effect of Tear Break-Up on Monochromatic Aberrations
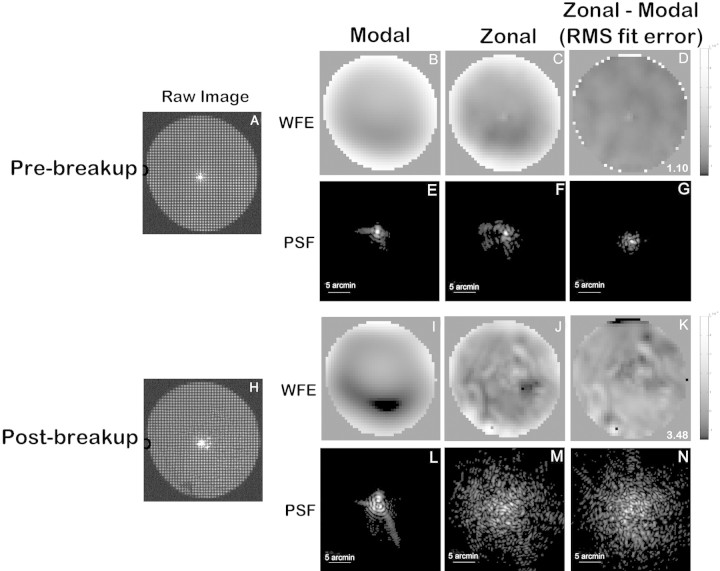
Comparison of wavefront data fit with the standard modal method and with the zonal method demonstrated that modal fitting clearly failed to capture many of the intricate, spatially local details of tear break-up–induced aberrations (Fig. 2). The zonal method showed more aberration in both pre (Fig. 2C)– and post (Fig. 2J)–break-up WFE maps than did the modal method (Figs. 2B, 2I), and these differences increased with tear instability (Figs. 2D, 2G, 2K, 2N). The zonal method also contained information about larger aberrations, such as defocus and astigmatism.
Figure 2.
Comparison of the modal and zonal wavefront reconstruction methods. (A–G) Images collected immediately after a blink; (H–N) images collected after 18 seconds of blink suppression. (A, H) The raw S-H images. (B, I) The modal reconstructed wavefront error maps; (C, G) the zonal reconstructed wavefront error maps; (D, K) the residual zonal wavefront after subtracting the map produced by modal fitting. The RMS of the residual wavefront is known as the RMS fit error, which is shown on the bottom right corner of (D) and (K). (E–G, L–N) The point spread function (PSF) generated from each corresponding wavefront.
The RMS fit error,30 which quantifies the variance between measured and fitted wavefront slopes, filters out larger aberrations and successfully captures the fine, spatially local details of tear break-up within the WFE map that are missed by least-squares fitting of Zernike polynomials. The RMS fit error was 1.10 milliradians (mrad) in pre-break-up data (Fig. 2D) and 3.48 mrad in post–break-up data (Fig. 2K). All the wavefront maps we present (other than Fig. 2) were obtained with the zonal fitting method.
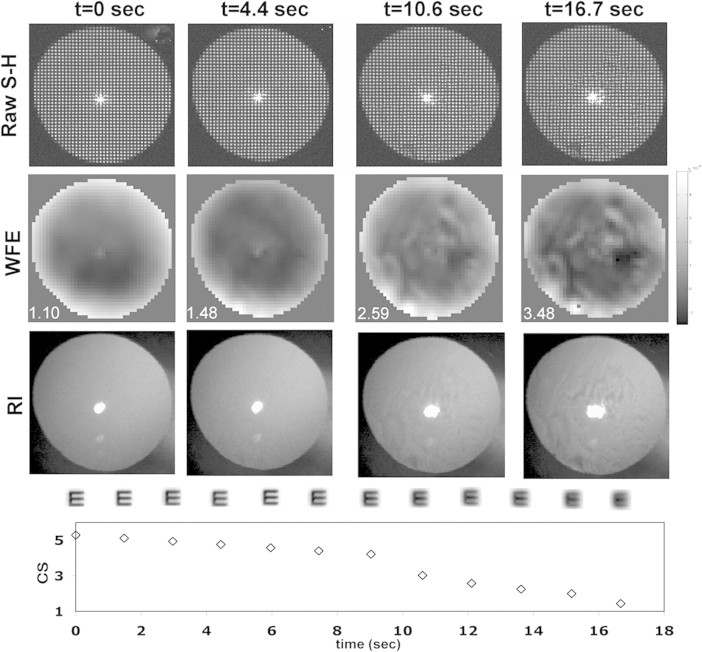
A sample data series collected at 0, 4.4, 10.6, and 16.7 seconds during an 18-second trial are shown in Figure 3. The top row shows raw S-H images, and the corresponding wavefronts are shown in the second row, with the RMS fit error30 on the lower left corner of each frame. RI images from the same times are shown in the third row. The development of complex features in the wavefronts (row 2) and RI images (row 3) indicates the growth of irregular, high-order aberrations, which are quantified by the increase in RMS fit error. The development of distortions in the bright PJ (row 3) within the RI image also emerged during this trial. In the fourth row we show simulated retinal images for a 20/40 letter E–based on the wavefront data shown in row 2. As WFE increases, image quality clearly decreases. In the bottom row, we show the CS data collected during the same trial. As tear break-up develops (row 3), WFE increases (row 2), retinal image quality decreases (row 4), and there is a gradual decline in CS (row 5).
Figure 3.
A time-series collected from one trial. Top row: four raw S-H images collected at 0, 4.4, 10.6, and 16.7 seconds during a blink-suppression trial. Rows 2 and 3: the corresponding zonal reconstructed WFE map and RI images, respectively. The RMS fit error of each wavefront (in microradians) is show on the bottom left corner of each image in the second row. The fourth row shows the simulated retinal image for a 20/40 letter E derived from the wavefront map shown in row 2. Bottom row: the simultaneously measured CS.
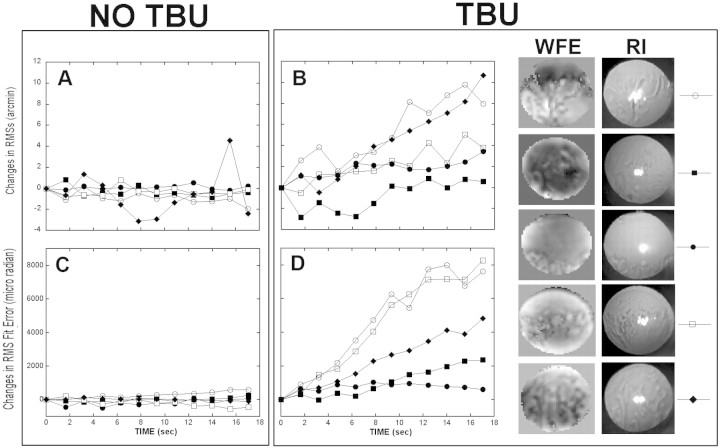
To summarize the changes in wavefront aberration with time, the subjects were classified into two groups (Fig. 4): no tear break-up (Figs. 4A, 4C) and tear break-up (Figs. 4B, 4D). Each symbol represents a different subject from each group. Wavefront changes over time were quantified by using two wavefront metrics—RMS of wavefront slope (RMSs31) and RMS fit error30—and both revealed a similar pattern. Subjects whose RI images showed no sign of tear break-up had stable WFE throughout the 18-second trial (not pictured), but the five subjects who did experience tear break-up showed a monotonic increase in these WFE metrics throughout the trial, some more dramatically than others. The right side of Figure 4 shows WFE maps and RI images obtained from the five subjects with tear break-up at the end of the ∼18-second period of blink suppression.
Figure 4.
(A, B) The changes in the RMSs optical quality metric with time; (C, D) the changes in the RMS fit error with time in subjects who experienced no tear break-up (A, C), and subjects with tear break-up (B, D). For each group, different symbols represent different subjects. (B, D, right) The WFE map and RI image observed immediately before blinking for the five subjects with tear break-up.
Effect of Tear Break-Up on the RI and PJ Images
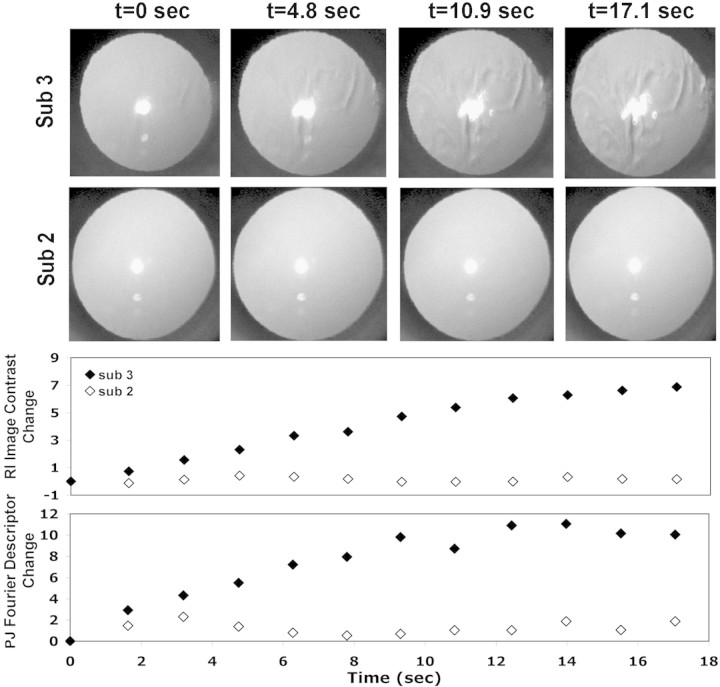
The second channel in our system simultaneously measured the refractive and catoptric effect of tear film disruption at approximately 1.5-second intervals and with very high spatial resolution (1212 samples per mm2) in the RI image. The impact on tear break-up can be seen in Figure 5 which shows sample raw data from two subjects, one who demonstrated significant tear break-up (subject 3) and the other who retained high-quality tears throughout the 18-second trial (subject 2). The sample RI images were captured at t = 0, 4.8, 10.8, and 17.1 seconds during a single trial. In the case in which tear break-up occurred, the refractive changes of tear film surface generated contrast modulations in the RI images, which, as shown previously by Himebaugh et al.,13 closely mirrored the spatial distribution of tear break-up observed with NaFl. These refractive changes were quantified by the change in the RI image contrast shown in the third row of Figure 5. As tear break-up progressed (subject 3), the PJ gradually transitioned from a highly regular image to a spatially distorted image with larger area. These changes in shape of the PJ are quantified by the change in Fourier descriptor values shown in the bottom row of Figure 5. In the absence of tear break-up, neither metric changed (open symbols), but both metrics showed a steady increase during the trial for the eye experiencing tear break-up (filled symbols). The PJ Fourier descriptor changed rapidly during the first 12 seconds of the trial and then remained stable. This probably reflects the spatial distribution of tear break-up, which in this example occurred centrally during the first half of the trial and spread to other areas of the cornea, which are not involved in generating the PJ, during the last seconds of the trial. Similar changes in the PJ were seen in the four eyes that experienced central tear break-up.
Figure 5.
Time-series for two subjects showing the RI and PJ changes during blink suppression. Four RI images collected at 0, 4.8 10.9, and 17.1 seconds after a blink are shown for subject 3 with tear break-up (top row) and subject 2 with no tear break-up (second row). Third and fourth rows: plots of the changes in RI image contrast and PJ Fourier descriptors during the same trials.
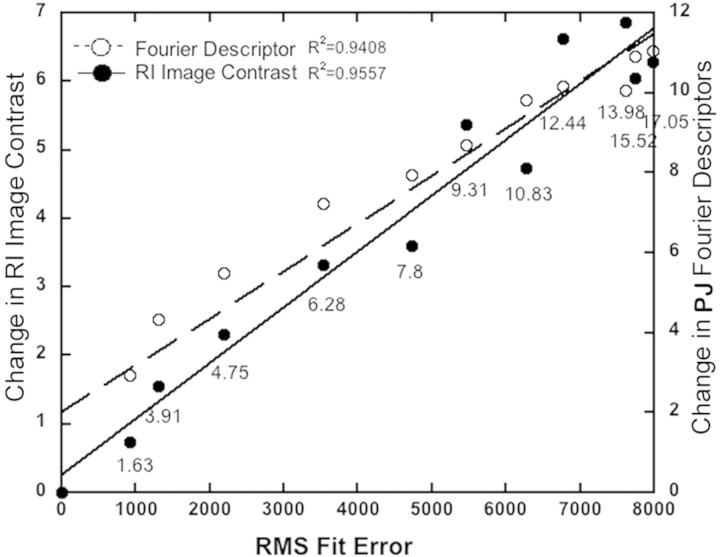
Changes in wavefront aberrations correlated highly (Fig. 6) with changes in the dioptric and catoptric images over time, observed in the RI channel with r2 of 0.94 and 0.96, suggesting that they are all measuring the same underlying phenomenon.
Figure 6.
Scatterplot showing the covariance of changes in RI contrast and PJ Fourier descriptors with changes in the wavefront RMS fit error metric. The numbers under each pair of symbols reflect the increasing time during which data were collected in the trial.
Impact of Tear Break-up on CS
According to Solomon and Pelli,32 resolution of letters at their contrast threshold is determined by the signal contained in the bandwidth centered around 2 cyc/letter, and thus for the 20/40 characters (10 arc min) used in our CS test, detection was determined by a signal at ∼12 cyc/deg. We compared, therefore, the change in letter CS to the change in retinal image contrast at 12 cyc/deg (i.e., the decrease in modulation transfer function [MTF] at 12 cyc/deg).
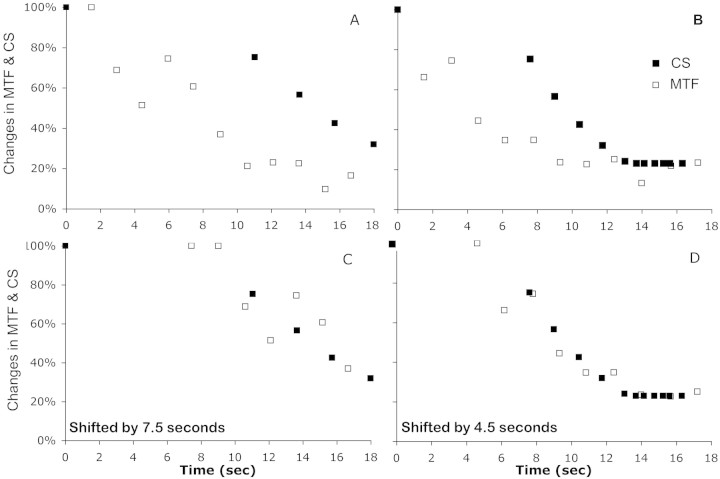
The psychophysical timelines of two trials in which tear break-up occurred are shown in Figures 7A and 7B. As the 18-second trial progressed, the 12 cyc/deg MTF began to decline, and soon thereafter, a similar but delayed decline in CS was observed. We added a delay to the MTF changes to achieve the best match to the observed CS changes (Figs. 7C, 7D), and the aberration-determined changes in MTF appeared to correlate highly with the psychophysically observed changes in CS (r2 = 0.8069 and 0.9321 for these two eyes).
Figure 7.
The percentage of change from the beginning of the trial in CS of a 20/40 letter and 12 cyc/deg retinal image contrast are plotted as a function of time throughout a single trial for two subjects who experienced tear break-up (A, B). (C, D) Data replotted with the MTF data, delayed by 7.5 and 4.5 seconds. The percentage changes in CS and MTF are computed as MTF(t)/MTF(t0) and CS(t)/CS(t0)
The correlation of the visual and optical changes occurring during tear break-up were also seen when we compared the CS data with metrics of image quality. We compared all 31 optical quality metrics and identified three metrics that showed the highest correlation with vision loss during tear break-up blur strength (Bave), neural sharpness (NS), and area of MTF.31 Correlation coefficients were, on average, 0.8830, 0.7438, and 0.7456, respectively, for the five subjects who experienced tear break-up, but only 0.0264, 0.0016, and 0.1892 for the five subjects with no tear break-up.
Sample data from one eye with tear break-up are shown in Figure 8 for Bave (Fig. 8A), NS (Fig. 8B), and area of MTF (Fig. 8C). In each case, the same pattern was seen. In the beginning of the trial (the first five samples, first 7.5 seconds), there was little change in CS, with a significant drop in image quality, and then both the CS and image quality started to change in a monotonic and correlated way, which is again consistent with the delayed reporting of the CS changes seen in Figures 7A and 7C for this subject
Figure 8.
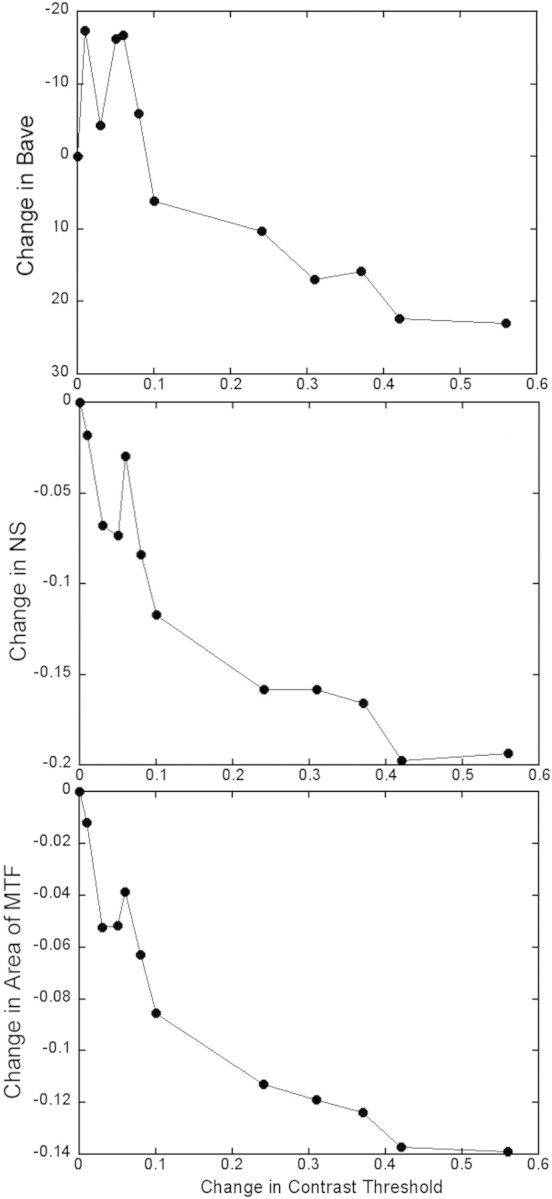
The decrease in optical quality is plotted as a function of the increase in contrast thresholds that accompanied tear break-up from a single trial. Three image-quality metrics are computed: Bave (A), NS (B) and area of MTF (C). The change in contrast threshold is computed as log(CTt/CTt0), and the changes in each optical quality metric is computed as the difference in each metric from t0.
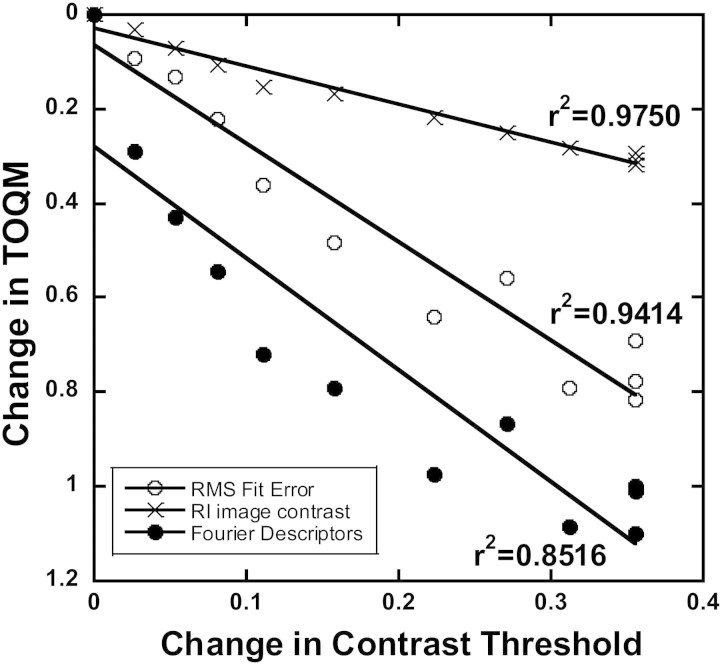
Figure 9 shows the covariance of the change in tear optical quality metrics (TOQM) that we developed for this study (RMS fit error, RI contrast, and PJ Fourier descriptor) with the change in psychophysical contrast threshold from a single trial in which tear break-up occurred. All three metrics showed very high correlations with contrast threshold (r2 = 0.9414, 0.9750, and 0.8516, respectively). The same correlations are summarized in Table 1 for all subjects. The subjects were categorized into three groups: no tear break-up, peripheral tear break-up, and central tear break-up. Correlations were universally very high in the four subjects who experienced central tear break-up, indicating that changes in image quality were always accompanied by changes in CS. Although correlations were often low when tear break-up was absent or only occurred peripherally, they were often significantly higher than 0 in subjects who had no tear break-up. This result indicates that our image quality metrics are sensitive enough to capture subtle optical changes that occur during a prolonged interblink interval that would not be classified as tear break-up.
Figure 9.
Change in three tear optical quality metrics, RMS fit error, RI image contrast, and Fourier descriptor are plotted as a function of the change in contrast threshold in one subject in a single trial. The change in contrast threshold is computed as log(CTt/CTt0). The changes in TOQMs are computed as (TOQMt − TOQMt0)/TOQMt0. Linear fits are shown with the R2 values beside each.
Table 1.
The Correlation of Changes in RMS Fit Error in the Three Subject Groups
| Group | RMS Fit Error | RI Contrast | Fourier Descriptors PJ |
|---|---|---|---|
| No tear break-up | 0.901 | 0.8078 | 0.8781 |
| 0.4357 | 0.0319 | 0.0669 | |
| 0.0503 | 0.3442 | 0.197 | |
| 0.5436 | 0.756 | 0.6582 | |
| 0.5869 | 0.5977 | 0.3774 | |
| Peripheral tear break-up | 0.0782 | 0.4617 | 0.012 |
| Central tear break-up | 0.9414 | 0.975 | 0.8516 |
| 0.9261 | 0.6261 | 0.8986 | |
| 0.9187 | 0.8373 | 0.4917 | |
| 0.9209 | 0.9603 | 0.6652 |
RI contrast and Fourier descriptor with change in contrast threshold from all 10 subjects.
Discussion
Although a number of studies have shown that tear break-up increases higher order aberrations,33–36 scatter,16 and reduced VA37 and CS,7,9 no investigators have simultaneously monitored tear break-up, optical properties, and vision in real time as tear break-up progressed. However, it is generally believed that a causal relationship exists (i.e., tear break-up generates an uneven optical surface that causes optical degradation, which in turn causes a loss of visual function). Because tear break-up is a dynamic process, testing this model required tracking the emergence of reduced vision as the tear film degraded during individual blink-suppression periods. Our results confirm that tear break-up over a soft contact lens introduces refractive aberrations and distorted reflections from the air–tear film interface (Figs. 3, 5). As these optical changes emerge, CS declines in concert with the decline in image quality (Figs. 8, 9, Table 1). These results are consistent with the hypothesis that symptoms of blurry vision reported by dry eye patients reflect degradation of optical quality caused by tear disruption.
We chose to study contact lens wearers in this initial investigation for two reasons. First, although tear film is more unstable over the contact lens surface than on the cornea,38,39 the subjects can keep their eyes open longer because the contact lens protects the cornea from sensation. Therefore, when wearing contact lenses, subjects experience less discomfort when refraining from blinking for short periods. Second, contact lenses are a common mode of vision correction, and so it is important to understand the visual effects of tear instability during contact lens wearing.
In this study, we asked the subjects to keep their eyes open for a relatively long period, 18 seconds, because our pilot data indicated that 18 seconds was sufficient to induce significant tear instability. Although the results showed that tear break-up, visual loss, and optical quality deterioration occurred well before the end of the 18 seconds, this long eye-open duration is not unrealistic, because long interblink intervals are known to occur during tasks requiring concentration, such as computer use.40–43 The method of holding the eye open, or blink suppression, has been used frequently in studies,7,14,15,44–46 and was easily achieved by subjects wearing the silicone hydrogel lenses with little discomfort.
Because the refractive index of the contact lens is related to its water content,47 loss of the tear film in the regions of tear break-up could dehydrate the local area of the lens, thus increasing the local refractive index. It is also reported that in the area of tear break-up, the local residual tear film experiences transient spikes in osmolarity. This fluctuation in osmolarity may also alter the refractive index of the tear film and then affect vision.48 Therefore, the decrease in refractive optical quality could include not only tear film structure changes, but also tear film osmolarity and contact lens refractive index fluctuations in the local area of tear break-up. All these factors reduce the refractive optical quality and affect vision.
As tear break-up progressed in the four subjects who experienced extensive break-up across the central pupil, all measures of optical quality declined with the decrease in visual performance. However, in the single subject who had tear break-up restricted to the pupil margins (Fig. 4), the Fourier descriptor PJ metric, which was based on reflections from the central 1.5 mm of the cornea, showed little or no change, even though CS declined. In this subject, however, the metrics that reflect optical quality of the whole eye, such as Bave, NS, and area of MTF correlated well with decline in CS.
Dynamic Tracking of Vision Loss between Blinks
Although the method of adjustment used to track CS was intended to provide a real-time measure of CS as optical quality degraded, our subjects found it difficult to perform the test accurately. In the best two cases, as image quality began to drop, the subjects took several seconds before they began to track the decline. Thus, the decrease in CS mirrored the decrease in image contrast, but with a 4.5- or 7.5-second delay. During this experiment, the subjects were trying to track changes in CS in real time. Before they adjusted the stimulus contrast, they first had to notice that the just-visible (threshold) letters had become unrecognizable, and then they had to take action to regain visibility. This decision process takes some time, and thus we anticipate that the CS decline should lag behind the MTF decline. This lag indicates a significant methodological delay in the CS data, suggesting that the real-time monitoring of contrast threshold changes during tear break-up may not be achievable with relatively naive observers.
There are two other methods that have been used recently to track vision loss during tear break-up that avoid the need for the subjects to track contrast threshold in real time. Ridder et al.21 examined the drop in CS associated with tear break-up by repeatedly presenting targets during successive interblink intervals at a fixed post-blink time. Their method avoided the need for tracking, but introduced variability since the spatial location and extent of tear break-up during one interblink interval may be very different from another.45 Another approach, employing a functional vision acuity (FVA) test (Nidek Co., Ltd, Gamagori, Japan),49–51 monitors VA with a forced-choice task and a series of individually presented letters. As VA declines, small letters can no longer be read, and the program increases the letter size (a standard adaptive method) and thus tracks changes in VA during interblink intervals. However, this method cannot track vision changes in real time. For example, an abrupt change in VA would appear as a gradual decline with this approach. Therefore, no accurate real-time monitoring of the vision changes that accompany tear break-up has yet been demonstrated. We anticipate that our method, when used by a highly practiced observer, will prove successful in this regard.
The high correlations observed between the optical and visual data indicate that real-time objective optical measures may be accurate measures of loss in visual function during tear break-up and thus may obviate the need for difficult and problematic psychophysical tracking. It is worth emphasizing that measuring VA or CS under static conditions is very difficult, and thus it should be no surprise that trying to measure vision loss during the highly dynamic tear break-up is challenging.
Optical Signature of Tear Film Degradation
We developed the Fourier descriptor metric of the first PJ (catoptric) image to quantify the optical quality of the anterior surface due to changes in tear film thickness, to exclude possible changes in refractive index of the tear film that requires transillumination, as with RI or by wavefront aberrometry. All three of these TOQMs revealed a high correlation between optical quality of the tear film and visual performance (CS), as shown in Figure 9. Considering the high correlation between the whole-eye optical-quality metrics and CS (Fig. 8), it is reasonable to attribute the reduction in the optical quality on the retina to the disruption of the tear film, which in turn causes the deterioration in vision.
The catoptric optical quality has been used clinically and in previous studies to measure the tear film stability. These techniques qualitatively described PJ irregularity by an extended target, such as a grid pattern52 or Placido Rings,49,53 that were imaged by the full cornea, and therefore may provide a more global indicator of reduced optical quality and vision loss.
Our optical methods have an advantage over traditional measures of contact lens wettability,54,55 in that the measurements are on-eye, noninvasive, noncontact, and functionally relevant to formation of the retinal image and the quality of vision. Our results suggest that objective optical methods can be used to monitor the quality of the tear film over a contact lens and thus the in vivo wettability of such lenses.
Footnotes
Disclosure: H. Liu, None; L. Thibos, None; C.G. Begley, None; A. Bradley, None
References
- 1. Nichols KK, Begley CG, Caffery B, Jones LA. Symptoms of ocular irritation in patients diagnosed with dry eye. Optom Vis Sci. 1999;76:838–844 [DOI] [PubMed] [Google Scholar]
- 2. Begley CG, Chalmers RL, Mitchell GL, et al. Characterization of ocular surface symptoms from optometric practices in North America. Cornea. 2001;20:610–618 [DOI] [PubMed] [Google Scholar]
- 3. Chen JJ, Rao K, Pflugfelder SC. Corneal epithelial opacity in dysfunctional tear syndrome. Am J Ophthalmol. 2009;148:376–382 [DOI] [PMC free article] [PubMed] [Google Scholar]
- 4. Johnson ME, Murphy PJ. Measurement of ocular surface irritation on a linear interval scale with the ocular comfort index. Invest Ophthalmol Vis Sci. 2007;48:4451–4458 [DOI] [PubMed] [Google Scholar]
- 5. Sade de Paiva C, Lindsey JL, Pflugfelder SC. Assessing the severity of keratitis sicca with videokeratoscopic indices. Ophthalmology. 2003;110:1102–1109 [DOI] [PubMed] [Google Scholar]
- 6. The definition and classification of dry eye disease: report of the Definition and Classification Subcommittee of the International Dry Eye WorkShop. Ocul Surf. 2007;5:75–92 [DOI] [PubMed] [Google Scholar]
- 7. Tutt R, Bradley A, Begley C, Thibos LN. Optical and visual impact of tear break-up in human eyes. Invest Ophthalmol Vis Sci. 2000;41:4117–4123 [PubMed] [Google Scholar]
- 8. Montes-Mico R. Role of the tear film in the optical quality of the human eye. J Cataract Refract Surg. 2007;33:1631–1635 [DOI] [PubMed] [Google Scholar]
- 9. Thai LC, Tomlinson A, Ridder WH. Contact lens drying and visual performance: the vision cycle with contact lenses. Optom Vis Sci. 2002;79:381–388 [DOI] [PubMed] [Google Scholar]
- 10. Goto E, Yagi Y, Matsumoto Y, Tsubota K. Impaired functional visual acuity of dry eye patients. Am J Ophthalmol. 2002;133:181–186 [DOI] [PubMed] [Google Scholar]
- 11. Albarran C, Pons AM, Lorente A, Montes R, Artigas JM. Influence of the tear film on optical quality of the eye. Cont Lens Anterior Eye. 1997;20:129–135 [DOI] [PubMed] [Google Scholar]
- 12. Hirohara Y, Mihashi T, Koh S, Ninomiya S, Maeda N, Fujikado T. Optical quality of the eye degraded by time-varying wavefront aberrations with tear film dynamics. Jpn J Ophthalmol. 2007;51:258–264 [DOI] [PubMed] [Google Scholar]
- 13. Himebaugh NL, Wright AR, Bradley A, Begley CG, Thibos LN. Use of retroillumination to visualize optical aberrations caused by tear film break-up. Optom Vis Sci. 2003;80:69–78 [DOI] [PubMed] [Google Scholar]
- 14. Rae SM, Price HC. The effect of soft contact lens wear and time from blink on wavefront aberration measurement variation. Clin Exp Optom. 2009;92:274–282 [DOI] [PubMed] [Google Scholar]
- 15. Koh S, Maeda N, Hori Y, et al. Effects of suppression of blinking on quality of vision in borderline cases of evaporative dry eye. Cornea. 2008;27:275–278 [DOI] [PubMed] [Google Scholar]
- 16. Thibos LN, Hong X. Clinical applications of the Shack-Hartmann aberrometer. Optom Vis Sci. 1999;76:817–825 [DOI] [PubMed] [Google Scholar]
- 17. Koh S, Maeda N, Hirohara Y, et al. Serial measurements of higher-order aberrations after blinking in patients with dry eye. Invest Ophthalmol Vis Sci. 2008;49:133–138 [DOI] [PubMed] [Google Scholar]
- 18. Goto T, Zheng X, Klyce SD, et al. Evaluation of the tear film stability after laser in situ keratomileusis using the tear film stability analysis system. Am J Ophthalmol. 2004;137:116–120 [DOI] [PubMed] [Google Scholar]
- 19. Rieger G. The importance of the precorneal tear film for the quality of optical imaging. Br J Ophthalmol. 1992;76:157–158 [DOI] [PMC free article] [PubMed] [Google Scholar]
- 20. Liu Z, Pflugfelder SC. Corneal surface regularity and the effect of artificial tears in aqueous tear deficiency. Ophthalmology. 1999;106:939–943 [DOI] [PubMed] [Google Scholar]
- 21. Ridder WH, 3rd, Tomlinson A, Paugh J. Effect of artificial tears on visual performance in subjects with dry eye. Optom Vis Sci. 2005;82:835–842 [DOI] [PubMed] [Google Scholar]
- 22. Ridder WH, 3rd, LaMotte J, Hall JQ, Jr, Sinn R, Nguyen AL, Abufarie L. Contrast sensitivity and tear layer aberrometry in dry eye patients. Optom Vis Sci. 2009;86:E1059–E1068 [DOI] [PubMed] [Google Scholar]
- 23. Cheng X, Himebaugh NL, Kollbaum PS, Thibos LN, Bradley A. Validation of a clinical Shack-Hartmann aberrometer. Optom Vis Sci. 2003;80:587–595 [DOI] [PubMed] [Google Scholar]
- 24. Bradley A, Abdul Rahman H, Soni PS, Zhang X. Effects of target distance and pupil size on letter contrast sensitivity with simultaneous vision bifocal contact lenses. Optom Vis Sci. 1993;70:476–481 [DOI] [PubMed] [Google Scholar]
- 25. Panagopoulou SI, Neal DR. Zonal matrix iterative method for wavefront reconstruction from gradient measurements. J Refract Surg. 2005;21:S563–569 [DOI] [PubMed] [Google Scholar]
- 26. Thibos LN, Applegate RA. Assessment of optical quality. In: MacRae S, Krueger R, Applegate R. eds. Customized Ablation and Super Vision. Thorofare, NJ: Slack, Inc.; 2001;67–78 [Google Scholar]
- 27. Liang J, Williams DR. Aberrations and retinal image quality of the normal human eye. J Opt Soc Am A Opt Image Sci Vis. 1997;14:2873–2883 [DOI] [PubMed] [Google Scholar]
- 28. Sliney D, Wolbarsht M. Safety with Lasers and Other Optical Sources: A Comprehensive Handbook. New York: Plenum Press; 1980. [Google Scholar]
- 29. Jahne B. Size and shape. Practical Handbook on Image Processing for Scientific Applications. Boca Raton, FL: CRC Press, LLC; 1997;496–499 [Google Scholar]
- 30. Neal DR, Baer CD, Topa DM. Errors in Zernike transformations and non-modal reconstruction methods. J Refract Surg. 2005;21:S558–S562 [DOI] [PubMed] [Google Scholar]
- 31. Thibos LN, Hong X, Bradley A, Applegate RA. Accuracy and precision of objective refraction from wavefront aberrations. J Vis. 2004;4:329–351 [DOI] [PubMed] [Google Scholar]
- 32. Solomon JA, Pelli DG. The visual filter mediating letter identification. Nature. 1994;369:395–397 [DOI] [PubMed] [Google Scholar]
- 33. Montes-Mico R, Alio JL, Munoz G, Perez-Santonja JJ, Charman WN. Postblink changes in total and corneal ocular aberrations. Ophthalmology. 2004;111:758–767 [DOI] [PubMed] [Google Scholar]
- 34. Montes-Mico R, Alio JL, Charman WN. Dynamic changes in the tear film in dry eyes. Invest Ophthalmol Vis Sci. 2005;46:1615–1619 [DOI] [PubMed] [Google Scholar]
- 35. Lin YY, Carrel H, Wang IJ, Lin PJ, Hu FR. Effect of tear film break-up on higher order aberrations of the anterior cornea in normal, dry, and post-LASIK eyes. J Refract Surg. 2005;21:S525–S529 [DOI] [PubMed] [Google Scholar]
- 36. Koh S, Maeda N. Wavefront sensing and the dynamics of tear film. Cornea. 2007;26:S41–45 [DOI] [PubMed] [Google Scholar]
- 37. Timberlake GT, Doane MG, Bertera JH. Short-term, low-contrast visual acuity reduction associated with in vivo contact lens drying. Optom Vis Sci. 1992;69:755–760 [DOI] [PubMed] [Google Scholar]
- 38. Faber E, Golding TR, Lowe R, Brennan NA. Effect of hydrogel lens wear on tear film stability. Optom Vis Sci. 1991;68:380–384 [DOI] [PubMed] [Google Scholar]
- 39. Guillon M, Guillon JP. Hydrogel lens wettability during overnight wear. Ophthalmic Physiol Opt. 1989;9:355–359 [PubMed] [Google Scholar]
- 40. Himebaugh NL, Begley CG, Bradley A, Wilkinson JA. Blinking and Tear Break-Up During Four Visual Tasks. Optom Vis Sci. 2009;86(2):E106–E114 [DOI] [PubMed] [Google Scholar]
- 41. Acosta MC, Gallar J, Belmonte C. The influence of eye solutions on blinking and ocular comfort at rest and during work at video display terminals. Exp Eye Res. 1999;68:663–669 [DOI] [PubMed] [Google Scholar]
- 42. Skotte JH, Nojgaard JK, Jorgensen LV, Christensen KB, Sjogaard G. Eye blink frequency during different computer tasks quantified by electrooculography. Eur J Appl Physiol. 2007;99:113–119 [DOI] [PubMed] [Google Scholar]
- 43. Doughty MJ. Consideration of three types of spontaneous eyeblink activity in normal humans: during reading and video display terminal use, in primary gaze, and while in conversation. Optom Vis Sci. 2001;78:712–725 [DOI] [PubMed] [Google Scholar]
- 44. Begley CG, Himebaugh N, Renner D, et al. Tear breakup dynamics: a technique for quantifying tear film instability. Optom Vis Sci. 2006;83:15–21 [DOI] [PubMed] [Google Scholar]
- 45. Liu H, Begley CG, Chalmers R, Wilson G, Srinivas SP, Wilkinson JA. Temporal progression and spatial repeatability of tear breakup. Optom Vis Sci. 2006;83:723–730 [DOI] [PubMed] [Google Scholar]
- 46. Goto T, Zheng X, Klyce SD, et al. A new method for tear film stability analysis using videokeratography. Am J Ophthalmol. 2003;135:607–612 [DOI] [PubMed] [Google Scholar]
- 47. Gonzalez-Meijome JM, Lira M, Lopez-Alemany A, Almeida JB, Parafita MA, Refojo MF. Refractive index and equilibrium water content of conventional and silicone hydrogel contact lenses. Ophthalmic Physiol Opt. 2006;26:57–64 [DOI] [PubMed] [Google Scholar]
- 48. Liu H, Begley C, Chen M, et al. A link between tear instability and hyperosmolarity in dry eye. Invest Ophthalmol Vis Sci. 2009;50:3671–3679 [DOI] [PubMed] [Google Scholar]
- 49. Goto E, Ishida R, Kaido M, et al. Optical aberrations and visual disturbances associated with dry eye. Ocul Surf. 2006;4:207–213 [DOI] [PubMed] [Google Scholar]
- 50. Kaido M, Dogru M, Yamada M, et al. Functional visual acuity in Stevens-Johnson syndrome. Am J Ophthalmol. 2006;142:917–922 [DOI] [PubMed] [Google Scholar]
- 51. Kaido M, Dogru M, Ishida R, Tsubota K. Concept of functional visual acuity and its applications. Cornea. 2007;26:S29–S35 [DOI] [PubMed] [Google Scholar]
- 52. Mengher LS, Bron AJ, Tonge SR, Gilbard DJ. A non-invasive instrument for clinical assessment of the pre-corneal tear film stability. Curr Eye Res. 1985;4:1–7 [DOI] [PubMed] [Google Scholar]
- 53. Kojima T, Ishida R, Dogru M, et al. A new noninvasive tear stability analysis system for the assessment of dry eyes. Invest Ophthalmol Vis Sci. 2004;45:1369–1374 [DOI] [PubMed] [Google Scholar]
- 54. Simmons PA, Donshik PC, Kelly WF, Vehige JG. Conditioning of hydrogel lenses by a multipurpose solution containing an ocular lubricant. CLAO J. 2001;27:192–194 [PubMed] [Google Scholar]
- 55. Bourassa S, Benjamin WJ. Clinical findings correlated with contact angles on rigid gas permeable contact lens surfaces in vivo. J Am Optom Assoc. 1989;60:584–590 [PubMed] [Google Scholar]


