Abstract
Osteoblastogenesis is the process by which mesenchymal stem cells differentiate into osteoblasts that synthesize collagen and mineralize matrix. The pace and magnitude of this process are determined by multiple genetic and environmental factors. Two inbred strains of mice, C3H/HeJ and C57BL/6J, exhibit differences in peak bone mass and bone formation. Although all the heritable factors that differ between these strains have not been elucidated, a recent F1 hybrid expression panel (C3H × B6) revealed major genotypic differences in osteoblastic genes related to cellular respiration and oxidative phosphorylation. Thus, we hypothesized that the metabolic rate of energy utilization by osteoblasts differed by strain and would ultimately contribute to differences in bone formation. In order to study the bioenergetic profile of osteoblasts, we measured oxygen consumption rates (OCR) and extracellular acidification rates (ECAR) first in a preosteoblastic cell line MC3T3-E1C4 and subsequently in primary calvarial osteoblasts from C3H and B6 mice at days 7, 14, and 21 of differentiation. During osteoblast differentiation in media containing ascorbic acid and β-glycerophosphate, all 3 cell types increased their oxygen consumption and extracellular acidification rates compared with the same cells grown in regular media. These increases are sustained throughout differentiation. Importantly, C3H calvarial osteoblasts had greater oxygen consumption rates than B6 consistent with their in vivo phenotype of higher bone formation. Interestingly, osteoblasts utilized both oxidative phosphorylation and glycolysis during the differentiation process although mature osteoblasts were more dependent on glycolysis at the 21-day time point than oxidative phosphorylation. Thus, determinants of oxygen consumption reflect strain differences in bone mass and provide the first evidence that during collagen synthesis osteoblasts use both glycolysis and oxidative phosphorylation to synthesize and mineralize matrix.
Bone formation is a complex process that involves mesenchymal stem cell (MSC) differentiation into osteoblasts (1). We and others have shown that bone formation and bone mass in inbred strains of mice are genetically programmed, although the basis for these differences has not been elucidated (2). Osteoblastic differentiation requires the synthesis of collagen, a step that demands an up-regulation in energy utilization. This can be achieved through the influx of glucose by either glycolysis or oxidative phosphorylation (OxPhos). Osteoblasts can respond to insulin and IGF-1 by up-regulating glucose uptake through GLUT transporters (3, 4). Previous work has shown that in the predifferentiation state (multipotent stem cells) glycolysis predominates (5). However, as cells move through differentiation, substrate utilization shifts towards OxPhos because it generates more molecules of ATP than glycolysis (6). However, increased OxPhos activity in MSCs can lead to a concomitant rise in reactive oxygen species, which could lead to cell damage or lineage switches (7). Hence, there must be specific mechanisms that coordinate the fine balance between OxPhos and glycolysis without generating excess reactive oxygen species (8).
In this study, we hypothesized that there was a switch to OxPhos during osteoblast differentiation and that inbred strain differences in bone formation were partially the result of changes in osteoblastic energy utilization. In part, this hypothesis was based on preliminary studies using a hybrid F1 (C3H×B6) expression database that revealed a host of expression differences in genes related to mitochondrial oxidation (C.R.F., unpublished data). To understand the bioenergetics of osteoblast differentiation we used several in vitro models and the Seahorse Bioscience XF24 analyzer. First, we studied a well-recognized preosteoblastic cell line, MC3T3-E1C4. We then examined calvarial osteoblasts from 2 inbred strains of mice, C57BL/6J (B6) and C3H/HeJ (C3H) that differed in their differentiation and mineralization (9).
Materials and Methods
Cell culture and growth conditions
MC3T3-E1C4 cells were obtained from ATCC and cultured in 10% fetal bovine serum α-MEM (Invitrogen; catalog no. 12571-071) with 1% penicillin and streptomycin (Gibco; catalog no. 15140-122). For osteoblastic differentiation the media were supplemented with 8 mM β-glycerophosphate (Sigma; catalog no. G9422) and 50 μg/mL ascorbic acid (Sigma; catalog no. A4544). During the differentiation assay media were changed daily for 7, 14, or 21 days. Media and culture conditions were the same for the calvarial osteoblasts. MC3T3-E1C4 cells were plated at a density of 50 000 cells/well in a volume of 100 μL per well in a tissue culture plate (Seahorse Bioscience; catalog no. 100850-001). Cells were allowed to settle and adhere to the bottom of the well for 1 hour, after which 150 μL of the culture media was added. All cells were cultured in a humidified incubator maintained at 37°C and 5% CO2.
XF24 analyzer and protocols
We used the standard protocol provided by the manufacturer to first plate cells at the optimal cell density for the different cell lines, and then studied oxygen consumption rate (OCR) and extracellular acidification rates (ECAR) as described elsewhere (11). We also used the Mito Stress test (Seahorse Bioscience; catalog no. 101706-100) to test whether there were any changes in mitochondrial function of the cells with differentiation.
The Mito Stress test uses inhibitors of mitochondrial oxidative phosphorylation, namely Oligomycin (1.2 μM) F0-F1ATPase inhibitor, carbonylcyanide p-(trifluoromethoxy) phenylhydrazone (FCCP, 0.56 μM) an uncoupler, antimycin A, and Rotenone (0.96 μM), that inhibit uncoupled respiration. The same experiment also yields ECARs measured by changes in assay media pH. The OCR and ECAR values were calculated using the various parameters that are obtained after running the stress test as described by the manufacturer. Substrate for all assays was 25 mM glucose (Sigma; catalog no. G7528) and 10 mM pyruvate (Sigma; catalog no. S8636). The differentiation assay was as described above. Upon completion of the assay, the cells were viewed under the microscope to test viability followed by estimation of protein concentration. The quantities of protein in micrograms/mL measured by a Bradford-based assay (Bio-Rad Laboratories; catalog no. 500-0006EDU) for each well were used to normalize raw values. OCR values are shown as femtomoles/min/μg of total protein compared over time at 3 different time points per condition. All Seahorse experiments were repeated at least twice. All the data shown in the assays are an average of at least 3 different wells per group.
Calvarial osteoblast and bone marrow stromal cell isolation
Calvarial osteoblasts were isolated from B6 and C3H neonates; the isolation protocol was followed as described in Reference 10. After reaching confluence, cells were amplified and frozen for subsequent experiments. All procedures were approved by the IACUAC committee at Maine Medical Cancer Research Institute. Bone marrow stromal cells were isolated from the tibia and femur as previously described (12).
Statistical analysis
All the data were analyzed using Microsoft Excel. P values were calculated using Student's t test, and the null hypothesis was rejected for P values <.05.
Results
Differentiation of B6 and C3H bone marrow stromal cell (BMSC) cultures
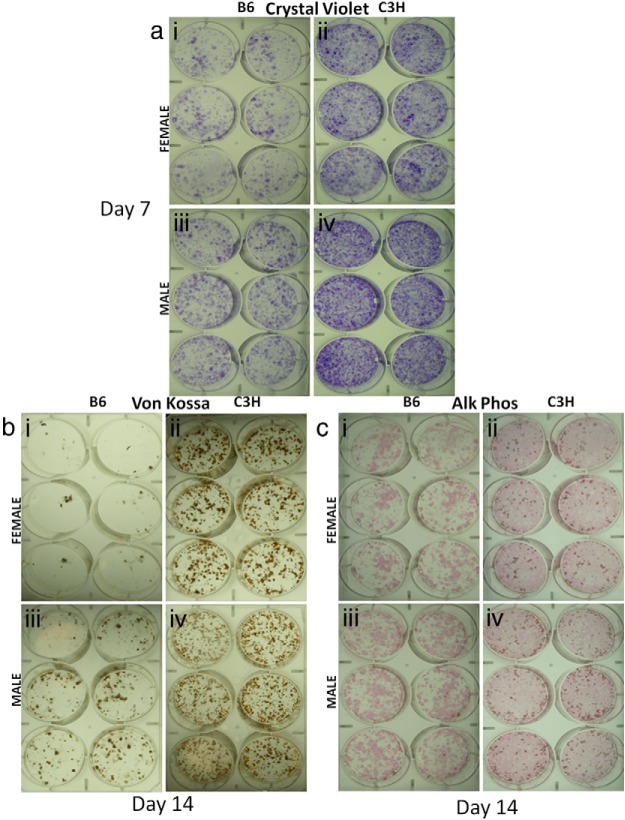
Previously, we reported that C3H has higher cortical and trabecular bone mass than B6 (13). Moreover, in vitro studies established that neonatal calvarial osteoblasts from C3H differentiate more rapidly and with greater mineralization than B6 under the same conditions (9). To confirm that this genetic programming also extended to BMSCs, and to assess the relationship of in vitro differentiation to changes in energy consumption, we compared the efficiency of bone nodule formation in B6 and C3H BMSCs that were cultured from 8-week-old male and female mice. Similar to findings from earlier work, crystal violet, VonKossa, and alkaline phosphatase staining of these cells showed that C3H BMSCs differentiate more rapidly and to a greater extent of mineralization than B6 BMSCs (Figure 1, a–c), confirming that there are genetic programs driving osteoblast differentiation in vitro.
Figure 1.
C3H have more bone-forming progenitors than B6. Crystal violet, 7 days (panel a) VonKossa, 14 days (panel b and c) alkaline phosphatase+Von Kossa 14 days (panel c), stained BMSC culture cells from B6 and C3H 8-week-old female (a, b, c, i, ii) and male (a, b, c, iii, iv) mice cultured in differentiation media. Alk Phos, alkaline phosphatase.
Osteoblast bioenergetic parameters
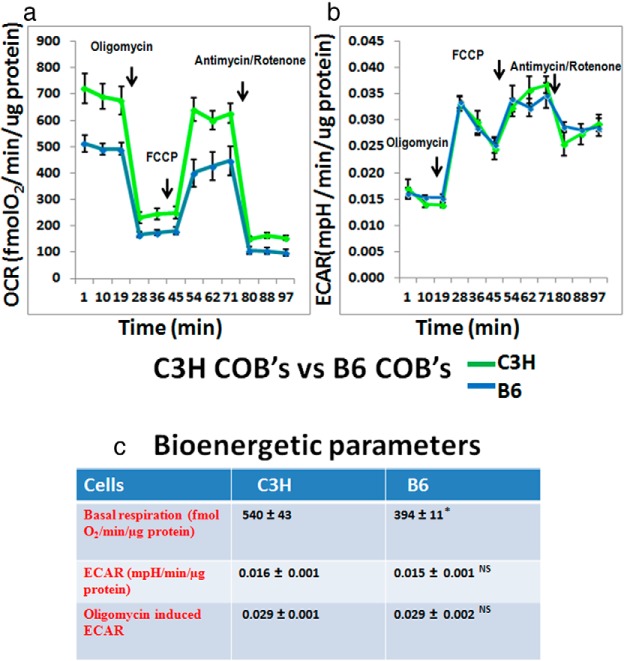
Next, The differences we observed with the BMSCs between C3H and B6 (Figure 1) prompted us to compare the metabolic profiles of C3H and B6 calvarial osteoblasts. To study the metabolic profiles, we used the XF-24 extracellular flux analyzer to measure OCRs and ECARs. The XF-24 analyzer first measured basal respiration rate in preosteoblast cells (OCR) at 3 sequential time points, and then performed a Mito Stress test using a number of inhibitors of the mitochondrial electron transport chain in a sequence. First, by injecting oligomycin, there is inhibition of oxygen consumption; this is followed by uncoupling the electron transport chain using FCCP, thereby increasing OCR. Next, respiration is completely inhibited using a combination of Complex I and Complex III inhibitors, rotenone and antimycin A. The change in the media pH values is plotted as the ECAR and is used as a measure of glycolysis. We observed that C3H cells had higher OCRs than B6, but did not show any difference in ECARs (Figure 2, a–c).
Figure 2.
Comparison of C3H vs B6 calvarial osteoblasts OCR (panel a) and ECAR (panel b) profiles of C3H and B6 calvarial osteoblasts that have undergone the Mito Stress test; this is representative of 2 individual tissue culture experiments. Each data point represents 3 or more wells; arrows point to the injection of electron transport chain inhibitors. Oligomycin is injected after 3 basal OCR readings; next FCCP, an uncoupler, is injected, which leads to an increase in OCR; this is followed by injection with both antimycin A and rotenone, leading to inhibition of complex I and complex III of the electron transport chain. ECAR is shown as change in pH at the same time points when OCR readings are obtained. This is the basic set up for all the representative Mito Stress experiments that are shown in this paper. c, Metabolic parameters obtained from C3H and B6 cells cultured for 7 days in growth media, followed by Mito Stress test. All data are represented as ± SEM; P = 0.0008 for OCR; P = .6 for ECAR; and P = .9 for oligomycin-induced ECAR (not significant). COB, calvarial osteoblast.
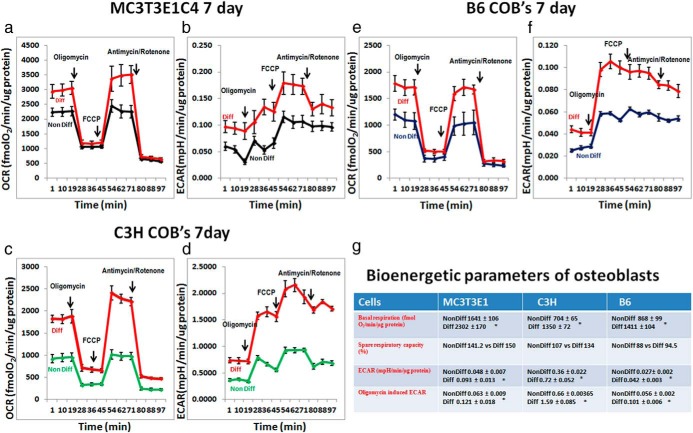
Next we wanted to determine how differentiation affected metabolic profiles. To this end we cultured MC3T3-E1C4 cells in the XF24 tissue culture plate for 7 days with either differentiation media or growth media and subjected them to a Mito Stress test. During osteogenesis in MC3T3-E1C4 cells, there is an increase in basal OCR and ECAR (Figure 3, a and b) at day 7 compared with cells grown in regular media. The basal respiration comparison in Figure 3 shows increased glycolysis and OxPhos during osteoblast differentiation. The addition of oligomycin that inhibits OxPhos-dependent ATP generation leads to an increase in glycolysis in both the differentiating and nondifferentiating cells, but the higher ECAR activity is maintained throughout by the differentiating cells. The increase in ECAR with oligomycin treatment suggests that the metabolic pathways are coupled in both the differentiating and nondifferentiating cells. The increase in ECAR, even when there is a higher level of mitochondrial respiration, suggests that these cells are undergoing aerobic glycolysis. There is also a small increase in the coupling efficiency of differentiated cells compared with nondifferentiated cells (Figure 3g), which is a measure of the fraction of basal respiration used for ATP generation vs proton leak. The spare respiratory capacity (SRC) of differentiating cells was 120% compared with 104% in nondifferentiated cells (Figure 3g). The OCR:ECAR ratio suggests that there is no preference at this stage of differentiation for a particular bioenergetic pathway (data not shown), such that differentiating cells use both OCR and ECAR to meet energy demands.
Figure 3.
Bioenergetics profile of MC3T3-E1C4, C3H, and B6 calvarial osteoblasts OCR (panel a) and ECAR (panel b) profile of MC3T3-E1C4 cells undergoing Mito Stress test comparing cells differentiated for 7 days in osteogenic media vs cells in regular media (50 000 cells per well). c and d, OCR and ECAR profiles of C3H calvarial osteoblasts that have undergone osteogenic differentiation compared with cells that were cultured in regular media. e and f, B6 calvarial osteoblasts undergoing Mito Stress test. g, Metabolic profile of each cell type from one individual; separate experiment the values obtained are an average of 3 individual time point, and each time point is an average of at least 3 individual wells. The data shown are representative of at least 2 individual differentiation assays on which the Seahorse Mito Stress experiments were performed. Assays for each cell line/strain were performed on separate plates; therefore statistical comparisons cannot be made between cell lines/strains. All data are represented as ± SEM and P < .05 compared with line/strain-matched nondifferentiated controls. COB, calvarial osteoblast.
We next used primary calvarial osteoblasts isolated from B6 and C3H mice cultured in similar conditions. These 2 inbred strains have significantly different skeletal phenotypes such that C3H mice have very high cortical and trabecular bone with greater rates of bone formation compared with B6 (9). Much like MC3T3-E1C4 cells, there was an increase in basal and maximal respiratory parameters in differentiating cells compared with nondifferentiating cells in both strains (Figure 3, c–f). Differentiated C3H cells had higher basal respiration compared with nondifferentiating cells, similar to B6 basal respiration. ECAR in C3H and B6 differentiating cells was higher than nondifferentiating cells. Oligomycin treatment induced ECARs over basal values. The SRC in differentiated C3H cells was 134% vs 107% in nondifferentiated cells. Interestingly for B6 differentiated cells FCCP treatment did not increase maximal respiration over basal respiration levels. This suggested that the cells have a lower SRC compared with C3H cells (Figure 3g). The OCR:ECAR ratio revealed no differences, suggesting that these cells are using bioenergtic pathways similar to MC3T3-E1C4 cells (C3H data not shown; B6 Figure 4ei). The results for both C3H and B6 calvarial osteoblasts are similar to what was observed in MC3T3-E1C4 cells. These data provide strong evidence that calvarial osteoblasts use both glycolysis and OxPhos for energy production during early osteoblast differentiation.
Figure 4.
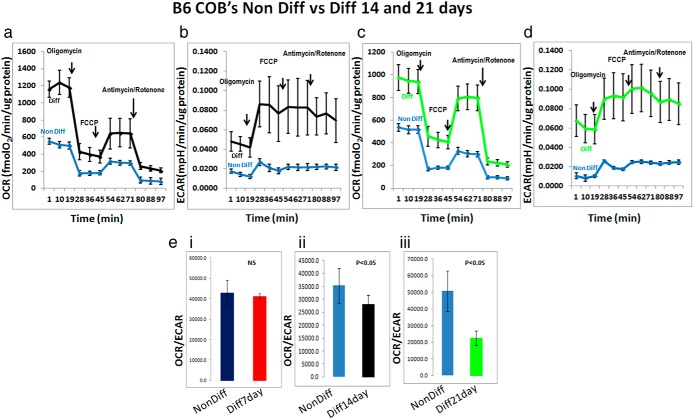
B6 calvarial osteoblasts differentiated for 14 and 21days, OCR (a and c) and ECAR (b and d) profiles of B6 calvarial osteoblasts that have undergone differentiation for 14 days (a and b) and 21 days (c and d). The data shown are representative of 2 individual runs for the 14-day assay and an average of 2 independent runs for the 21-day assay. (e, i, ii, iii) Bar graphs for OCR:ECAR ratio for B6 calvarial osteoblasts that have been differentiated for 7, 14, and 21 days, respectively, in osteogenic differentiation media and compared with nondifferentiation media. Diff, differentiation; Non Diff, nondifferentiation.
To determine whether there was a metabolic switch during differentiation, we examined 2 other time points, 14 day and 21 day, using B6 calvarial osteoblasts. The 14-day differentiation assay and subsequent Mito Stress test in B6 cells showed that OCR and ECAR increased in differentiating cells compared with control cells (Figure 4, a and b). Importantly, we observed that the OCR:ECAR ratio revealed that differentiating cells were more glycolytic than nondifferentiating cells (Figure 4e, ii). Finally, we undertook a long-term differentiation assay on B6 calvarial osteoblasts for 21days in osteoblast differentiation media. Similar to the 14-day time point, differentiating cells in culture for 21days had higher OCRs and ECARs (Figure 4, c and d). The OCR:ECAR ratio demonstrated that differentiated cells at this time point were more glycolytic than nondifferentiated cells (Figure 4e, iii).
The OCR:ECAR ratio was not significantly different between nondifferentiating and differentiating cells at the initial 7-day time point but the differentiating cells become more glycolytic at the 14-day and 21-day time points, suggesting that the increase that we observe in ECAR levels of differentiating osteoblasts is necessary for osteoblast differentiation.
Discussion
The utilization of energy by osteoblasts to synthesize matrix is critical for both the developing and mature skeleton. Very early studies showed that bone extracts from animals treated with PTH produced more lactate and were prone to aerobic glycolysis (Warburg effect) (14, 15). More recently, work by Komarova et al (16) showed that differentiating osteoblasts from rat calvaria use oxidative phosphorylation as they become more mature. Also, mitochondria in the differentiated osteoblasts have higher transmembrane potential compared with the cells that are not undergoing differentiation, suggesting that changes in the bioenergetic profile of the cells are critical for osteogenesis. We used neonatal calvarial bone cells to study the bioenergetic profile of osteoblasts and found that during differentiation osteoblasts up-regulate both OCRs and ECARs. This finding was somewhat surprising because of the profound increase in oxidative phosphorylation that occurs with exposure of calvarial osteoblasts to differentiation media (see Figure 3). Moreover, we found that mature osteoblasts were more glycolytic than cells that were undifferentiated. Thus, it appears that differentiating osteoblasts need to increase glycolysis in step with enhanced OxPhos in order to fuel collagen synthesis and matrix mineralization. But the question of why glycolysis is up-regulated at a time when oxidative phosphorylation is enhanced, particularly because glycolytic generation of ATP is far less efficient than OxPhos, is not clear. One possibility is that enhanced glycolysis protects osteoblasts from the generation of excessive reactive oxygen species from OxPhos and mitochondrial biogenesis.
Previously, we showed that 2 inbred strains of mice differed in their rate and magnitude of peak bone acquisition (9). These differences corresponded to strain-related changes in osteoblast differentiation in vitro and bone formation in vivo. To test whether calvarial cells from those 2 strains, C3H and B6, also differed in oxygen consumption during osteoblast differentiation, we measured OCR and ECAR at different stages of differentiation. We found that C3H calvarial osteoblasts had significantly higher OCR than B6. We also showed that BMSCs isolated from C3H bones have a higher potential to form bone nodules as assayed by in vitro osteoblast differentiation. These data are consistent with our other findings that osteoblast bioenergetics is a major determinant of bone formation and could reflect in vivo differences in bone mass.
There are several limitations to our experimental approach. First, our data are derived from neonatal calvarial osteoblasts. This pool of progenitor cells is already committed to the osteoblast lineage, although these cells at an early stage do not show preference for a particular pathway but generally up-regulate respiration. A second limitation is the a priori selection of time points to study OxPhos and glycolysis in calvarial osteoblasts. We chose 7, 14, and 21 days to analyze bioenergetics, but could have missed a switch from glycolysis to OxPhos at another time point. However, it should be pointed out that at day 21, which is a time of in vitro mineralization, there is still a high rate of glycolysis consistent with our findings at days 7 and 14. This approach does not reveal what is happening at the individual cell level because a population of differentiating cells would have cells at varying stages of differentiation. Because bioenergitic parameters shown in Figure 3g are from separate plates, comparisons cannot be made between plates. Finally, these studies were all done in vitro; hence, inferences regarding the relationship between mitochondrial respiration and bone formation rates in vivo between the 2 strains should be made cautiously. Further technological developments may allow us to measure mitochondrial function during skeletal remodeling.
In conclusion, we showed that during the initial stages of osteoblast differentiation there is an increase in OxPhos and glycolysis that is sustained until the 21-day time point. At the time of mineralization, osteoblasts prefer glycolysis compared with cells at the 7-day time point at which both glycolysis and OxPhos are up-regulated. Inherent strain differences in oxidative phosphorylation may reflect rates of bone mass acquisition. Future studies could lead to targetable pathways related to bioenergetics for the treatment of osteoporosis.
Acknowledgments
We thank Casey R. Doucette, Victoria E. DeMambro, and Katherine J. Motyl for critical review of the manuscript.
This work was supported by National Institutes of Health Grants AR045433 and DK092759 (to C.J.R.). Seahorse XF24 is part of the stem cell core facility at MMCRI COBRE P20 RR181789, and Dr Don M. Wojchowski is the PI on the stem cell COBRE.
Disclosure Summary: The authors have nothing to disclose.
Footnotes
- BMSC
- bone marrow stromal cell
- ECAR
- extracellular acidification rate
- FCCP
- carbonylcyanide p-(trifluoromethoxy) phenylhydrazone
- MSC
- mesenchymal stem cell
- OCR
- oxygen consumption rate
- OxPhos
- oxidative phosphorylation
- SRC
- spare respiratory capacity.
References
- 1. Karsenty G, Kronenberg HM, Settembre C. Genetic control of bone formation. Annu Rev Cell Dev Biol. 2009;25:629–648 [DOI] [PubMed] [Google Scholar]
- 2. Beamer WG, Donahue LR, Rosen CJ, Baylink DJ. Genetic variability in adult bone density among inbred strains of mice. Bone. 1996;18(5):397–403 [DOI] [PubMed] [Google Scholar]
- 3. Zoidis E, Ghirlanda-Keller C, Schmid C. Stimulation of glucose transport in osteoblastic cells by parathyroid hormone and insulin-like growth factor I. Mol Cell Biochem. 2011;348(1–2):33–42 [DOI] [PubMed] [Google Scholar]
- 4. Thomas DM, Maher F, Rogers SD, Best JD. Expression and regulation by insulin of Glut 3 in UMR 106–01, a clonal rat osteosarcoma cell line. Biochem Biophys Res Commun. 1996;218(3):789–793 [DOI] [PubMed] [Google Scholar]
- 5. Shyh-Chang N, Daley GQ, Cantley LC. Stem cell metabolism in tissue development and aging. Development. 2013;140(12):2535–2547 [DOI] [PMC free article] [PubMed] [Google Scholar]
- 6. Hinkle PC, Kumar MA, Resetar A, Harris DL. Mechanistic stoichiometry of mitochondrial oxidative phosphorylation. Biochemistry. 1991;30(14):3576–3582 [DOI] [PubMed] [Google Scholar]
- 7. Tormos KV, Anso E, Hamanaka RB, Eisenbart J, Joseph J, Kalyanaraman B, Chandel NS. Mitochondrial complex III ROS regulate adipocyte differentiation. Cell Metab. 2011;14(4):537–544 [DOI] [PMC free article] [PubMed] [Google Scholar]
- 8. Chen CT, Shih YR, Kuo TK, Lee OK, Wei YH. Coordinated changes of mitochondrial biogenesis and antioxidant enzymes during osteogenic differentiation of human mesenchymal stem cells. Stem Cells. 2008;26(4):960–968 [DOI] [PubMed] [Google Scholar]
- 9. Sheng MH, Lau KH, Beamer WG, Baylink DJ, Wergedal JE. In vivo and in vitro evidence that the high osteoblastic activity in C3H/HeJ mice compared to C57BL/6J mice is intrinsic to bone cells. Bone. 2004;35(3):711–719 [DOI] [PubMed] [Google Scholar]
- 10. Rosen CJ, Dimai HP, Vereault D, et al. Circulating and skeletal insulin-like growth factor-I (IGF-i) concentrations in two inbred strains of mice with different bone mineral densities. Bone. 1997;21(3):217–223 [DOI] [PubMed] [Google Scholar]
- 11. Wu M, Neilson A, Swift AL, et al. Multiparameter metabolic analysis reveals a close link between attenuated mitochondrial bioenergetic function and enhanced glycolysis dependency in human tumor cells. Am J Physiol Cell Physiol. 2007;292(1):C125–C136 [DOI] [PubMed] [Google Scholar]
- 12. Le P, Kawai M, Bornstein S, DeMambro VE, Horowitz MC, Rosen CJ. A high-fat diet induces bone loss in mice lacking the Alox5 gene. Endocrinology. 2012;153(1):6–16 [DOI] [PMC free article] [PubMed] [Google Scholar]
- 13. Sheng MH, Baylink DJ, Beamer WG, et al. Histomorphometric studies show that bone formation and bone mineral apposition rates are greater in C3H/HeJ (high-density) than C57BL/6J (low-density) mice during growth. Bone. 1999;25(4):421–429 [DOI] [PubMed] [Google Scholar]
- 14. Nichols FC, Neuman WF. Lactic acid production in mouse calvaria in vitro with and without parathyroid hormone stimulation: lack of acetazolamide effects. Bone. 1987;8(2):105–109 [DOI] [PubMed] [Google Scholar]
- 15. Neuman WF, Neuman MW, Brommage R. Aerobic glycolysis in bone: lactate production and gradients in calvaria. Am J Physiol. 1978;234(1):C41–C50 [DOI] [PubMed] [Google Scholar]
- 16. Komarova SV, Ataullakhanov FI, Globus RK. Bioenergetics and mitochondrial transmembrane potential during differentiation of cultured osteoblasts. Am J Physiol Cell Physiol. 2000;279(4):C1220–C1229 [DOI] [PubMed] [Google Scholar]


