

Abstract
Accelerometers objectively monitor physical activity and sedentary patterns and are increasingly used in the research setting. It is important to maintain consistency in data analysis and reporting, therefore, we: (1) systematically identified studies using accelerometry (ActiGraph, Pensacola, FL, USA) to measure moderate-to-vigorous physical activity (MVPA) and sedentary time in older adults, and (2) based on the review findings, we used different cut-points obtained to analyze accelerometry data from a sample of community-dwelling older women. We identified 59 articles with cut-points ranging between 574 and 3,250 counts/min for MVPA and 50 and 500 counts/min for sedentary time. Using these cut-points and data from women (mean age, 70 years), the median MVPA minutes per day ranged between 4 and 80 min while percentage of sedentary time per day ranged between 62 % and 86 %. These data highlight (1) the importance of reporting detailed information on the analysis assumptions and (2) that results can differ greatly depending on analysis parameters.
Keywords: Accelerometer, Measurement, Analysis assumptions, Physical activity, Sedentary behavior
Introduction
Physical activity contributes to healthy aging, while it is increasingly recognized that sedentary behavior is also an independent determinant of health. The American College of Sports Medicine provides physical activity guidelines specific to older adults for functional ability, mortality, falls, mental and cognitive health, and the prevention and treatment of many chronic conditions [60]. They recommend that older adults accumulate 30 min of aerobic activity at a moderate level for at least 5 days/week [60], although more recent guidelines recommend 150 min/week [86, 90]. In contrast, sedentary behavior describes activities that are low in energy expenditure [≤1.5 metabolic equivalent of task (METs)]. These activities are done in a sitting or reclining position [76] and are associated with adverse health outcomes [85]. Accurately measuring time spent in both physical and sedentary activities is important for (1) investigating their dose–response influence on specific health outcomes, (2) informing appropriate interventions, and (3) testing the effectiveness of interventions aimed at increasing physical activity and/or decreasing sedentary time.
Physical activity and sedentary time are frequently assessed using self-report questionnaires, however, potential limitations include recall bias, socially desirable responses [74], and the influence of mood, depression, anxiety, cognition, and disability on responses [72]. This is especially important with questionnaires developed for younger adults but administered to older adults, as they may underestimate the physical activity level of older adults as they engage in different types of activities [92]. More recently, accelerometers are used to objectively describe activity patterns. They provide an objective measure that eliminates many of the challenges associated with self-report questionnaires and are appropriate for use in older adults [59].
The ActiGraph (Pensacola, FL, USA) accelerometer is a commonly used accelerometer for physical activity research. The monitor is usually worn at the waist. Early versions of the monitor used (cantilever beam) piezoelectric sensors to measure raw acceleration that is processed into activity counts with frequency filters. Since the introduction of the GT1M moniter, the sensor is a Micro Electro Mechanical Systems (MEMS) capacitative accelerometer [11]. Thresholds for the activity counts (cut-points) are determined from validation studies to classify activity intensity [11]. The monitors provide time and date-stamped information on activity intensity, categorized as sedentary (≤1.5 METs), light (1.6–2.9 METs) [64], or moderate-to-vigorous (≥3 METs) [23].
Accelerometry assumptions for the choice of cut-points and data analysis are not standardized across research protocols [52]. The majority of peer-reviewed literature informing accelerometry data analysis methods are from studies that included children and young adults [52, 53, 70, 88]. Literature on accelerometry in older adults is limited and many previous studies used validity studies completed on younger adults to determine cut-points for activity intensity. Taraldsen and colleagues [83] reviewed the use of accelerometers for physical activity monitoring in older adults and highlighted the wide variety of physical activity measures and called for the development of a consensus.
Therefore, our purpose was to: (1) undertake a systematic review of the literature to identify studies that used ActiGraph accelerometers to assess moderate-to-vigorous physical activity (MVPA) and sedentary behavior in older adults and (2) determine the effect of changing physical activity and sedentary cut-points on the results for older adults. The results of this study will provide an overview of literature objectively measuring physical activity and sedentary behavior patterns in older adults and will highlight current practice for accelerometry analysis for this age group.
Methods
In this two-part study, first, we completed a systematic search of the published peer-reviewed literature that used accelerometry to assess physical activity and sedentary behavior patterns of older adults and identified cut-points used to classify intensity of activities. Second, we used this information to analyze an accelerometry sample of older women’s activity patterns over 7 days to illustrate the effect of changing the different reported cut-points.
Phase 1: systematic review
Data sources and search strategy.
We completed an electronic search of the peer-reviewed literature for publications related to accelerometers, physical activity or sedentary behavior, and older adults. We reviewed published peer-reviewed literature from 1950 to July 4, 2012 from the following databases: AgeLine, CINAHL, EMBASE, OVID Medline, PubMed, and SPORTDiscus. We limited our search to adults aged 65 years and older using relevant Medical Subject Heading and keywords but included articles with older adults with a group mean age ≥60 years if they were found with our search strategy (Fig. 1). We completed the review in accordance with the Preferred Reporting Items for Systematic Reviews and Meta-analyses guidelines [45].
Fig. 1.
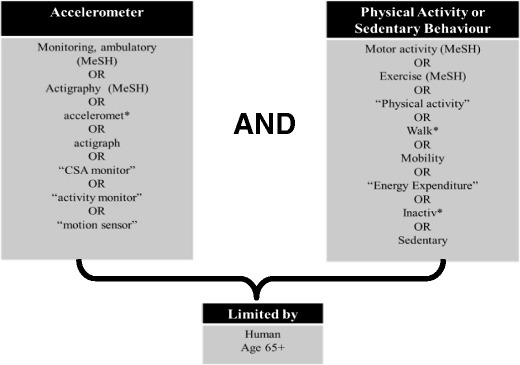
Search strategy terms for accelerometers and physical activity or sedentary behavior in older adults
Study selection.
We included studies that used ActiGraph accelerometer (Pensacola, FL, USA) models CSA, MTI, 7164, GT1M, GT3X, and GT3X+ at the waist to objectively measure physical activity and sedentary behavior in free-living conditions. Specifically, we included studies with defined cut-points to determine activity intensity in community dwelling older adults (mean age of 60 years or older). We excluded studies that were targeted for special populations (e.g., older adults with stroke). Two of three reviewers (EG, HH, PY) independently reviewed each retrieved article based on title and abstract for relevance, and the additional reviewer resolved any discrepancies. Two of three reviewers (EG, HH, PY) then independently reviewed each full text article for inclusion and documented reasons for exclusion from the review. The final decision to include studies was decided by consensus with the third reviewer resolving any discrepancies. We did not rate the quality of the studies included in this review.
Data extraction.
We extracted the following information from the included studies: study population; accelerometry data collection methods and accelerometry analysis assumptions including valid day criteria; cut-points; and any other relevant assumptions reported. Two reviewers independently extracted data, and a third reviewer (EG, HH, PY) checked this information for accuracy.
Phase 2: accelerometry data analysis
Based on the cut-points reported in published literature identified and reviewed in Phase 1, we analyzed accelerometry data from active community-dwelling older women (65–75 years). Data were from a sample from a randomized controlled trial testing the effect of frequency of resistance training on cognition in older women [46]. This study was approved by the local university and hospital ethics review boards, and all eligible participants provided written informed consent. Participants wore the accelerometer (ActiGraph GT1M) at the waist during waking hours for 1 week in the winter. We set the accelerometers to collect data with 1-min epochs. To be included in the analysis, participants wore the accelerometer for at least 4 days and at least 10 h/day of valid wear time. We did not adjust for wear time. We analyzed the accelerometry data with the reported cut-points that we obtained from the systematic review. We used MeterPlus (Santech, Inc., La Jolla, CA) to analyze the accelerometer data files and excluded non-wear time (60 min or more of continuous zeros, based on the NHANES (National Health and Nutritional Examination Survey) criteria [87] and determined the time spent in sedentary, MVPA, and bouted MVPA (≥10 min of continuous MVPA with 1 to 2 min tolerance). For descriptive purposes, we included participants’ age, body mass index (BMI), 6-min walk test time (6MWT) [7] and Physical Activity Scale for the Elderly (PASE) self-reported physical activity score [93].
Statistical analysis
We used percent agreement to report consistency between reviewers for study inclusion in the systematic review. For data analysis, we summarized participants’ descriptive information with mean/standard deviation (SD) or median/interquartile range (IQR) (if data were skewed). We calculated the mean and SD, or median and IQR for the average daily time spent in sedentary and MVPA for each cut-point determined from the literature. For each cut-point, we calculated the percentage of participants who met 30 min of physical activity per day and the average percentage of the day spent in sedentary time. These values were compared with the most commonly used cut-point (1,952 counts/min for MVPA and 100 counts/min for sedentary time) following Bland-Altman’s method for assessing agreement between two measures [4]. To investigate differences between the most commonly used cut-point and other cut-points when used to measure group differences, we used logistic regression to calculate odds ratios for meeting 30 min of MVPA based on participant age and 6MWT result. For the 6MWT, we used a cut-point ≤490 m to indicate lower physical capacity [69]. For the Bland-Altman methods, we presented values of the mean differences, standard deviation (SD) of the differences, and the upper and lower limit of the Bland-Altman agreement levels (SD +/− 1.96). We used R (Foundation for Statistical Computing, Vienna, Austria) for the statistical analyses [18].
Results
Phase 1
In this review, we identified 59 publications for inclusion (Fig. 2), and this represented 45 unique study data sets. Our two independent reviewers had 92 % agreement on the inclusion of articles in the study. The details of the 59 included publications, in particular, the activity monitor model, their accelerometry data collection, and analysis protocols are listed in Table 1. Within the 59 publications, there were: 34 papers that used the models 7164, 71256, MTI (7162); 23 that used the GT1M accelerometer; and only one study that used the GT3X monitor. A total of 53 publications included cut-points for MVPA and 36 for sedentary time. We located nine publications with the National Health and Nutritional Examination Survey (NHANES) 2003–2004 data and three that used the NHANES 2005–2006 data. The majority of studies (48 out of 59) included men and women, and the ActiGraph accelerometers were set at a 1-min epoch (40 of 59) for ≥7 days (52 of 59). Most publications (33 of 59) required participants to have at least four valid days with ≥10 wear hours/day to be included in their analysis.
Fig. 2.
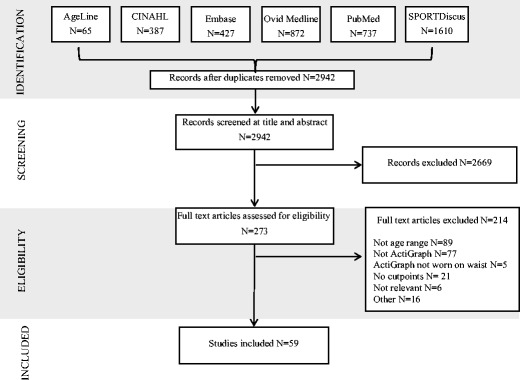
Flow diagram of article inclusion for the literature search for accelerometers and physical activity and/or sedentary behavior in older adults
Table 1.
Accelerometer-specific population, data collection, and analysis details for the 59 included articles from 45 unique data sources
| Study (data source) | Model | Population, amount of physical activity | Data collection | Data cleaning | Data inclusion | Cut-points (counts/min) | |
|---|---|---|---|---|---|---|---|
| Moderate to vigorous | Sedentary | ||||||
| Pre-2007 (N = 2) | |||||||
| Morse et al. [58] UK | 7164 | N = 21, 73.7 (3.6) years; men/women = 21/0; moderate PA (3–5.99 METs) = 33.47 (21.07) min/day | At least 7 days, 1 min epoch | Removed unusually low counts (no moderate activity with all counts <1,952), or unusually high counts (all activity vigorous with all counts >5,724), and continuous data with the same value). Manually checked missing and incomplete data and compared with logs. | 7 days ≥ 10 h/day | ≥1,952 | |
| Kolbe-Alexander et al. [43], South Africa | MTI (7162) | N = 122, median (IQR) 66 years (62 to 70); men/women = 52/70; MVPA, not reported | 7 days, 1-min epoch | ≥10 h/day | >1,952 | ||
| 2007 (N = 5) | |||||||
| Aznar-Lain et al. [2], Spain | 7164 | N = 18, 68.1 years (6.8); men/women = 4/14, baseline total MVPA for intervention group = 48 (28) min; control group = 79 (48) min | 4 days, 1-min epoch | Four consecutive days (two weekdays and two weekend days) with ≥10 h/day | ≥1,952 | ≤100 | |
| Davis and Fox [15], UK (Better Ageing) | 7164 | N = 163, 76.1 years (3.9); men/women = 70/91, MVPA/day = 19.9 (16.3) | 7 days, 1-min epoch | Removed unusually low counts (no moderate activity with counts <1,952), or unusually high counts (all activity vigorous with counts >5,724), and continuous data with same value. Manually checked data and compared with logs. | 5 days ≥10 h/day | >1,999 | <200 |
| Fox et al. [22], UK (Better Ageing) | 7164 | N = 176; men, 75.8 years (3.8), women, 75.4 years (4.0); men/women = 78/98, MVPA not reported | 7 days, 1-min epoch | Referenced to Davis and Fox [15]. Removed unusually low counts (no moderate activity with all counts <1,952), or unusually high counts (all activity vigorous with all counts >5,724), and continuous data with the same value. Manually checked data and compared to logs. | Referenced to Davis and Fox [15] five consecutive days ≥10 h/day | Referenced to Davis and Fox [15] >1,999 | Referenced to Davis and Fox [15], <200 |
| Hagströmer et al. [30], Sweden (ABC) | 7164 | N = 122; men and women 65–79 years, median MVPA/day = 21 (8–43) | 7 days, 1-min epoch | Removed >20 min of consecutive zero counts and periods of monitor malfunction (counts >20,000). | 4 days with at least one weekend day ≥10 h/day | ≥1,952 | <100 |
| Rowe et al. [73], USA | 7164 | N = 91, 74 years (9.5); men/women = 29/60, MVPA only 17.2 % of 489 days had ≥30 min | 7 days, 1-min epoch | Removed overnight accelerometer data identified from logs. Visual inspected data and confirmed the pedometer and self-reported physical activity of participants with over 60 min of MVPA. | >1,951 | ||
| 2008 (N = 11) | |||||||
| Ashe et al. [1], Canada | GT1M | N = 73, 68.8 years (3); men/women = 0/73, mean MVPA = 156 (90) min/day | 1-min epoch | 4 days (including 1 weekend day) of ≥10 h/day | ≥574 | ||
| Gerdhem et al. [27], Sweden | 71256 |
N = 57 80.1 years (0.1); men/women = 0/57, median MVPA = 13 (6–23) min/day |
7 days, 10-s epoch | Removed ≥10 min of consecutive zero counts (sequences of 60 or more consecutive zero counts). | 5 days ≥8 h/day | >1,952 | <500 |
| Johannsen et al. [39], USA | ActiGraph (model number not provided) |
N = 153 Aged group (N = 58): 69 years (1); men/women = 29/29, nonagenarian (N=95): 92 years (0.3)Men/Women 46/49 Moderate activity -Aged group spent 126 (8) min/day and the nonagenarian spent 50 (6) min/day |
14 days 1 minute epoch |
7 days ≥ 22.9 hours/day | ≥574 | ||
| Matthews et al. [54], USA (NHANES 2003–2004) | 7164 |
N = 1,437, 60–85 years; men/women = 710/727, MVPA not reported |
7 days, 1-min epoch | Removal of ≥60 min of consecutive zero counts with allowance for up to 2 min of counts between 1 and 100 and data from monitors that were not in calibration when returned. | 1 day ≥10 h/day | <100 | |
| Metzger et al. [56], USA (NHANES 2003–2004) | 7164 | N = 1,901; men and women ≥60 years, MVPA reported by days of the week | 7 days, 1-min epoch | Removed ≥60 min of consecutive zero counts and monitor malfunction (10 min of identical consecutive nonzero count values). Missing data were imputed for files with at least 1 day. | 1 day | ≥2,020 | |
| Orsini et al. [61], Sweden (Swedish mammography) | 7164 | N = 116, 64.4 years (5.6); men/women = 0/116, MVPA not reported | 7 days, 1-min epoch | 4 days ≥10 h/day | ≥760 | ≤259 | |
| Orsini et al. [62], Sweden (Swedish mammography) | 7164 | N = 133, 64.2 years (5.7); men/women = 0/133, moderate PA 31 % (95 % CI 23,29) of women met 30 min/day, 102 (58) min/day | 7 days, 1-min epoch | Removed ≥60 min of continuous zero counts and periods of monitor malfunction (counts >20,000). | 4 days ≥10 h/day | ≥760 | ≤259 |
| Parker et al. [63], USA | 7164 | N = 84, 71.3 years (8.4); men/women = 28/56, MVPA 79.7 (46.7) min/day | 7 days, 1-min epoch | Removed ≥60 min of consecutive zero counts and counts >20,000. | 4 days/week (include one weekend day) ≥10 h/day | ≥760 | <260 |
| Pruitt et al. [68], USA | 7164 | N = 106, 70–86 years; men/women = 35/71, MVPA not reported | 7 days, 1-min epoch | Removal of data resulted from monitor malfunctions identified with visual inspection. On and off times provided from participant logs. | 5 days ≥10 h/day | Individualized (based on 400 m walk) | |
| Strath et al. [81], USA (NHANES 2003–2004) | 7164 | Men and women ≥60 years, MVPA (non-bouted) 54.5 (37.3) min/day | 7 days, 1-min epoch | Removed ≥60 min of consecutive zero counts. | 4 days ≥10 h/day | ≥760 | |
| Troiano et al. [87], USA (NHANES 2003–2004) | 7164 | N = 1,260, men = 71.1 (0.4) years, women = 70.4 (0.2) years; men/women = 636/624, MVPA (non-bouted) men = 8.7 (0.7)–16.7 (1.2); and women = 5.4 (0.3)–12.4 (0.9) min/day | 7 days, 1-min epoch | Removed ≥60 min of consecutive zero counts with allowance for 1–2 min between 0 and 100, ≥60 min if monitor did not return to zero; and data from monitors that were not in calibration when returned. | 4 days ≥10 h/day | ≥2,020 | |
| 2009 (N = 4) | |||||||
| Brandon et al. [5], Canada | GT1M | N = 48, 77.4 years (4.7); men/women = 12/36, MVPA 16.5 (44.5) min/day | 7 days, 1-min epoch | Removed zero counts when the accelerometer was not worn by verifying the data with the log book. | 7 days | ≥3,250 (based on 4 METs) | |
| Copeland and Esliger [14], Canada | 7164 | N = 38, 69.7 years (3.5); men/women = 18/20, MVPA 68.2 (32.5) min/day | 7 days, 1-min epoch | Referenced to Esliger et al. [19]. | 5 days ≥10 h/day | ≥1,041 | ≤50 |
| Harris [35], UK | GT1M | N = 238, ≥65 years; men/women = 124/114, moderate PA −2.5 % of study participants met the recommended level of 150 min/week | 7 days, 5-s epoch | Removed non-wear time verified with activity logs in individuals with average daily step counts less than 2,500. | 5 days | ≥2,000 | <200 |
| Kang et al. [41], USA | 7164 | N = 91; men and women ≥60 years, MVPA not reported | 7 days | Missing data imputed using a semi-simulation design. | Three weekdays and one weekend | >1,951 | |
| 2010 (N = 6) | |||||||
| Buman et al. [6], USA | 7164 or 71256 | N = 862, 75.4 years (6.8); men/women = 380/482, MVPA 12.3 min/day | 7 days, 1-min epoch | Visually identified and removed malfunctioning accelerometer units (maximum recordable value or periods of repeated non-zeros). Valid hours had <30 consecutive zeros. | 5 days ≥10 h/day or ≥66 valid hours over 7 days | ≥1,952 | <100 |
| Hagströmer et al. [31], Sweden, USA (ABC and NHANES 2003–2004) | 7164 |
60–75 years; men/women, accumulated time, US N = 486; moderate PA, men 15 [13, 17] and women; 10 [9, 12] min/day; Sweden, N = 218, moderate PA men 29 [25, 34] and women 23 [20, 28] min/day |
7 days, 1-min epoch | Removed ≥60 min of consecutive zero counts with allowance for 1–2 min of counts between 0 and 100. | 4 days ≥10 h/day | ≥2,020 | <100 |
| Ham and Ainsworth [32], USA (NHANES 2003–2004) | 7164 | N = 939; men and women 65–74 years = 495, ≥75 years = 444, MVPA not reported | 7 days, 1-min epoch | Removed ≥60 min of consecutive zero counts with allowance for 1–2 min of counts between 1 and 100 and invalid recordings due to monitor malfunction. Implausible data were replaced with imputed data. | 4 days with at least one weekend day ≥10 h/day | ≥760 | |
| Hurtig-Wennlöf et al. [38], Sweden | GT1M | Men/women = 23/31, N = 54, median (IQR): men 71 years (68 to 76); moderate PA 91 (67–124) min/day; women 74 years (69 to 74); moderate PA 85 (65–99) min/day | 7 days, 15-s epoch | Removal of >20 min of consecutive zero counts. | Four consecutive days ≥10 h/day | Moderate ambulatory activity, ≥2,020 moderate mixed lifestyle activity, 760–2,019 | <100 |
| Jürimäe et al. [40], Estonia | 7164 |
N = 49, 73.6 years (4.2); men/women = 0/49, MVPA 34.7 (23.1) min/day |
7 days, 5-s epoch | Visual inspection to remove unusually low/high activity counts and the continuous data with the same values. Compared data to log. | 5 days | ≥1,952 | <260 |
| Peters et al. [66], China | 7164 | Men and women ≥60 years, MVPA 79.5 (57.2–105.7) min/day | 7 days, 1-min epoch | Removed ≥60 min with a modified threshold of ≥50 counts/min. | 2 days ≥10 h/day | ≥760 | <100 |
| 2011 (N = 18) | |||||||
| Camhi et al. [9], USA (NHANES 2005–2006) | 7164 | N = 1,196, ≥60 years; men/women = 611/585, MVPA 10.4 (9.1–11.7) min/day | 7 days, 1-min epoch | Removal of outliers and unreasonable values: data with >10 min of 1) 0 steps and >250 activity counts/min; 2) steps/min >200; and 3) 32,767 activity counts/min (maximum value) or if the ActiGraph were not in calibration when returned. | 1 day ≥10 h/day | ≥2,020 | |
| Cerin et al. [10], Hong Kong | GT1M | N = 96, 65–74 years, 62 % 75–84 years, 36 % 85+ years, 2 %; men/women = 40/56, MVPA 161 (145) min/week | 7 days, 1-min epoch | Removed ≥100 min of consecutive zero counts | 5 days (including one weekend day) ≥10 h/day | ≥1,952 | <100 |
| Clark et al. [13], USA (NHANES 2003–2004 and 2005–2006) | 7164 | N = 2,303; men and women 70.9 years (7.6), MVPA not reported | 7 days, 1-min epoch | Removed >60 min of consecutive zero counts with interruptions of up to two counts of ≤50 counts/min | 4 days (including one weekend day) ≥10 h/day | <100 | |
|
Davis et al. [17], UK (OPAL) |
GT1M | N = 230, 78.1 years, men/women = 117/113, MVPA 3.6 (3.4)–27.9 (2.0) min/day | 7 days, 10-s epoch | Epoch reduced to 1 min. Removed ≥100 consecutive zero counts. | 5 days ≥10 h/day | ≥1,952 | <100 |
| Davis et al. [16], UK (OPAL) | GT1M | N = 214, 78.1 (5.7) years; men/women = 109/105; MVPA ranged from 14.3 (22.4)–19.8 (22.6) min/day depending on the day of the week | 7 days, 10-s epoch | Removed ≥100 min of consecutive zero counts | 5 days ≥10 h/day | ≥1,952 | |
| Fox et al. [21], UK(OPAL) | GT1M | N = 240; men 77.5 years (5.6); women 78.6 years (8.6); men/women = 125/115, MVPA not reported | 7 days, 10-s epoch | Removed ≥100 consecutive zero counts | 5 days ≥10 h/day | ≥1,952 | |
| Gardiner et al. [25], Australia (Gardiner) | GT1M | N = 48, 72.8 (8.1) years; men/women = 13/35, MVPA not reported | 7 days, 1-min epoch | Removed non-wear time based on accelerometer data and logs. | 4 days ≥10 h/day | <100 | |
| Gardiner et al. [26], Australia, (Gardiner) | GT1M | N = 59, 74.3 (9.3) years; men/women = 15/44, MVPA not reported | 7 days, 1-min epoch | Removed non-wear time based on accelerometer data and logs. | ≥10 h/day | ≥1,041 | <100 |
| Gonzales et al. [28], USA | GT1M | N = 40; range, 60–78 years; men/women = 19/21, MVPA men 109 (49) min/day; women 85 (36) min/day | 4 days, 10 s epoch | ≥1,041 | |||
| Hart et al. [36], USA | 7164 | N = 52, 69.3 years (7.4); men/women = 13/39, 12.0 (5.2–30.0) to 15.7 (6.5–39.0) min/day | 21 days, 1-min epoch | Removed ≥60 min of consecutive zero counts. | moderate lifestyle activity 760–1,951; moderate-to-vigorous ≥1,952 | ≤50 | |
| King et al. [42], USA (SNQLS) | 7164 or 71256 | N = 719, 74.4 (6.3) years; men/women = 338/381, MVPA [mean (SE)] −48.5 (18.7) to 83.6 (18.9) min/week | 7 days, 1-min epoch | Removed ≥30 min of consecutive zero counts | 5 days ≥10 h/day OR ≥66 valid hours across 7 days | ≥1,952 | |
|
Marquez et al. [50], USA |
GT1M | N = 174; 60–69 years, 29.9 %; 70+ years, 39.1 %; MVPA men/women = 46/128; MVPA 39.7 % of all participants had at least 30 min/day | 7 days, 1 min epoch | Removed ≥60 min of consecutive zero counts | 3 days ≥10 h/day | ≥1,566 | <100 |
| Marques et al. [48], Portugal (Marques) | GT1M | N = 60; 69.9 (5.8) years; men/women = 0/60; MVPA (baseline) exercise group, 83.8 (35.2); control group, 79.6 (37.8) min/day | 7 days, 15-s epoch | 4 days | ≥1,041 | ||
| Marques et al. [49], Portugal (Marques) | GT1M | N = 71, 69.0 years (5.3); men/women = 0/71; MVPA (baseline) resistance exercise group, 93.2 (26.3); aerobic exercise group, 86.2 (32.1); control group, 78.8 (40.5) min/day | 7 days, 15-s epoch | 4 days | ≥1,041 | ||
| Pelclova et al. [65], Czech Republic | GT1M | N = 92; men/women = 0/92; MVPA (median) control group, 62.61 (4.9) years; median 200 (242) min/week; women with osteopenia 65.76 (5.21) years, 160 (202) min/week | 8 days, 1-min epoch | Referenced to Esliger et al. (2005) [19]. | |||
| Silva et al. [77], Portugal | GT1M | N = 123, ≥60 years; men/women = 40/83; MVPA [mean (SEM)] men, 33.2 (3.6) min of MVPA, women 27.8 (2.5) min | 7 days, 15-s epoch | Removed ≥60 min of consecutive zero counts | 4 days ≥10 h/day | referenced to Troiano et al. [87] ≥2,020 | <500 |
| Tucker et al. [89], USA (NHANES 2005–2006) | 7164 | Men and women ≥60 years; moderate PA 33–45 min/week for 60 years+ | 7 days, 1-min epoch | Removed ≥60 min of consecutive zero counts | 4 day ≥10 h/day | ≥2,020 | |
| Zhang et al. [96], USA | GT1M | N = 32, ≥60 years; men/women = 10/22, moderate PA men 23 min/day; women 7.7 min/day | 4 days, 1-min epoch | Removed >60 min of consecutive zeros counts with allowance for 1–2 min of counts between 0 and 100 | 2 days ≥10 h/day | ≥2,020 | |
| 2012 (N = 13) | |||||||
| Baptista et al. [3], Portugal | GT1M | N = 679, men/women = 268/411; moderate PA men 74.4 (6.8) years, 30.8 (1.3) min/day; women 74.3 (7.0) years; 22.9 (1.0) min/day | 4 days, 15-s epoch | Removed >60 min of zero activity intensity counts and non-wear time identified from participant logs | 3 days (including one weekend day) ≥10 h/day | ≥2,020 | <100 |
| Gába et al. [24], Czech Republic | GT1M | N = 97, 63.63 (5.23) years; men/women = 0/97; moderate PA 225 (152) min/week | 7 days, 15-s epoch | ≥10 h/day | ≥1,952 | ||
| Grimm et al. [29], USA | 7164 | N = 127, 63.9 (7.7) years; men/women = 31/96; moderate PA 103.1 (45.6) min/day | 7 days, 1-min epoch | Removed ≥60 min of consecutive zero counts | 5 days ≥10 h/day | ≥760 | ≤50 |
| Hamer et al. [33], UK (Whitehall II Study 2009/2010) | GT3X | N = 443, 66 (6) years; men/women = 223/220, MVPA 59.8 % of men and 49.3 % of women recorded at least 30 min/day | 7 days | Removed first and last days of data, removed ≥60 consecutive minutes of zero count | 6 days ≥10 h/day | ≥1,999 | ≤199 |
| Hansen et al. [34], Norway | GT1M | N = 591, men 71.8 (5.3) years, women 71.9 (5.7) years; men/women = 296/295, MVPA 27.9 (1.0 SEM) min/day | 7 days, , 10-s epoch | Removed ≥60 consecutive minutes of zero counts with allowance for 1 min with counts >0. Excluded 12 am–6 am as overnight non-wear time. | 4 days ≥10 h/day | Moderate activity, ≥2,020; moderate lifestyle activity. 760–2,019 | <100 |
| Hekler et al. [37], USA (SNQLS) | 7164 and 71256 |
N = 870 75.3 (6.8) years; men/women = 377/493; MVPA not reported |
7 days (×2 phases), 1-min epoch | Removed ≥45 consecutive minutes of zero counts | 5 valid days (30 consecutive “zero” and ten valid hours per day rule) OR ≥66 valid hours across 7 days | >1952 | ≤100 |
| Koster et al. [44], USA (NHANES 2003–2004) | 7164 | N = 1,906, 63.8 (10.5) years; men/women = 46.0 %/54.0 %, MVPA 14.2 (17.4) min/day | 7 days | Removed ≥60 consecutive minutes of zero counts (allowance for up to two minutes of counts between 1 and 100) | 1 day ≥10 h/day | ≥2,020 | <100 |
| Santos et al. [75], Portugal | GT1M | N = 296, 74.42 (6.72) years, men/women = 112/184, MVPA 25.5 (25.8) min/day | 4 days, 15-s epoch | Removed ≥60 consecutive minutes of zero counts | 3 days (including 1 weekend day) ≥10 h/day | ≥2,020 | <100 |
|
Stamatakis et al. [78] UK (Health Survey for England) |
GT1M | N = 649, ≥60 years, men/women = 292/357, MVPA not reported | 7 days, 1-min epoch | Removed ≥60 consecutive minutes of zero counts (allowance for up to two consecutive minutes of 1–100) | 1 day ≥10 h/day | ≥2,020 | <100 |
| Strath et al. [80], USA | 7164 | N = 148, 64.3 (8.4) years; men/women = 20.4 %/79.7 %, MVPA not reported | 7 days, 1-min epoch | Removed ≥60 consecutive minutes of zero counts | 4 days ≥10 h/day | ≥760 | <50 |
| Swartz et al. [82], USA | 7164 | N = 232, 64.3 (6.9) years; men/women = 56/176, MVPA 22.9 (22.0) min/day | 7 days | Removed ≥60 consecutive minutes where count was zero; removed values >20,000 | 4 days (including 1 weekend day) ≥10 h/day | ≥1,952 | <100 |
| Theou et al. [84], Greece | GT1M | N = 50, range, 63–90 years; men/women = 0/50, MVPA not reported | 1 day, 1-min epoch | ≥10 h/day | ≤50 | ||
| Winkler et al. [95], Australia (AusDiab 2004–2005, NHANES 2003–2004) | 7164 (not available) | N = 44, men and women ≥60 years, MVPA not reported | 7 days, 1-min epoch | Compared various data cleaning protocols | ≥1,952 | <100 | |
ABC Attitude Behaviour Change, NHANES National Health and Nutrition Examination Survey, OPAL Older People and Active Living, SNQLS Senior Neighbourhood Quality of Life Study, MVPA moderate to vigorous physical activity, MET metabolic equivalent of task
We identified many cut-points for MVPA and sedentary time in the included studies. Eight different cut-points were identified for MVPA ranging from 574 to 3,250 counts/min. The most common cut-point used was 1,952 counts/min (19 of the 59 publications), and only 17 publications used a threshold lower than this. Of the 19 publications, 15 used the threshold of greater or equal to 1,952 counts/min, and four were greater than 1,952 counts/min. An additional four publications used 2,000 counts/min, as their analysis software was not precise enough to classify 1,952 counts/min. MVPA is usually classified as 3 METs or greater, but one study calculated it as greater than or equal to 4 METs and therefore used a larger cut-point of 3,250 counts/min. In addition, three studies included three cut-points for moderate activity to classify traditional MVPA and incorporate a lower value for moderate lifestyle activities. For sedentary time, five cut-points were identified, and they ranged from 50 to 500 counts/min with the most common cut-point being 100 counts/min. Twenty-one of the 59 publications used the cut-point of 100 counts/min, and of these, 19 used the threshold of less than 100, and two used less than or equal to 100 counts/min to classify sedentary time.
Phase 2
We analyzed the accelerometry data of 114 active community-dwelling older women using the cut-points identified from our search of the literature (eight MVPA cut-points and five sedentary time cut-points). The participants were healthy community-dwelling older women with an average age of 69.6 (2.9) years, average BMI of 26.6 (5.0), and achieved an average of 541.5 (75.03) m for the 6MWT (Table 2). Participants contributed a median 6 days of accelerometry data.
Table 2.
Participant characteristics for the accelerometer data sample of older women (N = 114)
| Measure | Mean (SD)/median (IQR) |
|---|---|
| Age, years | 69.6 (2.9) |
| Body mass index, kg/m2 | 26.6 (5.0) |
| Six-minute walk test, m | 541.5 (75.03) |
| Physical Activity Scale for the Elderly (PASE) | 120.5 (75.3 to 158.6) |
| Valid accelerometry days, days | 6 (5 to 6) |
MVPA
The eight cut-points yielded different amounts of MVPA ranging from a median of 4 to 80 min/day and between 0 and 24 min of MVPA accumulated in bouts of 10 min or greater/day (Table 3). Using Bland-Altman methods and the most common cut-point (≥1,952) as the reference, the observed differences ranged from −15 to 64 min/day. Between 4 and 95 % of participants met 30 min/day of MVPA depending on the cut-point (Table 3). Compared with the most common cut-point (≥1,952), the observed differences for accumulated bouts of MVPA ranged from −9 to 16 min/day (Table 3).
Table 3.
Minutes per day of moderate to vigorous physical activity (MVPA) based on accelerometry, for the sample data of 114 older women analyzed with the different cut-points identified by a review of the available literature
| MVPA cut-point (counts/minute) | Median minutes/day (IQR) | % (95 % CI) who met criteriaa | Mean Difference (SD) | +/− 1.96 | Median bouted min/day (IQR) | Mean Difference (SD) | +/− 1.96 |
|---|---|---|---|---|---|---|---|
| ≥574 | 80.1 (56.9 to 117.3) | 94.7 (91.6 to 98.8) | 63.75 (29.18) | 57.19 | 24.3 (6.6 to 46.4) | 15.59 (14.69) | 28.80 |
| ≥760 | 61.8 (39.9 to 88.6) | 85.1 (78.5 to 91.6) | 42.35 (21.26) | 41.66 | 17.7 (5.1 to 36.9) | 9.92 (9.64) | 18.90 |
| ≥1041 | 43.1 (25.5 to 62.0) | 64.0 (55.2 to 72.8) | 23.37 (12.88) | 25.25 | 13.9 (2.7 to 31.3) | 5.84 (6.27) | 12.29 |
| ≥1566 | 27.3 (11.7 to 44.8) | 44.7 (35.6 to 53.9) | 6.50 (4.00) | 7.85 | 10.5 (0 to 26.4) | 2.28 (3.02) | 5.92 |
| ≥1952 | 19.7 (6.9 to 35.8) | 33.3 (24.7 to 41.9) | Reference | Reference | 7.4 (0 to 23.5) | Reference | Reference |
| ≥2000 | 19.4 (6.6 to 34.8 | 31.6 (23.05 to 40.1) | −0.59 (0.48) | 0.94 | 7.1 (0 to 22.9) | −0.29 (0.76) | 1.49 |
| ≥2020 | 19.1 (6.6 to 34.6) | 31.6 (23.05 to 40.1) | −0.88 (0.69) | 1.35 | 7.1 (0 to 22.9) | −0.40 (0.90) | 1.77 |
| ≥3250 | 3.6 (0.4 to 12.9) | 4.4 (0.6 to 8.1) | −15.47 (14.09) | 27.61 | 0 (0 to 7.1) | −9.35 (13.38) | 26.22 |
The table includes median minutes of MVPA/day and mean difference (SD +/− 1.96) of different cut-points compared with the mostly frequently used cut-point (≥1,952 counts/min) based on the results from Bland-Altman methods
aRecommended minimum of 30 min average MVPA per day
Using logistic regression and age 65 to 68 years as the reference group, the odds ratios for not meeting 30 min/day of MVPA were highest for the 73 to 76 years participants and ranged from 4.32 to 5.88 depending on the cut-point used. For the 6MWT and >490 m as the reference group, the odds ratios for not meeting 30 min/day of MVPA ranged from 1.80 to 15.92 depending on the cut-point for the group who achieved less than 490 m (Table 4).
Table 4.
Odds ratios of not meeting 30 min/day of MVPA using accelerometry and different cut-points, based on age and six-minute walk test (6MWT)
| MVPA cut-point (counts/min) | ≥574 | ≥760 | ≥1,041 | ≥1,566 | ≥1,952 | ≥2,000 | ≥2,020 | ≥3,250 |
|---|---|---|---|---|---|---|---|---|
| Age groups | ||||||||
| 65 to 68 years (reference) (N = 46) | 1.00 | 1.00 | 1.00 | 1.00 | 1.00 | 1.00 | 1.00 | 1.00 |
| 69 to 72 (N = 44) | b | 1.66 | 1.65 | 1.56 | 1.80 | 1.83 | 1.83 | b |
| 73 to 76 (N = 24) | b | 4.32 | 5.30 | 4.94 | 5.88 | 5.38 | 5.38 | b |
| 6MWT scores (N = 104) a | ||||||||
| >490 m (N = 81) (reference) | 1.00 | 1.00 | 1.00 | 1.00 | 1.00 | 1.00 | 1.00 | 1.00 |
| ≤490 (N = 23) | 1.80 | 6.67 | 9.92 | 13.80 | 15.92 | 14.37 | 14.37 | b |
Relative odds of not meeting 30 minutes of moderate to vigorous physical activity (MVPA) by age and by MVPA cut-points
aRelative odds of not meeting 30 min of MVPA by age and by MVPA cut-points
bNo valid estimates calculated
Sedentary behavior
For sedentary time, the amount of time determined from cut-points ranged from 475 to 665 min/day (Table 5). Using the reported cut-points, participants from the sample group averaged 62 % to 86 % of their day in sedentary behavior, and the most common cut-point (100 counts/min) resulted in an average of 68 % sedentary time per day. Using Bland-Altman methods and the most common cut-point (>100) as the reference, the observed differences ranged from −47 to 143 min/day (Table 5).
Table 5.
Minutes per day of sedentary behavior based on accelerometry, for sample data of 114 older women with different cut-points based on a review of the available literature
| Sedentary cut-point (counts/min) | Mean of average min/day (SD) | Mean (SD) % of day spent in sedentary time | Mean difference (SD) | +/− 1.96 |
|---|---|---|---|---|
| ≤50 | 474.8 (77.2) | 61.5 (8.0) | −47.40 (11.92) | 23.35 |
| <100 | 522.2 (78.3) | 67.7 (7.8) | Reference | Reference |
| <200 | 581.2 (77.9) | 75.3 (7.4) | 58.94 (14.49) | 28.40 |
| <260 | 604.2 (76.9) | 78.5 (7.1) | 82.95 (19.54) | 38.31 |
| <500 | 665.2 (72.1) | 86.3 (5.9) | 142.98 (32.18) | 63.07 |
The table includes mean minutes of sedentary behavior per day and the mean difference (SD = +/− 1.96) of different cut-points compared with the mostly frequently used cut-point (<100 counts/min) based on the results from Bland-Altman methods
Discussion
In this systematic review, we identified 59 publications that used ActiGraph accelerometers at the waist to classify the activity patterns of older adults. Although the field is moving toward pattern recognition [67], accelerometry data analysis using cut-points remains the most common method used. We found eight cut-points used for classifying MVPA, ranging from 574 to 3,250 counts/min. We also identified five cut-points used for classifying sedentary time, ranging from 50 to 500 counts/min. This wide range of cut-points resulted in a correspondingly large range of minutes of MVPA (4 to 80 min/day) and sedentary time (62 % to 86 % of the day). We also noted that the most commonly used cut-point for MVPA (≥1,952) was able to best distinguish between participants who would likely meet the 30 min of MVPA/day based on age and results from the 6MWT. However, there were little differences between this value and cut-points within close proximity (≥1,566, ≥2,000, ≥2,020). We noted that some cut-points were distinctively different and could influence results by diminishing differences assumed to exist within groups. For example, by choosing a cut-point that is either too high or too low could either over or under estimate who meets the 30 min/day of MVPA depending on the group of older adults under investigation. Among the cut-points we analyzed, it appears that 1,566 to 2,020 counts/min (with 1,952 appearing to be the optimal) may provide the greatest differences across age groups and potentially physical capacity (6MWT). Therefore, different cut-points can substantially impact the classification of meeting recommended guidelines and the proportion of time spent in sedentary behaviors for a sample of healthy community-dwelling older adults.
Within our review of available evidence, we noted that more than half of the publications reported using the previous models [7164, 71256, and MTI (7162)] to acquire data. More recent evidence reports that the previous accelerometer models were more sensitive to movement. For example, in a 2013 article by Cain and colleagues [8], the authors noted significant differences between the older ActiGraph models and the more recent one (GT3X+). Specifically, the newer model (GT3X+) had significantly less daily step counts, more minutes of sedentary time and less light activity compared with the 7164. However, these differences were attenuated with the application of the low-frequency extension filter to the results from the newer models. Other recent studies support these findings [71, 91], and the understanding is that thresholds of the newer models were raised to overcome “noise” resulting from daily environmental vibrations. However, this higher threshold may be a limitation when measuring activity patterns of older adults who have slower gait speed and low activity patterns.
Although there is currently no consensus on the optimal cut-points for older adults, the majority of studies use the same cut-points for MVPA (1,952 counts/min) and sedentary time (100 counts/min), and this allows for comparison between the studies. However, these cut-points are not specific to older adults; the most commonly reported cut-point of 1,952 counts/min was validated in young adults [23]. Older adults may have a different capacity for activity, and their walking patterns may be altered [55] with increased energy expenditure [47, 51]. That is, for the same activity, older adults may expend more energy to complete a task compared with a fitter, younger adult. Therefore, a lower cut-point for MVPA than what is used in adult research may be appropriate due to the age related decline in fitness, if present. Ideally, individualized cut-points, which were used in one of the studies included in the review [68], would allow for the most accurate assessment of an individual’s activity level and reduce the risk of overestimating or underestimating physical activity. Individualized cut-points are not always feasible, and age specific cut-points may be an appropriate compromise for older adults, but the results will also depend on the physical capacity of the participants. For example, Copeland and colleagues’ [14] cut-point of 1,041 counts/min was developed specifically for older adults, and using this cut-point resulted in 64 % of the older women in our dataset meeting physical activity guidelines compared with 33 % meeting guidelines using the most commonly reported cut-point of 1,952 counts/min. Other investigations showed that different cut-point values result in statistically significant changes in the amount of MVPA [20] while Miller and colleagues [57] investigated the impact of age on the validity of ActiGraph accelerometers using a lab-based treadmill protocol. They found that there was no statistically significant difference across age groups for the absolute physical activity intensity. However, there was a significant difference in the relative physical activity intensity due to individual differences in cardiorespiratory and muscular fitness as a result of the aging process or physical inactivity.
The results from our analyses highlight that approximately one third of study participants were active for ≥30 min/day. This may reflect the fact that the study participants were active, community-dwelling older women and not representative of all older adults. In our review of the literature, we noted a range of physical activity results, including: a number of other studies that also reported high levels of MVPA for their study participants [30, 38] and population-based studies reporting very low values for MVPA [31]. Thus, the selection of cut-points may depend on target group and the purpose of the investigation. Using the same cut-points across all age groups may be appropriate for large epidemiological studies (that are interested in the absolute physical activity intensity), but age-specific cut-points may be necessary for physical activity prescription or when investigating the dose–response and effectiveness of interventions (where relative physical activity intensity is of interest). In addition, many recent studies have divided the MVPA category into two categories representing moderate lifestyle activity and moderate intensity physical activity. This allows for the comparison to studies using other cut-points.
We found that, for sedentary time, the range of cut-points resulted in a difference of 25 %, or over 3 h/day, which is important as older adults could spend a large proportion of their day in sedentary activities. It is promising that the majority of studies are using the same cut-points for sedentary time. However, to our knowledge, there are no studies that validated sedentary cut-points for older adults. This is an emerging area of research, and older adult specific validation is needed.
Another issue that can affect the accuracy of reported sedentary time is the ability to differentiate between non-wear time and sedentary time [94]. This is of particular concern for older adults’ accelerometry data because the large amount of time they spend in sedentary behaviors can potentially lead to the misclassification of sedentary time as non-wear time [94]. Of the included publications, 50 reported some assumptions for their data cleaning procedure to identify spurious data or non-wear time (Table 1). The most common criteria for non-wear time (24 of 50) was based on the NHANES recommended protocol for the removal of 60 min or more of continuous zeros with allowance of 1–2 min with counts between 1 and 100 [87]. More recent literature suggests 90 min may be more appropriate [12] for some older populations with limited mobility.
We note several limitations to this review. In Phase 1, we only included articles published in English and also note that with the scope of our search strategy, we may not have retrieved all studies that used accelerometry in older adults when it was not the primary outcome, or they used a different activity monitor. In addition, the included articles did not always state all of their accelerometry assumptions in their manuscript, thus making it difficult to fully assess their accelerometer protocols. The risk of bias for the included articles was not assessed as the scope of the review was specifically interested in only accelerometer related data collection and analysis, and this may not have been the primary outcome of the study. For Phase 2 of this study, we recognize that our participants were healthy, active, community-dwelling older women and did not represent all older adults, although some of the studies reviewed also included active older adults [30, 38]. Overall, the study participants were younger, and the results may not apply to older adults aged 80 years+. Due to the design of the RCT from which we sampled data, we did not include data from men in our analyses. Although we anticipate that our observed differences in outcomes based on cut-points would be similar for men, this is an area for future evaluation. Therefore, we are unable to show the implications of different cut-points for older adults of different activity or ability levels. In addition, for our analysis, we did not adjust for wear time, and this may influence the outcome, as participants who wore it longer may appear to accumulate more sedentary time. We also used 60 min of continuous zeros to determine “non-wear time.” Recent literature suggests that 90 min may be more appropriate for some older adults [12], and by limiting the sedentary time to 60 min at a given time, we may be underestimating sitting time. These are both important points and should be considered during the analysis process for the current way of data analysis. Finally, we acknowledge that we did not have a criterion measure of participants’ activity level to compare the results with and ultimately determine the optimal cut-points. However, we used the results from the 6MWT to calculate odds of not meeting 30 min/day of MVPA.
Future research in this area is promising as there are increasingly more studies being published using ActiGraph accelerometers in older adults. All of the publications identified in this review were published since 2004. Despite this growth in research utilizing accelerometers, many researchers are using a variety of different cut-points. Accelerometry is not only being used in healthy community dwelling older adults, as in the current study, but also in a variety of older specific populations (e.g., adults, older adults after stroke, or in hospital), and appropriate assumptions for these groups may need to be condition-specific. Furthermore, technological advances in device hardware and analysis software continue to evolve. With respect to analysis of data, this includes using artificial intelligence to identify activity types [67, 79]. Many of these advances are still under development, thus current practice remains in favor of using the manufacturer-provided software that allows for cut-point analysis. The monitors themselves continue to increase in memory capacity and battery life to allow for the collection of data in shorter epochs or in raw form for longer time periods as well as the addition of multiple axes.
Conclusion
In summary, our review highlights that there is not a standardized method to quantifying accelerometry-based physical activity and sedentary time in older adults. The assumptions used in data analysis of accelerometer data can produce markedly different results, and using too low or too high cut-points may obscure important group or treatment differences. For future studies, standard reporting should include specific data assumptions for analysis. Further research is needed to determine which assumptions are most appropriate for older adults, taking into account their physical capacity.
Disclosures
Conflict of interest statement
All authors declare that they have no conflict of interest.
Informed consent
All procedures followed were in accordance with the ethical standards of the responsible committee on human experimentation (institutional and national) and with the Helsinki Declaration of 1975, as revised in 2000 (5). Informed consent was obtained from all participants for being included in the study.
Footnotes
The authors declare that the submitted paper, the data, and results have not been previously published.
Ms. Gorman and Dr. Ashe made substantial contributions to the manuscript conception and design, acquisition of data, and analysis and interpretation of data. They drafted the article and revised it critically for important intellectual content. Dr. Hanson, Ms. Yang, Dr. Khan, and Dr. Liu-Ambrose made substantial contributions to the acquisition and analysis of data and revised the manuscript critically for important intellectual content. All authors have seen and approved the final version of the manuscript and all subsequent versions.
References
- 1.Ashe MC, Liu-Ambrose TY, Cooper DM, Khan KM, McKay HA. Muscle power is related to tibial bone strength in older women. Osteoporos Int. 2008;19(12):1725–1732. doi: 10.1007/s00198-008-0655-6. [DOI] [PubMed] [Google Scholar]
- 2.Aznar-Lain S, Webster AL, Canete S, San Juan AF, Lopez Mojares LM, Perez M, Lucia A, Chicharro JL. Effects of inspiratory muscle training on exercise capacity and spontaneous physical activity in elderly subjects: a randomized controlled pilot trial. Int J Sports Med. 2007;28(12):1025–1029. doi: 10.1055/s-2007-965077. [DOI] [PubMed] [Google Scholar]
- 3.Baptista F, Santos DA, Silva AM, Mota J, Santos R, Vale S, Ferreira JP, Raimundo AM, Moreira H, Sardinha LB. Prevalence of the Portuguese population attaining sufficient physical activity. Med Sci Sports Exerc. 2012;44(3):466–473. doi: 10.1249/MSS.0b013e318230e441. [DOI] [PubMed] [Google Scholar]
- 4.Bland JM, Altman DG. Statistical methods for assessing agreement between two methods of clinical measurement. Lancet. 1986;1(8476):307–310. [PubMed] [Google Scholar]
- 5.Brandon CA, Gill DP, Speechley M, Gilliland J, Jones GR. Physical activity levels of older community-dwelling adults are influenced by summer weather variables. Appl Physiol Nutr Metab. 2009;34(2):182–190. doi: 10.1139/H09-004. [DOI] [PubMed] [Google Scholar]
- 6.Buman MP, Hekler EB, Haskell WL, Pruitt L, Conway TL, Cain KL, Sallis JF, Saelens BE, Frank LD, King AC. Objective light-intensity physical activity associations with rated health in older adults. Am J Epidemiol. 2010;172(10):1155–1165. doi: 10.1093/aje/kwq249. [DOI] [PMC free article] [PubMed] [Google Scholar]
- 7.Butland RJ, Pang J, Gross ER, Woodcock AA, Geddes DM. Two-, six-, and 12-minute walking tests in respiratory disease. Br Med J. 1982;284(6329):1607–1608. doi: 10.1136/bmj.284.6329.1607. [DOI] [PMC free article] [PubMed] [Google Scholar]
- 8.Cain KL, Conway TL, Adams MA, Husak LE, Sallis JF. Comparison of older and newer generations of ActiGraph accelerometers with the normal filter and the low frequency extension. Int J Behav Nutr Phys Act. 2013;10:51. doi: 10.1186/1479-5868-10-51. [DOI] [PMC free article] [PubMed] [Google Scholar]
- 9.Camhi SM, Sisson SB, Johnson WD, Katzmarzyk PT, Tudor-Locke C. Accelerometer-determined lifestyle activities in U.S. adults. J Phys Act Health. 2011;8(3):382–389. doi: 10.1123/jpah.8.3.382. [DOI] [PubMed] [Google Scholar]
- 10.Cerin E, Barnett A, Sit CH, Cheung MC, Lee LC, Ho SY, Chan WM. Measuring walking within and outside the neighborhood in Chinese elders: reliability and validity. BMC Publ Health. 2011;11:851. doi: 10.1186/1471-2458-11-851. [DOI] [PMC free article] [PubMed] [Google Scholar]
- 11.Chen KY, Bassett DR., Jr The technology of accelerometry-based activity monitors: current and future. Med Sci Sports Exerc. 2005;37(11 Suppl):S490–s500. doi: 10.1249/01.mss.0000185571.49104.82. [DOI] [PubMed] [Google Scholar]
- 12.Choi L, Ward SC, Schnelle JF, Buchowski MS. Assessment of wear/nonwear time classification algorithms for triaxial accelerometer. Med Sci Sports Exerc. 2012;44(10):2009–2016. doi: 10.1249/MSS.0b013e318258cb36. [DOI] [PMC free article] [PubMed] [Google Scholar]
- 13.Clark BK, Healy GN, Winkler EA, Gardiner PA, Sugiyama T, Dunstan DW, Matthews CE, Owen N. Relationship of television time with accelerometer-derived sedentary time: NHANES. Med Sci Sports Exerc. 2011;43(5):822–828. doi: 10.1249/MSS.0b013e3182019510. [DOI] [PMC free article] [PubMed] [Google Scholar]
- 14.Copeland JL, Esliger DW. Accelerometer assessment of physical activity in active, healthy older adults. J Aging Phys Act. 2009;17(1):17–30. doi: 10.1123/japa.17.1.17. [DOI] [PubMed] [Google Scholar]
- 15.Davis M, Fox K. Physical activity patterns assessed by accelerometry in older people. Eur J Appl Physiol. 2007;100(5):581–589. doi: 10.1007/s00421-006-0320-8. [DOI] [PubMed] [Google Scholar]
- 16.Davis MG, Fox KR, Hillsdon M, Coulson JC, Sharp DJ, Stathi A, Thompson JL (2011) Getting out and about in older adults: the nature of daily trips and their association with objectively assessed physical activity. IJBNPA 8(116) [DOI] [PMC free article] [PubMed]
- 17.Davis MG, Fox KR, Hillsdon M, Sharp DJ, Coulson JC, Thompson JL. Objectively measured physical activity in a diverse sample of older urban UK adults. Med Sci Sports Exerc. 2011;43(4):647–654. doi: 10.1249/MSS.0b013e3181f36196. [DOI] [PubMed] [Google Scholar]
- 18.R Development Core Team (2012) R: a language and environment for statistical computing. R Foundation for Statistical Computing, Vienna, Austria http://wwwR-projectorg
- 19.Esliger DW, Copeland JL, Barnes JD, Tremblay MS. Standardizing and optimizing the use of accelerometer data for free-living physical activity monitoring. J Phys Act Health. 2005;2(3):366. [Google Scholar]
- 20.Evenson KR, Buchner DM, Morland KB. Objective measurement of physical activity and sedentary behavior among US adults aged 60 years or older. Prev Chronic Dis. 2012;9:E26. [PMC free article] [PubMed] [Google Scholar]
- 21.Fox KR, Hillsdon M, Sharp D, Cooper AR, Coulson JC, Davis M, Harris R, McKenna J, Narici M, Stathi A, Thompson JL. Neighbourhood deprivation and physical activity in UK older adults. Health Place. 2011;17(2):633–640. doi: 10.1016/j.healthplace.2011.01.002. [DOI] [PubMed] [Google Scholar]
- 22.Fox K, Stathi A, McKenna J, Davis M. Physical activity and mental well-being in older people participating in the Better Ageing Project. Eur J Appl Physiol. 2007;100(5):591–602. doi: 10.1007/s00421-007-0392-0. [DOI] [PubMed] [Google Scholar]
- 23.Freedson PS, Melanson E, Sirard J. Calibration of the Computer Science and Applications, Inc. accelerometer. Med Sci Sports Exerc. 1998;30(5):777–781. doi: 10.1097/00005768-199805000-00021. [DOI] [PubMed] [Google Scholar]
- 24.Gaba A, Kapus O, Pelclova J, Riegerova J. The relationship between accelerometer-determined physical activity (PA) and body composition and bone mineral density (BMD) in postmenopausal women. Arch Gerontol Geriatr. 2012;54(3):e315–e321. doi: 10.1016/j.archger.2012.02.001. [DOI] [PubMed] [Google Scholar]
- 25.Gardiner PA, Clark BK, Healy GN, Eakin EG H, Owen N. Measuring older adults’ sedentary time: reliability, validity, and responsiveness. Med Sci Sports Exerc. 2011;43(11):2127–2133. doi: 10.1249/MSS.0b013e31821b94f7. [DOI] [PubMed] [Google Scholar]
- 26.Gardiner PA, Eakin EG, Healy GN, Owen N. Feasibility of reducing older adults’ sedentary time. Am J Prev Med. 2011;41(2):174–177. doi: 10.1016/j.amepre.2011.03.020. [DOI] [PubMed] [Google Scholar]
- 27.Gerdhem P, Dencker M, Ringsberg K, Åkesson K. Accelerometer-measured daily physical activity among octogenerians: results and associations to other indices of physical performance and bone density. Eur J Appl Physiol. 2008;102(2):173–180. doi: 10.1007/s00421-007-0571-z. [DOI] [PubMed] [Google Scholar]
- 28.Gonzales JU, Grinnell DM, Kalasky MJ, Proctor DN. Sex-dependent associations between daily physical activity and leg exercise blood pressure responses. J Aging Phys Act. 2011;19(4):306–321. doi: 10.1123/japa.19.4.306. [DOI] [PubMed] [Google Scholar]
- 29.Grimm EK, Swartz AM, Hart T, Miller NE, Strath SJ. Comparison of the IPAQ-short form and accelerometry predictions of physical activity in older adults. J Aging Phys Act. 2012;20(1):67–79. doi: 10.1123/japa.20.1.64. [DOI] [PubMed] [Google Scholar]
- 30.Hagstromer M, Oja P, Sjostrom M. Physical activity and inactivity in an adult population assessed by accelerometry. Med Sci Sports Exerc. 2007;39(9):1502–1508. doi: 10.1249/mss.0b013e3180a76de5. [DOI] [PubMed] [Google Scholar]
- 31.Hagströmer M, Troiano RP, Sjöström M, Berrigan D. Levels and patterns of objectively assessed physical activity—a comparison between Sweden and the United States. Am J Epidemiol. 2010;171(10):1055–1064. doi: 10.1093/aje/kwq069. [DOI] [PubMed] [Google Scholar]
- 32.Ham SA, Ainsworth BE. Disparities in data on Healthy People 2010 physical activity objectives collected by accelerometry and self-report. Am J Public Health. 2010;100(Suppl 1):S263–268. doi: 10.2105/AJPH.2009.180075. [DOI] [PMC free article] [PubMed] [Google Scholar]
- 33.Hamer M, Venuraju SM, Lahiri A, Rossi A, Steptoe A. Objectively assessed physical activity, sedentary time, and coronary artery calcification in healthy older adults. Arterioscler Thromb Vasc Biol. 2012;32(2):500–505. doi: 10.1161/ATVBAHA.111.236877. [DOI] [PubMed] [Google Scholar]
- 34.Hansen BH, Kolle E, Dyrstad SM, Holme I, Anderssen SA. Accelerometer-determined physical activity in adults and older people. Med Sci Sports Exerc. 2012;44(2):266–272. doi: 10.1249/MSS.0b013e31822cb354. [DOI] [PubMed] [Google Scholar]
- 35.Harris TJ, Owen CG, Victor CR, Adams R, Cook DG. What factors are associated with physical activity in older people, assessed objectively by accelerometry? Br J Sports Med. 2009;43(6):442–450. doi: 10.1136/bjsm.2008.048033. [DOI] [PubMed] [Google Scholar]
- 36.Hart TL, Ainsworth BE, Tudor-Locke C. Objective and subjective measures of sedentary behavior and physical activity. Med Sci Sports Exerc. 2011;43(3):449–456. doi: 10.1249/MSS.0b013e3181ef5a93. [DOI] [PubMed] [Google Scholar]
- 37.Hekler EB, Buman MP, Haskell WL, Conway TL, Cain KL, Sallis JF, Saelens BE, Frank LD, Kerr J, King AC. Reliability and validity of CHAMPS self-reported sedentary-to-vigorous intensity physical activity in older adults. J Phys Act Health. 2012;9(2):225–236. doi: 10.1123/jpah.9.2.225. [DOI] [PMC free article] [PubMed] [Google Scholar]
- 38.Hurtig-Wennlof A, Hagstromer M, Olsson LA. The International Physical Activity Questionnaire modified for the elderly: aspects of validity and feasibility. Publ Health Nutr. 2010;13(11):1847–1854. doi: 10.1017/S1368980010000157. [DOI] [PubMed] [Google Scholar]
- 39.Johannsen DL, Delany JP, Frisard MI, Welsch MA, Rowley CK, Fang X, Jazwinski SM, Ravussin E. Physical activity in aging: comparison among young, aged, and nonagenarian individuals. J Appl Physiol. 2008;105(2):495–501. doi: 10.1152/japplphysiol.90450.2008. [DOI] [PMC free article] [PubMed] [Google Scholar]
- 40.Jürimäe J, Kums T, Jürimäe T. Plasma adiponectin concentration is associated with the average accelerometer daily steps counts in healthy elderly females. Eur J Appl Physiol. 2010;109(5):823–828. doi: 10.1007/s00421-010-1423-9. [DOI] [PubMed] [Google Scholar]
- 41.Kang M, Rowe DA, Barreira TV, Robinson TS, Mahar MT. Individual information-centered approach for handling physical activity missing data. Res Q Exerc Sport. 2009;80(2):131–137. doi: 10.1080/02701367.2009.10599546. [DOI] [PubMed] [Google Scholar]
- 42.King WC, Jia L, Leishear K, Mitchell JE, Belle SH. Determining activity monitor wear time: an influential decision rule. J Phys Act Health. 2011;8(4):566–580. doi: 10.1123/jpah.8.4.566. [DOI] [PMC free article] [PubMed] [Google Scholar]
- 43.Kolbe-Alexander T, Lambert EV, Harkins JB, Ekelund U. Comparison of two methods of measuring physical activity in South African older adults. J Aging Phys Act. 2006;14(1):98–114. doi: 10.1123/japa.14.1.98. [DOI] [PubMed] [Google Scholar]
- 44.Koster A, Caserotti P, Patel KV, Matthews CE, Berrigan D, van Domelen DR, Brychta RJ, Chen KY, Harris TB (2012) Association of sedentary time with mortality independent of moderate to vigorous physical activity. PLoS One 7(6) [DOI] [PMC free article] [PubMed]
- 45.Liberati A, Altman DG, Tetzlaff J, Mulrow C, Gotzsche PC, Ioannidis JP, Clarke M, Devereaux PJ, Kleijnen J, Moher D. The PRISMA statement for reporting systematic reviews and meta-analyses of studies that evaluate healthcare interventions: explanation and elaboration. BMJ. 2009;339:b2700. doi: 10.1136/bmj.b2700. [DOI] [PMC free article] [PubMed] [Google Scholar]
- 46.Liu-Ambrose T, Nagamatsu LS, Graf P, Beattie BL, Ashe MC, Handy TC (2010) Resistance training and executive functions a 12-month randomized controlled trial. Arch Intern Med 170(2):170–178 [DOI] [PMC free article] [PubMed]
- 47.Malatesta D, Simar D, Dauvilliers Y, Candau R, Borrani F, Prefaut C, Caillaud C. Energy cost of walking and gait instability in healthy 65- and 80-yr-olds. J Appl Physiol. 2003;95(6):2248–2256. doi: 10.1152/japplphysiol.01106.2002. [DOI] [PubMed] [Google Scholar]
- 48.Marques EA, Mota J, Machado L, Sousa F, Coelho M, Moreira P, Carvalho J. Multicomponent training program with weight-bearing exercises elicits favorable bone density, muscle strength, and balance adaptations in older women. Calcif Tissue Int. 2011;88(2):117–129. doi: 10.1007/s00223-010-9437-1. [DOI] [PubMed] [Google Scholar]
- 49.Marques EA, Wanderley F, Machado L, Sousa F, Viana JL, Moreira-Goncalves D, Moreira P, Mota J, Carvalho J. Effects of resistance and aerobic exercise on physical function, bone mineral density, OPG and RANKL in older women. Exp Gerontol. 2011;46(7):524–532. doi: 10.1016/j.exger.2011.02.005. [DOI] [PubMed] [Google Scholar]
- 50.Marquez DX, Hoyem R, Fogg L, Bustamante EE, Staffileno B, Wilbur J. Physical activity of urban community-dwelling older Latino adults. J Phys Act Health. 2011;8:S161–S170. doi: 10.1123/jpah.8.s2.s161. [DOI] [PubMed] [Google Scholar]
- 51.Martin PE, Rothstein DE, Larish DD. Effects of age and physical activity status on the speed-aerobic demand relationship of walking. J Appl Physiol. 1992;73(1):200–206. doi: 10.1152/jappl.1992.73.1.200. [DOI] [PubMed] [Google Scholar]
- 52.Masse LC, Fuemmeler BF, Anderson CB, Matthews CE, Trost SG, Catellier DJ, Treuth M. Accelerometer data reduction: a comparison of four reduction algorithms on select outcome variables. Med Sci Sports Exerc. 2005;37(11 Suppl):S544–554. doi: 10.1249/01.mss.0000185674.09066.8a. [DOI] [PubMed] [Google Scholar]
- 53.Matthews CE. Calibration of accelerometer output for adults. Med Sci Sports Exerc. 2005;37(11 Suppl):S512–s522. doi: 10.1249/01.mss.0000185659.11982.3d. [DOI] [PubMed] [Google Scholar]
- 54.Matthews CE. Physical activity in the United States measured by accelerometer: comment. Med Sci Sports Exerc. 2008;40(6):1188–1188. doi: 10.1249/MSS.0b013e31817057da. [DOI] [PubMed] [Google Scholar]
- 55.McGibbon CA, Krebs DE. Age-related changes in lower trunk coordination and energy transfer during gait. J Neurophysiol. 2001;85(5):1923–1931. doi: 10.1152/jn.2001.85.5.1923. [DOI] [PubMed] [Google Scholar]
- 56.Metzger JS, Catellier DJ, Evenson KR, Treuth MS, Rosamond WD, Siega-Riz AM. Patterns of objectively measured physical activity in the United States. Med Sci Sports Exerc. 2008;40(4):630–638. doi: 10.1249/MSS.0b013e3181620ebc. [DOI] [PubMed] [Google Scholar]
- 57.Miller NE, Strath SJ, Swartz AM, Cashin SE. Estimating absolute and relative physical activity intensity across age via accelerometry in adults. J Aging Phys Activ. 2010;18(2):158–170. doi: 10.1123/japa.18.2.158. [DOI] [PMC free article] [PubMed] [Google Scholar]
- 58.Morse CI, Thom JM, Davis MG, Fox KR, Birch KM, Narici MV. Reduced plantarflexor specific torque in the elderly is associated with a lower activation capacity. Eur J Appl Physiol. 2004;92(1–2):219–226. doi: 10.1007/s00421-004-1056-y. [DOI] [PubMed] [Google Scholar]
- 59.Murphy SL. Review of physical activity measurement using accelerometers in older adults: considerations for research design and conduct. Prev Med. 2009;48(2):108–114. doi: 10.1016/j.ypmed.2008.12.001. [DOI] [PMC free article] [PubMed] [Google Scholar]
- 60.Nelson ME, Rejeski WJ, Blair SN, Duncan PW, Judge JO, King AC, Macera CA, Castaneda-Sceppa C. Physical activity and public health in older adults: recommendation from the American College of Sports Medicine and the American Heart Association. Circulation. 2007;116(9):1094–1105. doi: 10.1161/CIRCULATIONAHA.107.185650. [DOI] [PubMed] [Google Scholar]
- 61.Orsini N, Bellocco R, Bottai M, Hagstromer M, Sjostrom M, Pagano M, Wolk A. Validity of self-reported total physical activity questionnaire among older women. Eur J Epidemiol. 2008;23(10):661–667. doi: 10.1007/s10654-008-9273-z. [DOI] [PubMed] [Google Scholar]
- 62.Orsini N, Bellocco R, Bottai M, Hagströmer M, Sjöström M, Pagano M, Wolk A. Profile of physical activity behaviors among Swedish women aged 56–75 years. Scand J Med Sci Sports. 2008;18(1):95–101. doi: 10.1111/j.1600-0838.2006.00624.x. [DOI] [PubMed] [Google Scholar]
- 63.Parker SJ, Strath SJ, Swartz AM. Physical activity measurement in older adults: relationships with mental health. J Aging Phys Activ. 2008;16(4):369–380. doi: 10.1123/japa.16.4.369. [DOI] [PMC free article] [PubMed] [Google Scholar]
- 64.Pate RR, O’Neill JR, Lobelo F. The evolving definition of "sedentary". Exerc Sport Sci Rev. 2008;36(4):173–178. doi: 10.1097/JES.0b013e3181877d1a. [DOI] [PubMed] [Google Scholar]
- 65.Pelclová J, Gába A, Kapuš O. Bone mineral density and accelerometer-determined habitual physical activity and inactivity in postmenopausal women. Acta Univ Palacki Olomuc Gymnica. 2011;41(3):47–53. [Google Scholar]
- 66.Peters TM, Moore SC, Xiang YB, Yang G, Shu XO, Ekelund U, Ji BT, Tan YT, Liu DK, Schatzkin A, Zheng W, Chow WH, Matthews CE, Leitzmann MF. Accelerometer-measured physical activity in Chinese adults. Am J Prev Med. 2010;38(6):583–591. doi: 10.1016/j.amepre.2010.02.012. [DOI] [PMC free article] [PubMed] [Google Scholar]
- 67.Pober DM, Staudenmayer J, Raphael C, Freedson PS. Development of novel techniques to classify physical activity mode using accelerometers. Med Sci Sports Exerc. 2006;38(9):1626–1634. doi: 10.1249/01.mss.0000227542.43669.45. [DOI] [PubMed] [Google Scholar]
- 68.Pruitt LA, Glynn NW, King AC, Guralnik JM, Aiken EK, Miller G, Haskell WL. Use of accelerometry to measure physical activity in older adults at risk for mobility disability. J Aging Phys Act. 2008;16(4):416–434. doi: 10.1123/japa.16.4.416. [DOI] [PMC free article] [PubMed] [Google Scholar]
- 69.Pulz C, Diniz RV, Alves AN, Tebexreni AS, Carvalho AC, de Paola AA, Almeida DR. Incremental shuttle and six-minute walking tests in the assessment of functional capacity in chronic heart failure. Can J Cardiol. 2008;24(2):131–135. doi: 10.1016/s0828-282x(08)70569-5. [DOI] [PMC free article] [PubMed] [Google Scholar]
- 70.Reilly JJ, Penpraze V, Hislop J, Davies G, Grant S, Paton JY. Objective measurement of physical activity and sedentary behaviour: review with new data. Arch Dis Child. 2008;93(7):614–619. doi: 10.1136/adc.2007.133272. [DOI] [PubMed] [Google Scholar]
- 71.Ried-Larsen M, Brond JC, Brage S, Hansen BH, Grydeland M, Andersen LB, Moller NC. Mechanical and free living comparisons of four generations of the Actigraph activity monitor. Int J Behav Nutr Phys Act. 2012;9:113. doi: 10.1186/1479-5868-9-113. [DOI] [PMC free article] [PubMed] [Google Scholar]
- 72.Rikli RE. Reliability, validity, and methodological issues in assessing physical activity in older adults. Res Q Exerc Sport. 2000;71(2 Suppl):S89–96. [PubMed] [Google Scholar]
- 73.Rowe DA, Kemble CD, Robinson TS, Mahar MT. Daily walking in older adults: day-to-day variability and criterion-referenced validity of total daily step counts. J Phys Act Health. 2007;4(4):434–446. [PubMed] [Google Scholar]
- 74.Sallis JF, Saelens BE. Assessment of physical activity by self-report: status, limitations, and future directions. Res Q Exerc Sport. 2000;71(2 Suppl):S1–14. [PubMed] [Google Scholar]
- 75.Santos DA, Silva AM, Baptista F, Santos R, Gobbo LA, Mota J, Sardinha LB. Are cardiorespiratory fitness and moderate-to-vigorous physical activity independently associated to overweight, obesity, and abdominal obesity in elderly? Am J Hum Biol. 2012;24(1):28–34. doi: 10.1002/ajhb.21231. [DOI] [PubMed] [Google Scholar]
- 76.Sedentary Behaviour Research Network Letter to the editor: standardized use of the terms "sedentary" and "sedentary behaviours". Appl Physiol Nutr Metab. 2012;37(3):540–542. doi: 10.1139/h2012-024. [DOI] [PubMed] [Google Scholar]
- 77.Silva P, Aires L, Santos RM, Vale S, Welk G, Mota J. Lifespan snapshot of physical activity assessed by accelerometry in Porto. J Phys Act Health. 2011;8(3):352–360. doi: 10.1123/jpah.8.3.352. [DOI] [PubMed] [Google Scholar]
- 78.Stamatakis E, Davis M, Stathi A, Hamer M. Associations between multiple indicators of objectively-measured and self-reported sedentary behaviour and cardiometabolic risk in older adults. Prev Med. 2012;54(1):82–87. doi: 10.1016/j.ypmed.2011.10.009. [DOI] [PubMed] [Google Scholar]
- 79.Staudenmayer J, Pober D, Crouter S, Bassett D, Freedson P. An artificial neural network to estimate physical activity energy expenditure and identify physical activity type from an accelerometer. J Appl Physiol. 2009;107(4):1300–1307. doi: 10.1152/japplphysiol.00465.2009. [DOI] [PMC free article] [PubMed] [Google Scholar]
- 80.Strath SJ, Greenwald MJ, Isaacs R, Hart TL, Lenz EK, Dondzila CJ, Swartz AM. Measured and perceived environmental characteristics are related to accelerometer defined physical activity in older adults. Int J Behav Nutr Phys Act. 2012;9(40):40. doi: 10.1186/1479-5868-9-40. [DOI] [PMC free article] [PubMed] [Google Scholar]
- 81.Strath SJ, Holleman RG, Ronis DL, Swartz AM, Richardson CR. Objective physical activity accumulation in bouts and nonbouts and relation to markers of obesity in US adults. Prev Chron Dis. 2008;5(4):A131. [PMC free article] [PubMed] [Google Scholar]
- 82.Swartz AM, Tarima S, Miller NE, Hart TL, Grimm EK, Rote AE, Strath SJ. Prediction of body fat in older adults by time spent in sedentary behavior. J Aging Phys Act. 2012;20(3):332–344. doi: 10.1123/japa.20.3.332. [DOI] [PubMed] [Google Scholar]
- 83.Taraldsen K, Chastin SF, Riphagen II, Vereijken B, Helbostad JL. Physical activity monitoring by use of accelerometer-based body-worn sensors in older adults: a systematic literature review of current knowledge and applications. Maturitas. 2012;71(1):13–19. doi: 10.1016/j.maturitas.2011.11.003. [DOI] [PubMed] [Google Scholar]
- 84.Theou O, Jakobi JM, Vandervoort AA, Jones GR. A comparison of physical activity (PA) assessment tools across levels of frailty. Arch Gerontol Geriatr. 2012;54(3):e307–314. doi: 10.1016/j.archger.2011.12.005. [DOI] [PubMed] [Google Scholar]
- 85.Thorp AA, Owen N, Neuhaus M, Dunstan DW. Sedentary behaviors and subsequent health outcomes in adults a systematic review of longitudinal studies, 1996–2011. Am J Prev Med. 2011;41(2):207–215. doi: 10.1016/j.amepre.2011.05.004. [DOI] [PubMed] [Google Scholar]
- 86.Tremblay MS, Warburton DE, Janssen I, Paterson DH, Latimer AE, Rhodes RE, Kho ME, Hicks A, Leblanc AG, Zehr L, Murumets K, Duggan M. New Canadian physical activity guidelines. Appl Physiol Nutr Metab. 2011;36(1):36–46. doi: 10.1139/H11-009. [DOI] [PubMed] [Google Scholar]
- 87.Troiano RP, Berrigan D, Dodd KW, Mâsse LC, Tilert T, McDowell M. Physical activity in the United States measured by accelerometer. Med Sci Sports Exerc. 2008;40(1):181–188. doi: 10.1249/mss.0b013e31815a51b3. [DOI] [PubMed] [Google Scholar]
- 88.Trost SG, McIver KL, Pate RR. Conducting accelerometer-based activity assessments in field-based research. Med Sci Sports Exerc. 2005;37(11 Suppl):S531–543. doi: 10.1249/01.mss.0000185657.86065.98. [DOI] [PubMed] [Google Scholar]
- 89.Tucker JM, Welk G, Nusser SM, Beyler NK, Dzewaltowski D. Estimating minutes of physical activity from the previous day physical activity recall: validation of a prediction equation. J Phys Act Health. 2011;8(1):71–78. doi: 10.1123/jpah.8.1.71. [DOI] [PubMed] [Google Scholar]
- 90.U.S. Department of Health and Human Services (2008) 2008 Physical activity guidelines for Americans; www.health.gov/paguidelines
- 91.Wanner M, Martin BW, Meier F, Probst-Hensch N, Kriemler S. Effects of filter choice in GT3X accelerometer assessments of free-living activity. Med Sci Sports Exerc. 2013;45(1):170–177. doi: 10.1249/MSS.0b013e31826c2cf1. [DOI] [PubMed] [Google Scholar]
- 92.Washburn RA, Heath GW, Jackson AW. Reliability and validity issues concerning large-scale surveillance of physical activity. Res Q Exerc Sport. 2000;71(2 Suppl):S104–113. [PubMed] [Google Scholar]
- 93.Washburn RA, Smith KW, Jette AM, Janney CA. The Physical Activity Scale for the Elderly (PASE): development and evaluation. J Clin Epidemiol. 1993;46(2):153–162. doi: 10.1016/0895-4356(93)90053-4. [DOI] [PubMed] [Google Scholar]
- 94.Winkler EA, Gardiner PA, Clark BK, Matthews CE, Owen N, Healy GN. Identifying sedentary time using automated estimates of accelerometer wear time. Br J Sports Med. 2011 doi: 10.1136/bjsm.2010.079699. [DOI] [PMC free article] [PubMed] [Google Scholar]
- 95.Winkler EA, Gardiner PA, Clark BK, Matthews CE, Owen N, Healy GN. Identifying sedentary time using automated estimates of accelerometer wear time. Brit J Sports Med. 2012;46(6):436–442. doi: 10.1136/bjsm.2010.079699. [DOI] [PMC free article] [PubMed] [Google Scholar]
- 96.Zhang FF, Cardarelli R, Carroll J, Zhang S, Fulda KG, Gonzalez K, Vishwanatha JK, Morabia A, Santella RM. Physical activity and global genomic DNA methylation in a cancer-free population. Epigenetics: Off J DNA Methylation Soc. 2011;6(3):293–299. doi: 10.4161/epi.6.3.14378. [DOI] [PMC free article] [PubMed] [Google Scholar]