

Abstract
Objective
Neural stem cells (NSCs) are playing an increasing clinical role for stroke. However at present, it is not yet possible to non-invasively monitor their differentiation once implanted into the brain.
Methods
We here describe the use of high-resolution 1H-magnetic resonance spectroscopy (MRS) to define a metabolite profile of undifferentiated human striatal NSCs from the STROC05 cell line and their differentiation after 3 weeks of treatment with purmorphamine.
Results
The undifferentiated conditions were characterized by ∼95% of cells expressing nestin and ∼77% being Ki67+, indicating that these were still proliferating. Phosphophocholine+glycerophosphocholine (PC+GPC) was increased in these cells, as well as myo-Inositol (mI). PC+GPC and mI were dramatically reduced upon differentiation, potentially serving as markers of the NSC state. Upon differentiation (∼45% neurons, ∼30% astrocytes, ∼13% oligodendrocytes), the concentration of many metabolites decreased in absolute value. The decreasing trend of the N-acetyl-aspartate (NAA) level was observed in differentiated cells when compared to NSCs. An increase in plasmalogen (enriched in myelin sheets) could potentially serve as a marker of oligodendrocytes.
Conclusion
These metabolite characteristics of undifferentiated and differentiated NSCs provide a basis for exploring their possible use as markers of differentiation after cell transplantation.
Keywords: Neural Stem Cell, 1H-Magnetic Resonance Spectroscopy, Purmorphamine, DARPP-32, Neuronal Differentiation, Metabolites, Striatum, Ganglionic Eminence, human
Introduction
Neural stem cells (NSCs) are gradually emerging as a therapeutic tool with a developing clinical translation. However, the in vivo monitoring of transplanted cells remains a major challenge [1]. Tracking of cells by cellular MRI that relies on tagging the cells prior to injection with MRI contrast agents is feasible and has found specific applications in a clinical setting [2]. Although this approach can indicate the location of transplanted cells by using the MRI contrast agent as a surrogate marker of cell location, it is not possible to determine the cells differentiation status.
Neural stem cells differentiate into neurons, astrocytes and oligodendrocytes. However, after implantation a significant proportion of cells also do not express mature phenotypic markers, despite having ceased to proliferate. One potential approach to address this currently unmet monitoring need is to implement 1H-magnetic resonance spectroscopy (MRS). 1H-high-resolution MRS can determine in vitro a particular metabolic profile of cell extracts [3] and afford a distinction, for instance, between neurons and glia, as well as differentiating them from brain tumor cells [4]. Distinguishing NSCs from brain tumor cells is also potentially an important aspect of monitoring the safety of cell transplantation. Manganas et al. [5] have suggested a specific metabolite marker to identify exogenous or endogenous neural stem cells (e.g. a peak at 1.28 ppm), which would be desirable, although alternative explanations of this marker have emerged [6-8].
To monitor the phenotypic differentiation of NSCs, it is essential to establish the metabolite profile present in these cells while in proliferative, yet undifferentiated conditions, as well as in their post-mitotic differentiated state. Jansen et al.[9], for instance, have profiled changes in mouse embryonic stem (ES) cells during neuralization to NSCs. ES cells were characterized by an overall low level of metabolites with non-detectable glycerophosphocholine (GPC) levels, but a high content of phosphocholine (PC). NSCs were found to exhibit a profile akin to glial cells with higher PC, GPC and myo-inositol (mI). As the metabolite profile is dependent on the developmental stage, as well as its regional source from the brain, it is hence important to clearly define the cellular characteristics of the investigated cells. To our knowledge, this is the first report on the metabolic characterizations of undifferentiated and differentiated human neural stem cells (hNSCs).
Methods
Striatal human neural stem cell (hNSC) line
The cmyc-ERTAM conditionally immortalized striatal hNSC line (STROC05, ReNeuron), was previously described by Johansson et al. [10]. In brief, STROC05 cells were isolated from the whole ganglionic eminence of a 12 weeks' old human fetal brain, expanded on laminin-coated culture dishes, and transfected with the retroviral vector pLNCX-2 (Clontech) encoding the cmyc-ERTAM gene. Transfected cell colonies were isolated following neomycin selection before being expanded into a clonal cell line [11]. To maintain proliferation through the conditional immortalization gene, 4-hydroxy-tamoxifen (4-OHT; 100 nM/ml; Sigma-Aldrich) was added to all undifferentiated media.
Expansion of undifferentiated STROC05 cells
Cells were expanded in culture flasks (Falcon) coated with mouse laminin at a concentration of 1:100 (mouse, 10 μg/ml; Trevigen) at a seeding density of 2.5x10⁶ cells/flask. Every 2 days, cells were passaged at 90% confluency and medium was completely replaced. To stimulate proliferation, basic fibroblast growth factor (bFGF; 10 ng/ml) and epidermal growth factor (EGF; 20 ng/ml) (Peprotech) were added to the media (Suppl. Table 1).
Long-term differentiation of hNSCs
STROC05 cells differentiate spontaneously into appropriate striatal phenotypes over 3 weeks of differentiation. However, neuronal yield and differentiation into the lateral ganglionic eminence (LGE)-derived GABAergic output neurons is low. To increase neuronal yield and specifically produce more DARPP-32 cells, purmorphamine was added here to the differentiation condition [12]. As described in El Akabawy et al. [12], long-term cultures were exposed to purmorphamine for 3 weeks. To ensure a long-term attachment, cells were seeded at a density of 2.5x10⁶ cell/flask onto laminin and poly-L-lysine (PLL, 100 ug/ml, Sigma). Cells were grown to 90% confluency before initiation of the differentiation protocol. For the first week of differentiation, media was identical to that of undifferentiated cells (Suppl. Table 2) with the exception of bFGF, EGF and tamoxifan omitted from the media.
Dual-Phase Extraction
From each culture vessel, 1 ml of the supernatant was stored at -80°C. Cells were harvested by incubation with Trypzean EDTA (Sigma) for less than five minutes at 37°C, followed by addition of soybean trypsin inhibitor to inactivate the enzymatic activity. After harvesting, cells were centrifuged for 5 minutes at 1500 rpm, and the cell pellet was re-suspended in 1 ml ice cold phosphate buffered saline (PBS). Cells were counted and their viability was assessed using the trypan blue exclusion test. 107 cells of each sample were then centrifuged for 5 minutes at 1500 rpm, and the cell pellets were re-suspended in 2ml ice-cold methanol. Then, 2ml of ice-cold chloroform were added to each tube and vortexed for 30 seconds, followed by addition of 2 ml of ice-cold de-ionised water into each tube, and vortexed again for another 30 seconds. Samples were centrifuged (4°C) at approx. 4600 rpm for 20 minutes for phase separation. The water-methanol and lipid phases, as well as the protein layer, were carefully separated and kept at -80°C. Prior to storage the water-methanol layers were pre-treated with Chelex 100 (1 mg/ml) to remove divalent ions.
High-Resolution 1H-Magnetic Resonance Spectroscopy
The methanol-water fraction (containing water soluble metabolites) was freeze-dried and reconstituted in 580 μl deuterated water (D2O, Sigma). 20 μl of 0.75% sodium 3-trimethylsilyl-2,2,3,3-tetradeuteropropionate (TSP) in D2O (Sigma) was added to the samples for chemical shift calibration and quantification. 500 μl of the reconstituted extracts were then placed in 5 mm NMR tubes (Apollo Scientific). Lipid extracts were dried and then reconstituted in 450 μl deuterated chloroform (Sigma) and 150 μl of 0.1% tetramethylsilane in deuterated chloroform (Sigma) was added to the samples for chemical shift calibration and quantification. Media from the cultured cells were also analyzed by 1H-MRS. 500 μl of the media sample and 50 μl of D2O were placed in the NMR tube. 50 μl of 0.75% TSP in D2O was added to the samples for chemical shift calibration and quantification. Spectral assignments were based on literature values [13,14]. Metabolite uptake and excretion levels in undifferentiated and differentiated cells were evaluated relative to its own respective starting media.
1H-MRS measurements were performed on a 500 MHz spectrometer (Bruker). Pulse angle of 45°, repetition time of 2 seconds, spectral width of 7500Hz, 128 averages, temperature of 298K, acquisition time approximately 5 minutes. The water resonance was suppressed by a gated irradiation centered on the water frequency. Spectral processing was carried out using the Topspin-2 software package.
Statistics
One–tailed Mann-Whitney tests were used to compare data from undifferentiated and differentiated cells. Statistical significance was set at p<0.05. In vitro cell culture studies consisted of 3 biological replicates, each consisting of 3 technical replicates. 1H-MRS results consisted of 4 biological replicates with viability measurements, as well as passage number recorded for each.
Results
Neuronal Differentiation of human striatal neural stem cells
Human neural stem cells (hNSCs) from the STROC05 cell line were differentiated for 3 weeks by addition of purmorphamine. In comparison to undifferentiated cells, markers of NSCs, such as nestin, and proliferation, such as Ki67, were significantly downregulated (Suppl. Figure 1A, Suppl. Table 3). Concomitantly markers of differentiated cells of the caudate putamen were significantly upregulated. Specifically, 45.7% of cells were of a neuronal phenotype (β-III-tubulin+ cells), 29.7% expressed GFAP, a marker of astrocytes, and 12.9% were oligodendrocytes (GalC+ cells). Calbindin+ neurons (9.11%) were the most common neuronal phenotype followed by DARPP-32+ GABAergic output neurons (6.4%) and calretinin+ neurons (6.29%). However, within these differentiated cells, no cells expressed choline-acetyl transferase (ChAT), as a marker of cholinergic interneurons, and only a very small number expressed tyrosine hydrolyase (TH) (<1%), as a marker of dopaminergic cells. The viability of these cells after harvesting was excellent for undifferentiated cells (95%), but decreased slightly for differentiated cells (87%) (Suppl. Figure 1B). Differentiated cells were at a slightly later passage number (p28) than undifferentiated cells (p23) (Supplementary Figure 1C). These in vitro conditions therefore afforded the investigation of the metabolites that changed during the differentiation of striatal hNSCs.
Water-soluble metabolites in undifferentiated and differentiated hNSCs
For some metabolites, such as combined phosphocholine and glycerophosphocholine (PC+GPC) and myo-inositol (mI), very prominent peaks are evident and changes in these metabolites lead to striking differences in concentration profile between undifferentiated and differentiated cells (Suppl Fig 2). Significant decreases in threonine, alanine, glutamate, PC+GPC, mI, uridine triphosphate + uridine diphosphate (UTP+UDP) and adenosine-triphosphate + adenosine diphosphate (ATP+ADP) were found in differentiated STROC05 cells when compared with undifferentiated cells (Table 1). The concentration of mI was reduced almost 50 fold in differentiated cells, whereas most other metabolites were reduced between 2-5 fold. Although the concentration of NAA decreased by 50% during differentiation, this did not reach statistical significance. These differences must be considered together with changes or differences in secreted factors in the culturing media. Resonances from 4-(2-hydroxylethyl)-1- piperazine-ethane sulfonic acid (HEPES) were only readily observed in extracts of differentiated cells, resulting from cell uptake from the media, as HEPES was only present in the media of the differentiated cells.
Table 1. Water-soluble metabolites.
Metabolites detected in extracts of undifferentiated (n=4) and differentiated (n=4) STROC05 cells are expressed as Mean ± SEM. Metabolite concentration in fmol/cell. Abbreviations: N-acetyl-aspartate = NAA; phosphocholine + glycerophosphocholine = PC+GPC; uridine triphosphate + uridine diphosphate = UTP+UDP; adenosine-triphosphate + adenosine diphosophate = ATP+ADP; nicotinamide adenine dinucleotide = NAD(H).
| Peak | Metabolite | Undifferentiated | Differentiated | Fold Change | p value |
|---|---|---|---|---|---|
| 2 | Threonine | 1.82 ± 0.30 | 0.56 ± 0.11 | ↓3.25 | 0.02 |
| 3 | Lactate | 9.55 ± 3.84 | 4.06 ± 0.80 | 0.29 | |
| 4 | Alanine | 4.78 ± 1.03 | 0.93 ± 0.11 | ↓5.14 | 0.03 |
| 5 | Acetate | 2.59 ± 0.27 | 2.75 ± 0.19 | 0.68 | |
| 6 | NAA | 3.65 ± 0.72 | 1.85 ± 0.18 | 0.09 | |
| 7 | Glutamate | 14.25 ± 2.35 | 5.96 ± 0.52 | ↓2.39 | 0.03 |
| 8 | Succinate | 0.32 ± 0.06 | 0.22 ± 0.03 | 0.21 | |
| 9 | Glutamine | 1.80 ± 0.51 | 2.74 ± 0.46 | 0.26 | |
| 10 | PC+GPC | 12.83 ± 1.33 | 4.42 ± 0.90 | ↓2.78 | 0.003 |
| 11 | Glycine | 0.17 ± 0.06 | 0.15 ± 0.04 | 0.81 | |
| 12 | Creatine | 0.20 ± 0.06 | 0.13 ± 0.01 | 0.33 | |
| 13 | Myo-inositol | 9.25 ± 0.86 | 0.19 ± 0.04 | ↓48.68 | <0.001 |
| 14 | UTP+UDP | 4.09 ± 0.41 | 2.08 ± 0.07 | ↓1.97 | 0.01 |
| 15 | ATP+ADP | 3.91 ± 0.29 | 2.32 ± 0.08 | ↓1.69 | 0.01 |
| 16 | NAD(H) | 0.66 ± 0.06 | 0.54 ± 0.06 | 0.21 |
Uptake and excretion of metabolites in the culture media
As metabolite changes can be a consequence of different culturing conditions, it is important to establish how the uptake and excretion of metabolites is affected by the cell culture media (Table 2). Significant increases (1.1 to 3.5 fold) in the uptake of leucine, iso-leucine, valine, glutamine, tyrosine, phenylalanine and glucose were found in differentiated compared to undifferentiated STR cells, which is consistent with these metabolites (except for glutamine) being higher in the differentiated media (1.3 to 2 fold). In contrast, a decrease in alanine excretion was also observed in differentiated cells.
Table 2. Metabolite uptake and excretion in the culture media.
Supernatant of cell culture media of undifferentiated (n=4) and differentiated (n=4) STROC05 cells was analyzed for changes in metabolite uptakes and excretions. Data are expressed as Mean ± SEM. Metabolite concentration in μmol/million cells.
| Cell | Metabolite | Undifferentiated | Differentiated | Change | p value |
|---|---|---|---|---|---|
| Uptake | Leucine | 0.48 ± 0.04 | 0.99 ± 0.03 | ↑2.06 | 0.001 |
| Iso-leucine | 0.46 ± 0.04 | 0.87 ± 0.09 | ↑1.89 | 0.001 | |
| Valine | 0.24 ± 0.05 | 0.40 ± 0.04 | ↑1.66 | 0.02 | |
| Glutamine | 2.93 ± 0.05 | 3.32 ± 0.28 | ↑1.13 | 0.05 | |
| Histidine | 0.08 ± 0.02 | 0.08 ± 0.03 | 0.47 | ||
| Tyrosine | 0.10 ± 0.01 | 0.35 ± 0.07 | ↑3.5 | 0.008 | |
| Phenylalanine | 0.13 ± 0.01 | 0.29 ± 0.01 | ↑2.23 | 0.03 | |
| Glucose | 6.91 ± 0.60 | 8.81 ± 0.39 | ↑1.27 | 0.03 | |
| Excretion | Lactate | 31.44 ± 3.54 | 16.88 ± 0.82 | 0.23 | |
| Alanine | 0.58 ± 0.10 | 0.35 ± 0.07 | ↓1.65 | 0.04 |
Lipid metabolites in undifferentiated and differentiated hNSCs
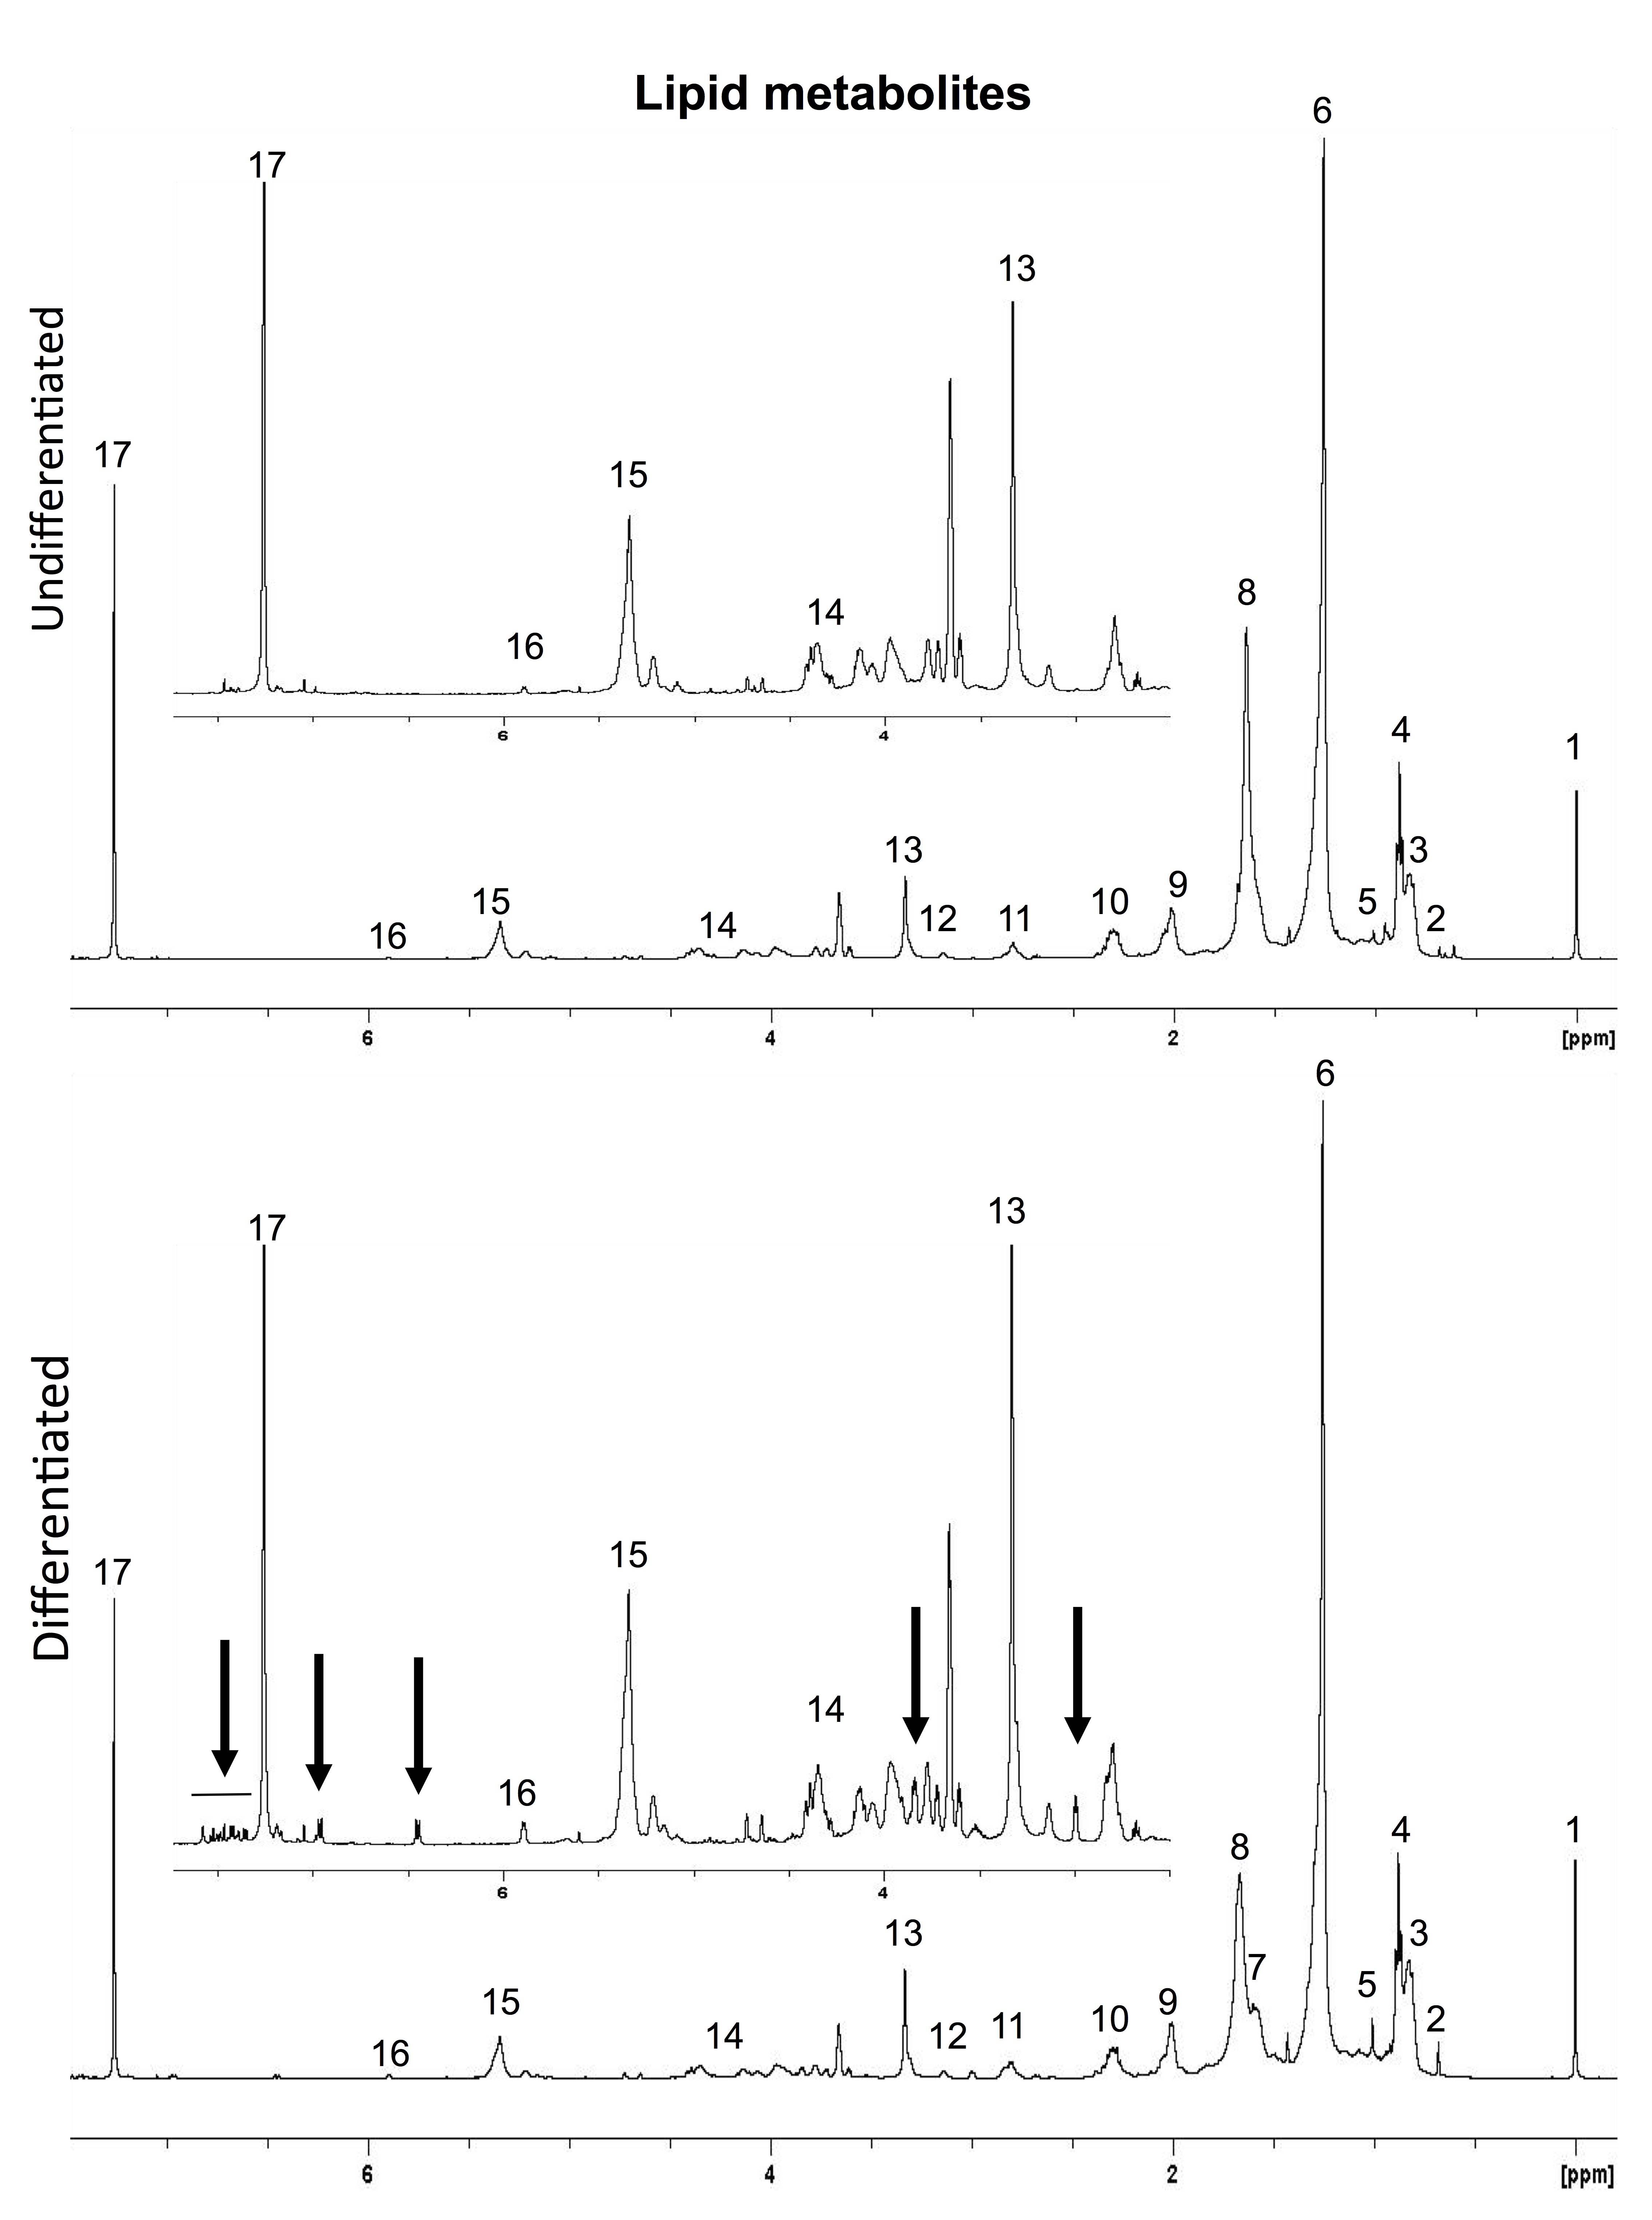
The spectra from the lipid phase of an undifferentiated and a differentiated STROC05 cell extract show subtle but significant changes in levels of a variety of lipids (Suppl. Figure 3). Specifically, cholesterol and cholesterol ester, the methyl resonance of the fatty acids, the -CH=CH- resonance of the fatty acids, phosphatidylcholine and plasmalogen were significantly increased in differentiated STROC05 cells (Table 3). A cholesterol ester signal (CS) at 1.58 ppm, as well as unidentified resonances at 2.99, 3.84, 6.44, 6.96 and 7.35 to 8.10 ppm were only observed in differentiated cells. These lipids are specific to differentiated cells, as these resonances are not present in the lipid extracts of media from differentiated or undifferentiated STROC05 cells.
Table 3. Lipid metabolites.
Metabolites detected in extracts of undifferentiated (n=4) and differentiated (n=4) STROC05 cells are expressed as Mean ± SEM. Metabolites are expressed as Lipid Metabolite/CDCl3 ratio per million cells. (not detected = n.d.; not computed = n.c.).
| Peak | Lipid Metabolite/CDCl3 | Undifferentiated | Differentiated | Change | p value |
|---|---|---|---|---|---|
| 2 | Cholesterol-C18H3 | 0.002 ± 0.001 | 0.008 ± 0.001 | ↑4.00 | 0.001 |
| 3 | Cholesterol ester | 0.130 ± 0.02 | 0.160 ± 0.02 | 0.45 | |
| 4 | CH3-FA | 0.130 ± 0.01 | 0.180 ± 0.02 | ↑1.38 | 0.01 |
| 5 | Cholesterol-C19H3 | 0.009 ± 0.001 | 0.012 ± 0.001 | ↑1.33 | 0.05 |
| 6 | (CH2)n-FA | 0.840 ± 0.03 | 1.040 ± 0.09 | 0.07 | |
| 7 | Cholesterol ester (1.58ppm) | n.d. | 0.110 ± 0.01 | ↑ | n.c. |
| 8 | CH2-CH2-CH2 | 0.460 ± 0.02 | 0.410 ± 0.02 | 0.16 | |
| 9 | CH2-CH2-CH= | 0.094 ± 0.008 | 0.115 ± 0.011 | 0.18 | |
| 10 | 2OC-CH2-CH2 | 0.063 ± 0.005 | 0.078 ± 0.006 | 0.10 | |
| 11 | =CH-CH2-CH= | 0.024 ± 0.001 | 0.036 ± 0.002 | ↑1.50 | 0.004 |
| 12 | Phosphatidylethanolamine | 0.005 ± 0.001 | 0.007 ± 0.001 | 0.07 | |
| 13 | Phosphatidylcholine | 0.057 ± 0.003 | 0.083 ± 0.013 | ↑1.45 | 0.01 |
| 14 | Triacylglyceride | 0.004 ± 0.001 | 0.005 ± 0.001 | 0.26 | |
| 15 | CH2=CH2 | 0.053 ± 0.009 | 0.072 ± 0.010 | ↑1.35 | 0.03 |
| 16 | Plasmalogen | 0.001 ± 0.000 | 0.003 ± 0.000 | ↑3.00 | 0.001 |
Discussion
1H-Magnetic resonance spectroscopy (MRS) enables the detection of metabolites in undifferentiated and differentiated hNSC extracts [15]. Significant decreases in water-soluble metabolites were evident, with mI indicating an almost 50 fold decrease in concentration, whereas most other metabolites (e.g. alanine, glutamate) underwent a 2-5 fold decrease. Many metabolites in the aqueous phase decreased, whereas lipids increased upon differentiation. Specific metabolite changes, reflecting different biological and biochemical processes (e.g. proliferation), therefore characterize the undifferentiated from the differentiated state of hNSCs.
Profiling the neural stem cell state
Neural stem cells are a fairly homogenous population of cells with all cells being in a similar proliferative state and therefore generate proteins and cell organelles for cell division, hence constantly increasing their biochemical composition. Indeed, metabolite concentrations in undifferentiated cells were overall much higher than in differentiated cells. PC+GPC, for instance, was significantly higher in undifferentiated NSCs, reflecting a higher turnover rate of the cellular membrane, consistent with the higher score of the proliferative marker Ki67. There was a significant decrease in UTP+UDP and ATP+ADP with unchanged creatine in differentiated cells. This lower energetic demand of differentiated cells is consistent with its non-proliferative state. Higher levels of PC+GPC and ATP could therefore indicate if transplanted cells are still proliferating or if they have ceased cell division.
Importantly, NSCs are restricted to become brain cells, but are unspecified in terms of becoming a mature brain cell, i.e. a neuron, astrocyte or oligodendrocyte. They therefore share commonalities in their metabolite profile with other proliferative cells, such as embryonic stem (ES) cells or tumor cells. Choline metabolism, leading to the elevated levels of choline-containing metabolites, is known to be a key component or result of the transformation of tumor cells and is upregulated upon immortalization [16]. STROC05 cells, which are conditionally immortalized, do show elevated PC+GPC in their undifferentiated state. Interestingly, Jansen et al. [9] reported the absence of GPC and mI in ES cells and their presence in NSCs, indicating that changes in these two metabolites might indeed be related to the NSCs state. mI is easily identified in undifferentiated NSCs and putatively might serve to distinguish NSCs from ES and differentiated brain cells. Still, mI is an abundant metabolite in the adult brain and thought to act as an osmolyte, while being located in glial cells and to a lesser extent in neurons [17]. This metabolite profile therefore is useful to generally describe the NSC state, but is unlikely to specifically define NSCs per se [18].
Further, caution must be employed, as we have to use a different growth media during the last two weeks of cell differentiation to ensure the differentiated cells' survival and attachment. Differences in media composition between undifferentiated and differentiated cells could influence metabolism, as well as the presence or absence of specific amino acids. Still, the magnitude of changes observed here, such as a 50 fold decrease in mI, cannot account for the small differences in concentration of these components in both media.
Cell type-specific metabolites
The differentiation of NSCs into mature brain cells produces a heterogeneous cell population consisting of neurons, astrocytes and oligodendrocytes. Each cell type has specific biochemical features that are associated with different metabolites [19]. Most commonly in vivo, the presence and the level of NAA expression are considered indicators of neurons [20]. However, despite a content of 45.7% of neuronal cells, absolute NAA levels here were not significantly different in differentiated cells when compared with undifferentiated cells. Although primary fetal rat neurons contain NAA in vitro when analyzed using MR spectroscopy [3], there is also robust evidence indicating that at least immature oligodendrocytes can also contain NAA [21].
Whilst the maturation of human neurons is a lengthy process, this is considered less so for astrocytes and oligodendrocytes. We here achieved a yield of 29.7% astrocytes and 12.9% oligodendrocytes, amounting to a substantial portion of our cell population. Nevertheless, mI concentration typically associated with astrocytes [22], decreased with differentiation. Glutamine, the main product of astrocytic metabolism [23], was also decreased in differentiated compared to undifferentiated cells. Absolute levels of glycine were unchanged after 3 weeks of differentiation, whereas taurine was neither detected in undifferentiated, nor in differentiated, cells. Taurine is synthesized by astrocytes and accumulates in neurons [24]. It will be important to establish how these levels compare with primary astrocytes derived from an adult brain. In contrast, plasmalogen, a lipid which is enriched in myelin sheets [25], is increased 3-fold, potentially being a marker for oligodendrocytes [26].
In vivo detection of NSCs and neuronal differentiation
In vitro studies afford the investigation of specific cell types under defined conditions. This information is useful to determine which metabolites could be used in vivo to monitor the differentiation of implanted human NSCs. However, in vivo MR spectroscopy in humans or animals is typically performed at lower field strengths and is subject to susceptibility effects associated with tissue structure, leading to broader peaks and higher levels of noise in spectra. Therefore only clearly identifiable peaks, such as mI, will be useful markers to distinguish undifferentiated and differentiated cells. The localized injection of NSCs to repair damage in neurological conditions, such as stroke, supplies large quantities (>400,000) of NSCs into striatal or cortical tissue constituting a large proportion of an in vivo voxel. 1H-MRS would therefore potentially allow clinicians to determine how many cells were delivered (based on changes in metabolite levels in mI), but would also provide a means to determine if most of the cells stopped proliferating.
Conclusion
1H-Magnetic resonance spectroscopy readily identifies metabolites, such as PC+GPC, associated with the proliferation of neural stem cells. A combination of PC+GPC and mI might be useful markers of the NSC state, but comparisons with cells at a similar developmental stage are required to better define if these changes are specific to NSCs and if this profile is consistent across NSCs derived from different brain regions. These changes in metabolites may be useful to monitor the differentiation of NSCs after intracerebral implantation.
Supplementary Material
Supplementary Figure 1. In vitro characterization of phenotypic marker expression. A. Immunocytochemical detection of phenotypic markers for undifferentiated and differentiated STROC05 cells (Dopamine- and cAMP-regulated neuronal phosphoprotein = DARPP-32; β-III-Tubulin = Tuj-1; parvalbumin = Parva; tyrosine hydroxylase = TH; Galactocerebroside C = GalC). B. Viability measurement by trypan blue exclusion straight after harvesting. C. The passage number of cells prepared for 1H-MRS analysis.
Supplementary Table 1. Undifferentiated growth media components. Media components used to grow and expand undifferentiated STROC05 hNSCs cell population. Components in shaded cells were present in both undifferentiated and differentiated growth media conditions. (n.a. = not available)
Supplementary Figure 2. 1H-high-resolution MRS of the aqueous phase of cell extracts. 1H MR spectra of water-soluble metabolites in undifferentiated and differentiated STROC05 cells extracts. Key to numbered peaks: (1) 3-trimethylsilyl-2,2,3,3-tetradeuteropropionate (TSP); (2) threonine; (3) lactate; (4) alanine; (5) acetate; (6) N-acetyl-aspartate (NAA); (7) glutamate; (8) succinate; (9) glutamine; (10) phosphocholine + glycerophosphocholine (PC+GPC); (11) glycine; (12) creatine; (13) myo-inositol (mI); (14) uridine triphosphate + uridine diphosphate (UTP+UDP); (15) adenosine triphosphate + adenosine diphosphate (ATP+ADP); (16) nicotinamide adenine dinucleotide (NAD(H)); (17) 4-(2-hydroxyethyl)-1-piperazineethanesulfonic acid (HEPES). Inset is a magnified view (x32) of the region between 5.50-9.00 parts per million (ppm) to highlight the aromatic region of the spectra.
Supplementary Table 2. Differentiated media components. Media components used to differentiate STROC05 hNSCs into striatal neurons. Components in shaded cells were present in both undifferentiated and differentiated growth media conditions. (n.a. = not available)
Supplementary Figure 3. 1H-high-resolution MRS of the lipid-phase of cell extracts. 1H MR spectra of lipid metabolites in undifferentiated and differentiated STROC05 cell extracts. Key to numbered peaks: (1) tetramethylsilane (TMS); (2) Cholesterol-C18H3; (3) Cholesterol ester; (4) CH3-FA; (5) Cholesterol-C19H3; (6) (CH2)n-FA; (7) Cholesterol ester; (8) CH2-CH2-CH2; (9) CH2-CH2-CH=; (10) 2OC-CH2-CH2; (11) =CH-CH2-CH=; (12) phosphatidylethanolamine; (13) phosphatidylcholine; (14) triacylglyceride; (15) CH2=CH2; (16) plasmalogen; (17) CDCl3. Black arrows showing the resonances that are present in differentiated cells, but not in undifferentiated cells. Inset is a magnified view (x8) between 2.50-7.75 parts per million (ppm) to highlight changes in smaller metabolite peaks.
Supplementary Table 3. Phenotypic markers of undifferentiated and differentiated striatal hNSCs. Markers of proliferation (Ki67) and hNSCs (Nestin, Sox2) are high in undifferentiated cells, but decrease significantly in hNSCs differentiated with purmorphamine for 3 weeks. Conversely, phenotypic markers of striatal cells are absent in undifferentiated cells, but are significantly upregulated in differentiated cells. No Choline Acetyl Transferase (ChAT) indicative of cholingerigic striatal interneurons was present in undifferentiated or differentiated cells. The presence of phenotypic markers is expressed as mean % ± SEM. Significant differences were considered at the p<0.05 level (n.c. = not computed) using a Mann-Whitney Test. Abbreviations: Dopamine- and cAMP-regulated neuronal phosphoprotein = DARPP32; Tyrosine hydroxylase = TH; Glial Fibrillary Acid Protein = GFAP; Galactocerebroside C = Gal C.
Acknowledgments
This work was supported by an MRC (G0802552) and a EU Framework VII grant (201842-ENCITE). MM was the recipient of a RCUK fellowship. GEA was the recipient of a PhD studentship from the Egyptian Government (MM45/07). YLC and MOL acknowledge the support received from the CR-UK and EPSRC Cancer Imaging Centre in association with the MRC and Department of Health (England) grant C1060/A10334, NHS funding to the NIHR Biomedical Research Centre.
Abbreviations
- 4-OHT
4-hydroxy-tamoxifen
- ATP+ADP
adenosine-triphosphate + adenosine diphosphate
- bFGF
basic fibroblast growth factor
- ChAT
choline acetyltransferase
- Cr
creatine
- CS
cholesterol sulfate
- D2O
deuterated water
- DARPP32
Dopamine- and cAMP-regulated neuronal phosphoprotein
- EDTA
Ethylenediaminetetraacetic acid
- ECF
extracellular fluid
- EGF
epidermal growth factor
- ES
embryonic stem cell
- GABA
γ-aminobutyric acid
- GalC
Galactocerebroside C
- GFAP
Glial Fibrillary Acid Protein
- Glx
glutamine+glutamate
- GPC
glycerophosphocholine
- HEPES
4-(2-hydroxyethyl)-1-piperazineethanesulfonic acid
- hNSC
human neural stem cell
- LGE
lateral ganglionic eminence
- mI
myo-inositol
- MRI
magnetic resonance imaging
- MRS
magnetic resonance spectroscopy
- NAA
N-acetylaspartate
- n.c
not computed
- n.d.
not detected
- NMR
nuclear magnetic resonance
- PBS
phosphate buffered saline
- PC
Phosphocholine
- PCr
phosphocreatine
- PLL
poly-L-lysine
- ppm
parts per million
- TH
tyrosine hydroxylase
- TMS
tetramethylsilane
- TSP
sodium 3-trimethylsilyl-2,2,3,3-tetradeuteropropionate
- UTP+UDP
uridine triphosphate + uridine diphosphate
Footnotes
Authors' Contribution: YLC: Contributed to design of study, Acquired NMR spectra, Processed and Analyzed NMR data, drafted manuscript, interpretation of data; GEA: Grew and differentiated cells, Dual Phase Extraction; Contributed to the Manuscript; PWS: Contributed to the design of the study, set-up dual phase extraction, interpretation of the results, drafting of the manuscript; BS: acquiring pilot data; MOL: Contributed to design of the study, interpretation of the results, review of results and manuscript, financial support; MM: Conceived of the study, financial support, interpretation of the results, drafted the manuscript, final approval of the manuscript.
References
- 1.Sztriha LK, O'Gorman RL, Modo M, Barker GJ, Williams SC, Kalra L. Monitoring brain repair in stroke using advanced magnetic resonance imaging. Stroke. 2012;43:3124–3131. doi: 10.1161/STROKEAHA.111.649244. [DOI] [PubMed] [Google Scholar]
- 2.Modo M, Hoehn M, Bulte JW. Cellular MR imaging. Mol Imaging. 2005;4:143–164. doi: 10.1162/15353500200505145. [DOI] [PubMed] [Google Scholar]
- 3.Bhakoo KK, Williams IT, Williams SR, Gadian DG, Noble MD. Proton nuclear magnetic resonance spectroscopy of primary cells derived from nervous tissue. Journal of neurochemistry. 1996;66:1254–1263. doi: 10.1046/j.1471-4159.1996.66031254.x. [DOI] [PubMed] [Google Scholar]
- 4.Florian CL, Preece NE, Bhakoo KK, Williams SR, Noble M. Characteristic metabolic profiles revealed by 1H NMR spectroscopy for three types of human brain and nervous system tumours. NMR Biomed. 1995;8:253–264. doi: 10.1002/nbm.1940080605. [DOI] [PubMed] [Google Scholar]
- 5.Manganas LN, Zhang X, Li Y, Hazel RD, Smith SD, Wagshul ME, et al. Magnetic resonance spectroscopy identifies neural progenitor cells in the live human brain. Science. 2007;318:980–985. doi: 10.1126/science.1147851. [DOI] [PMC free article] [PubMed] [Google Scholar]
- 6.Jansen JF, Gearhart JD, Bulte JW. Comment on ‘Magnetic resonance spectroscopy identifies neural progenitor cells in the live human brain”. Science. 2008;321:640. doi: 10.1126/science.1153997. author reply 640. [DOI] [PubMed] [Google Scholar]
- 7.Friedman SD. Comment on “Magnetic resonance spectroscopy identifies neural progenitor cells in the live human brain”. Science. 2008;321:640. doi: 10.1126/science.1153484. author reply 640. [DOI] [PMC free article] [PubMed] [Google Scholar]
- 8.Hoch JC, Maciejewski MW, Gryk MR. Comment on “magnetic resonance spectroscopy identifies neural progenitor cells in the live human brain”. Science. 2008;321:640. doi: 10.1126/science.1153058. author reply 640. [DOI] [PMC free article] [PubMed] [Google Scholar]
- 9.Jansen JF, Shamblott MJ, van Zijl PC, Lehtimaki KK, Bulte JW, Gearhart JD, et al. Stem cell profiling by nuclear magnetic resonance spectroscopy. Magnetic resonance in medicine : official journal of the Society of Magnetic Resonance in Medicine / Society of Magnetic Resonance in Medicine. 2006;56:666–670. doi: 10.1002/mrm.20968. [DOI] [PubMed] [Google Scholar]
- 10.Johansson S, Price J, Modo M. Effect of inflammatory cytokines on major histocompatibility complex expression and differentiation of human neural stem/progenitor cells. Stem Cells. 2008;26:2444–2454. doi: 10.1634/stemcells.2008-0116. [DOI] [PubMed] [Google Scholar]
- 11.Pollock K, Stroemer P, Patel S, Stevanato L, Hope A, Miljan E, et al. A conditionally immortal clonal stem cell line from human cortical neuroepithelium for the treatment of ischemic stroke. Exp Neurol. 2006;199:143–155. doi: 10.1016/j.expneurol.2005.12.011. [DOI] [PubMed] [Google Scholar]
- 12.El-Akabawy G, Medina LM, Jeffries A, Price J, Modo M. Purmorphamine increases DARPP-32 differentiation in human striatal neural stem cells through the Hedgehog pathway. Stem cells and development. 2011;20:1873–1887. doi: 10.1089/scd.2010.0282. [DOI] [PubMed] [Google Scholar]
- 13.Sitter B, Sonnewald U, Spraul M, Fjosne HE, Gribbestad IS. High-resolution magic angle spinning MRS of breast cancer tissue. NMR Biomed. 2002;15:327–337. doi: 10.1002/nbm.775. [DOI] [PubMed] [Google Scholar]
- 14.Sze DY, Jardetzky O. Characterization of lipid composition in stimulated human lymphocytes by 1H-NMR. Biochim Biophys Acta. 1990;1054:198–206. doi: 10.1016/0167-4889(90)90241-5. [DOI] [PubMed] [Google Scholar]
- 15.Ramm Sander P, Hau P, Koch S, Schutze K, Bogdahn U, Kalbitzer HR, et al. Stem cell metabolic and spectroscopic profiling. Trends in biotechnology. 2013 doi: 10.1016/j.tibtech.2013.01.008. [DOI] [PubMed] [Google Scholar]
- 16.Bhakoo KK, Williams SR, Florian CL, Land H, Noble MD. Immortalization and transformation are associated with specific alterations in choline metabolism. Cancer Res. 1996;56:4630–4635. [PubMed] [Google Scholar]
- 17.Haris M, Cai K, Singh A, Hariharan H, Reddy R. In vivo mapping of brain myo-inositol. Neuroimage. 2011;54:2079–2085. doi: 10.1016/j.neuroimage.2010.10.017. [DOI] [PMC free article] [PubMed] [Google Scholar]
- 18.Loewenbruck KF, Fuchs B, Hermann A, Brandt M, Werner A, Kirsch M, et al. Proton MR spectroscopy of neural stem cells: does the proton-NMR peak at 1.28 ppm function as a biomarker for cell type or state? Rejuvenation Res. 2011;14:371–381. doi: 10.1089/rej.2010.1102. [DOI] [PubMed] [Google Scholar]
- 19.Urenjak J, Williams SR, Gadian DG, Noble M. Proton nuclear magnetic resonance spectroscopy unambiguously identifies different neural cell types. The Journal of neuroscience : the official journal of the Society for Neuroscience. 1993;13:981–989. doi: 10.1523/JNEUROSCI.13-03-00981.1993. [DOI] [PMC free article] [PubMed] [Google Scholar]
- 20.Wang Y, Li SJ. Differentiation of metabolic concentrations between gray matter and white matter of human brain by in vivo 1H magnetic resonance spectroscopy. Magnetic resonance in medicine : official journal of the Society of Magnetic Resonance in Medicine / Society of Magnetic Resonance in Medicine. 1998;39:28–33. doi: 10.1002/mrm.1910390107. [DOI] [PubMed] [Google Scholar]
- 21.Bhakoo KK, Pearce D. In vitro expression of N-acetyl aspartate by oligodendrocytes: implications for proton magnetic resonance spectroscopy signal in vivo. J Neurochem. 2000;74:254–262. doi: 10.1046/j.1471-4159.2000.0740254.x. [DOI] [PubMed] [Google Scholar]
- 22.Brand A, Richter-Landsberg C, Leibfritz D. Multinuclear NMR studies on the energy metabolism of glial and neuronal cells. Dev Neurosci. 1993;15:289–298. doi: 10.1159/000111347. [DOI] [PubMed] [Google Scholar]
- 23.Brand A, Richter-Landsberg C, Leibfritz D. Metabolism of acetate in rat brain neurons, astrocytes and cocultures: metabolic interactions between neurons and glia cells, monitored by NMR spectroscopy. Cell Mol Biol (Noisy-le-grand) 1997;43:645–657. [PubMed] [Google Scholar]
- 24.Merle M, Pianet I, Canioni P, Labouesse J. Comparative 31P and 1H NMR studies on rat astrocytes and C6 glioma cells in culture. Biochimie. 1992;74:919–930. doi: 10.1016/0300-9084(92)90076-q. [DOI] [PubMed] [Google Scholar]
- 25.Nagan N, Zoeller RA. Plasmalogens: biosynthesis and functions. Prog Lipid Res. 2001;40:199–229. doi: 10.1016/s0163-7827(01)00003-0. [DOI] [PubMed] [Google Scholar]
- 26.Wilhelm MJ, Ong HH, Wehrli SL, Li C, Tsai PH, Hackney DB, et al. Direct magnetic resonance detection of myelin and prospects for quantitative imaging of myelin density. Proc Natl Acad Sci U S A. 2012;109:9605–9610. doi: 10.1073/pnas.1115107109. [DOI] [PMC free article] [PubMed] [Google Scholar]
Associated Data
This section collects any data citations, data availability statements, or supplementary materials included in this article.
Supplementary Materials
Supplementary Figure 1. In vitro characterization of phenotypic marker expression. A. Immunocytochemical detection of phenotypic markers for undifferentiated and differentiated STROC05 cells (Dopamine- and cAMP-regulated neuronal phosphoprotein = DARPP-32; β-III-Tubulin = Tuj-1; parvalbumin = Parva; tyrosine hydroxylase = TH; Galactocerebroside C = GalC). B. Viability measurement by trypan blue exclusion straight after harvesting. C. The passage number of cells prepared for 1H-MRS analysis.
Supplementary Table 1. Undifferentiated growth media components. Media components used to grow and expand undifferentiated STROC05 hNSCs cell population. Components in shaded cells were present in both undifferentiated and differentiated growth media conditions. (n.a. = not available)
Supplementary Figure 2. 1H-high-resolution MRS of the aqueous phase of cell extracts. 1H MR spectra of water-soluble metabolites in undifferentiated and differentiated STROC05 cells extracts. Key to numbered peaks: (1) 3-trimethylsilyl-2,2,3,3-tetradeuteropropionate (TSP); (2) threonine; (3) lactate; (4) alanine; (5) acetate; (6) N-acetyl-aspartate (NAA); (7) glutamate; (8) succinate; (9) glutamine; (10) phosphocholine + glycerophosphocholine (PC+GPC); (11) glycine; (12) creatine; (13) myo-inositol (mI); (14) uridine triphosphate + uridine diphosphate (UTP+UDP); (15) adenosine triphosphate + adenosine diphosphate (ATP+ADP); (16) nicotinamide adenine dinucleotide (NAD(H)); (17) 4-(2-hydroxyethyl)-1-piperazineethanesulfonic acid (HEPES). Inset is a magnified view (x32) of the region between 5.50-9.00 parts per million (ppm) to highlight the aromatic region of the spectra.
Supplementary Table 2. Differentiated media components. Media components used to differentiate STROC05 hNSCs into striatal neurons. Components in shaded cells were present in both undifferentiated and differentiated growth media conditions. (n.a. = not available)
Supplementary Figure 3. 1H-high-resolution MRS of the lipid-phase of cell extracts. 1H MR spectra of lipid metabolites in undifferentiated and differentiated STROC05 cell extracts. Key to numbered peaks: (1) tetramethylsilane (TMS); (2) Cholesterol-C18H3; (3) Cholesterol ester; (4) CH3-FA; (5) Cholesterol-C19H3; (6) (CH2)n-FA; (7) Cholesterol ester; (8) CH2-CH2-CH2; (9) CH2-CH2-CH=; (10) 2OC-CH2-CH2; (11) =CH-CH2-CH=; (12) phosphatidylethanolamine; (13) phosphatidylcholine; (14) triacylglyceride; (15) CH2=CH2; (16) plasmalogen; (17) CDCl3. Black arrows showing the resonances that are present in differentiated cells, but not in undifferentiated cells. Inset is a magnified view (x8) between 2.50-7.75 parts per million (ppm) to highlight changes in smaller metabolite peaks.
Supplementary Table 3. Phenotypic markers of undifferentiated and differentiated striatal hNSCs. Markers of proliferation (Ki67) and hNSCs (Nestin, Sox2) are high in undifferentiated cells, but decrease significantly in hNSCs differentiated with purmorphamine for 3 weeks. Conversely, phenotypic markers of striatal cells are absent in undifferentiated cells, but are significantly upregulated in differentiated cells. No Choline Acetyl Transferase (ChAT) indicative of cholingerigic striatal interneurons was present in undifferentiated or differentiated cells. The presence of phenotypic markers is expressed as mean % ± SEM. Significant differences were considered at the p<0.05 level (n.c. = not computed) using a Mann-Whitney Test. Abbreviations: Dopamine- and cAMP-regulated neuronal phosphoprotein = DARPP32; Tyrosine hydroxylase = TH; Glial Fibrillary Acid Protein = GFAP; Galactocerebroside C = Gal C.