

Abstract
New sequencing technologies pose significant challenges in terms of data complexity and magnitude. It is essential that efficient software is developed with performance that scales with this growth in sequence information. Here we present a comprehensive and integrated set of tools for the analysis of data from large scale sequencing experiments. It supports adapter detection and removal, demultiplexing of barcodes, paired-end data, a range of read architectures and the efficient removal of sequence redundancy. Sequences can be trimmed and filtered based on length, quality and complexity. Quality control plots track sequence length, composition and summary statistics with respect to genomic annotation. Several use cases have been integrated into a single streamlined pipeline, including both mRNA and small RNA sequencing experiments. This pipeline interfaces with existing tools for genomic mapping and differential expression analysis.
Keywords: Algorithms, Tools, RNAseq, NGS, Next-generation sequencing, Sequencing, Adapter trimming, Pipelines
1. Introduction
Next-generation sequencing has revolutionised our ability to perform high-throughput genomic experiments [14]. The analysis of such sequencing data presents several specific problems. Firstly, sequences may be contaminated with adapters ligated to their 5′ or 3′ ends as part of the sequencing protocol. This is an even greater problem for small RNA sequencing (sRNA-seq) where the molecule being studied is usually shorter than the read-length obtained (typically 19–22 nt of 36 nt). Hence, for sRNA-seq the majority of sequences obtained will exhibit adapter contamination [5]. Secondly, base quality and sequence complexity vary both within and between reads. It is desirable to remove or trim such sequences with appropriate thresholds. Finally, sequences generated tend to be highly redundant with the same sequence represented large numbers of times in the input file. This is a particular problem for sRNA-seq data where a small pool of molecules has been sequenced to high count depth. This redundancy should ideally be filtered and tracked to make downstream analysis more efficient and also potentially reduce PCR amplification artefacts [16]. An additional complication is that it is increasingly common to add small tags (barcodes) to molecules being sequenced in order to multiplex samples through a single experiment. The presence or absence of multiplexed barcodes coupled with sequencing adapters and potentially other sequence inserts mean that sequenced reads may have complicated geometries. Such complex geometries need to be decoded in order to proceed with sequence analysis.
The problems listed above are made more pressing by the increasing popularity of these technologies, decreasing costs involved and increasing numbers of nucleotides per experiment. It is imperative that tools can not only handle current requirements for analysis, but also scale to meet the demands of sequencing in the coming years.
Several tools and resources are available for performing this kind of analysis (e.g. [6,10,11,12,13] with different sets of features (Table 1)). In many cases these tools require the availability of high-performance supercomputing clusters, large memory computers or a significant amount of compute time. In some cases entire pipelines are available for specific analysis scenarios while in other cases individual stand-alone tools are available for specific tasks. It is important that such tools not only be flexible and adaptable but also efficient both in terms of run-time and memory footprint. Additionally, such tools should be straightforward to setup, run and interpret across a wide range of experimental designs.
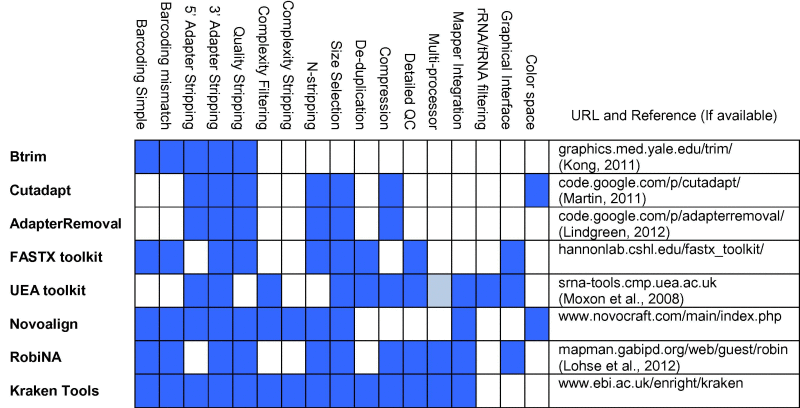
Table 1.
Comparison of feature sets available in various tools. Each column represents specific features and whether or not they are supported by each toolkit (rows). Cells are highlighted in blue when that feature is present, in grey if it is not clear whether or not a particular feature is supported and in white if the feature is not supported. For each tool a URL is provided.
 |
In order to help address these challenges, we have developed a comprehensive suite of tools specifically tailored for processing RNA sequencing results. The suite is capable of handling multiplexed data, recognizes common read geometries, produces reports, plots and summary statistics, and can process several FASTQ files in parallel. The core processing tools have been written in optimized C with speed and memory-efficiency as key design elements. This allows processing of large datasets on modest computing resources such as a laptop computer. These stand-alone tools are also incorporated into a pipeline called SequenceImp.
2. Implementation
The Kraken suite encompasses several components (Fig. 1). Three of these are dedicated stand-alone tools: Reaper for demultiplexing, cleaning and filtering reads and Tally for deduplicating, and counting reads, as well as re-pairing independently filtered paired-end sequence data. Additionally, a small utility called Minion is provided to deduce adapters from raw sequencing data. The over-arching SequenceImp program utilizes Reaper and Tally as part of a pipeline designed to address a series of experimental scenarios. These components are further described below. SequenceImp can be used for small RNA sequence analysis and paired-end RNA-seq cleanup and quality control. Extensive documentation detailing further options is provided both online and with the software.
Fig. 1.

Kraken suite. The Kraken tools are modular by nature, each addressing a discrete task. They are integrated into a workflow to process small RNA and paired end sequencing experiments. Parallel lines represent stages of the pipeline that can utilise multiple processors and analyse sequencing lanes concurrently.
2.1. Reaper – a fast and flexible short read processing engine
Reaper is a fast and highly memory-efficient program written in C, able to process 60–200 M reads per hour. It allows tunable identification and stripping of adaptor sequences using Smith–Waterman alignments, recognizes several types of barcode position and read layout, demultiplexes barcoded sequence reads and generates extensive summary statistics including base call quality and tri-nucleotide complexity scores (Eq. 1) that can be used to perform quality control.
Users can specify their own input and output formats in a simple specification language. By default Reaper expects FASTQ input. Reaper has been designed to address complex experimental designs and allow filtering based on a range of parameters within a single iteration of the software with minimal impact on speed and memory requirements.
Eq. 1: Tri-nucleotide complexity score S as computed by Reaper and Tally. L is the length of the sequence, Ni represents the count of an individual trimer sequence (of 64 possible combinations). The scores scale between 0 and 100 where 100 is a polymer sequence of the same nucleotide.
2.2. Tally – collation of sequences in a memory and time efficient manner
After initial processing with Reaper, the resulting collection of cleaned and filtered sequence may be highly redundant, especially for sRNA-seq. Many sequences (e.g. those corresponding to high-abundance microRNAs) are found in very high copy numbers, sometimes exceeding a million copies. Although a near-trivial task, deduplicating and counting large numbers of sequences can become a processing bottleneck if not optimized, due to memory pressure, or worse, disk access. We have developed Tally, a C-program that tallies redundant sequences in-memory. It minimizes memory usage by efficient allocation and hashing techniques combined with sequence compression. It has several additional features, such as the ability to re-pair and tally independently processed paired-end files. It can also track quality scores and does so in a highly memory-efficient manner (see Section 4). It transparently reads and writes either compressed or uncompressed files and supports a variety of input and output formats.
2.3. Minion – inferring adapter sequences from raw sequencing data
The vast majority of next-generation sequencing experiments will attach adapter sequence to the sequencing construct. In many cases these are standard sequences that can be obtained from the vendor and/or sequencing centre. Unfortunately sometimes adapter information is not properly tracked and attached as metadata to the raw sequencing data and may not be known for a given sample. To alleviate this problem, we have developed Minion, a C-program that uses De Bruijn graphs [15] to detect sequence fragments with characteristics typical of adapter sequence such as high abundance towards the 3′ end of reads.
2.4. SequenceImp – high-throughput next-generation RNA sequence analysis pipeline
The SequenceImp pipeline incorporates the tools described above into a system for analysing high-throughput sequencing studies that produce FASTQ output (Fig. 1). The pipeline allows simultaneous analysis of multiple FASTQ files through a single command.
The pipeline requires a tab delimited description of the each FASTQ file to be processed (Fig. 1). Each file is associated with a read geometry. This specifies the expected configuration of the RNA/DNA fragment in relation to other sequences that become associated with it during sample preparation (e.g. Fig. 2). In addition to the geometry, files are supplied with their adapter sequences, barcodes and sequence inserts (if used). This provides a flexible way by which to define samples derived from many preparation methods.
Fig. 2.

Sample geometries. The position of adapter sequences, barcode sequences and sequence inserts relative to the library fragments in the sample libraries analysed in this manuscript.
Additional parameters to direct the analysis of a specific experiment may be specified in a separate configuration file or selected from a set of default files that incorporate the settings for various common experimental situations (Fig. 1). This allows further control over aspects such as read filtering and mapping. The data, description and a configuration file (either default or user-defined) are the minimal set of experiment specific files that the user must provide to proceed with an analysis. The pipeline step (see below) and, at later stages, the analysis directory produced by the pipeline and an annotation directory must also be provided as command line options.
The pipeline is written in Perl and R. It requires a number of packages (GenomicRanges, IRanges, gplots and ShortRead) within the R/Bioconductor [4] framework. If mapping analysis is needed then Bowtie [8] and Samtools [9] are required. At each step standard formats are used to ensure that data derived at each stage of the pipeline will be easily compatible with external tools and pipelines. Below we describe the two major modes of operation for the pipeline.
2.5. Small RNA sequence analysis
For small RNA analysis the pipeline is divided into a series of sequential steps; organise, reaper, filter, align and features (Fig. 1). At each stage, along with the processed data, a PDF file summarising the statistics associated with each FASTQ file is produced, where appropriate.
The organise step creates a new analysis directory to store all the files and information associated with the set of FASTQ files specified in the description file and arranges a file structure compatible with subsequent steps. The reaper step provides the interface with the Reaper and Tally software (Sections 2.1 and 2.2). FASTQ files are cleaned, adapter sequences are trimmed (3′ adapter contamination) or reads are removed (5′ adapter contamination if specified) and multiplexed samples are separated into independent sequence files. The pipeline is able to deconvolute samples with various barcode geometries. Reaper can also be used to trim and clean based on additional criteria. By default this cleaning process is performed with a set of Reaper settings associated with the geometry specified within the description file. The sequence files produced are collapsed to include only non-redundant reads and the number of occurrences of each.
The filter step takes the FASTA files produced and filters them according to user-defined cutoffs for read length and Reaper tri-nucleotide scores. A defined number of bases can be clipped from the ends of reads this stage.
The align stage uses Bowtie to align filtered reads to the genome of the relevant species. Alignments can be recorded in either standard Bowtie format or SAM format (for compatibility with external tools). In the case of SAM two additional optional fields are added to each record, the redundant read depth represented by each unique sequence and the number of loci to which it maps.
The features stage of the pipeline can perform a preliminary analysis for either miRNAs or repeats (Fig. 1). In the case of miRNAs, genomic alignments are compared to genomic coordinates for miRBase [7] mature miRNAs, resulting in a matrix of redundant and non-redundant read depths for each known mature miRNA. Due to the complexities of dealing with short reads mapping to multiple loci, a number of options for dealing with multi-mapping reads are provided (see below). In the case of repeat analysis the filtered reads are aligned using Bowtie to repeat sequences and realigned to the genome for rudimentary normalization purposes. Alignments to repeats are again recorded in SAM/BAM [9] format.
2.6. Paired-end RNAseq read cleanup and QC
The pipeline is able to clean up and provide QC for standard paired-end sequencing data. Paired end analysis follows the same, stepwise, principle described above and is compatible with the organize, reaper and filter pipeline steps. FASTQ files are passed to the pipeline as pairs within the description file, each pair sharing adapter information. In this case the pipeline proceeds in a different mode, trimming reads from each pair with Reaper independently, performing reverse complementation and swapping the adapter sequences for the second file in the pair. In this mode the pipeline uses Reaper to record a read index (record offset) in the read header as it trims reads, denoting the position of a read within the FASTQ input file. Read redundancy is subsequently removed in the filter stage of the pipeline. In paired mode, while removing redundancy and filtering reads based on the user’s criteria, Tally uses the Reaper defined read index to maintain correct read pairing within the Tally output. As a consequence the output from Tally contains non-redundant read pairs while ensuring compatibility with downsteam tools. For FASTQ output, Tally reports the maximum quality per base from deduplicated sequence reads.
2.7. Annotation
The reaper and filter stages of the pipeline are not species specific. The align and features steps reference genomic annotation data. All annotation data is supplied, pre-formatted, along with the pipeline scripts. In the current version of the pipeline, formatted annotation is available for human, mouse (Mus musculus), Arabidopsis thaliana, Caenorhabditis elegans and Drosophila melanogaster samples. Genomic sequence files and annotation are obtained from Ensembl [3]. For comparison to reads in the align step of the pipeline, feature overlaps are removed according to a feature hierarchy. miRNA annotation for the features step is obtained from miRBase [7]. Repeat sequences for the features step are obtained from NCBI. All sets of coordinates are converted into R objects for integration into the analysis pipeline. All reference sequences for read alignment are converted into Bowtie indexes.
3. Results
In order to illustrate the functionality and features of the Kraken suite we have applied it to a number of example datasets that encompass a range of use cases. The sections below present, in detail, the analysis procedures for various datasets and protocols together with a description of QC and analysis features. More details concerning these worked examples are available on the website.
3.1. miRNA sequencing experiment with a 5′ barcode
This example is taken from Alon et al. [1]. Ten aliquots, each with a unique 4 nt barcode sequence at the 5′ end of the RNA/DNA fragment followed by a 2 base sequence insert (Fig. 2A) were mixed and sequenced together in a single sequencing lane. This complex sequence arrangement can be defined in the description file. Here the pipeline has been run with one of several sets of default configurations, in this case to ultimately quantify mouse miRBase miRNAs in each of the ten barcoded samples. During the reaper step, Reaper trimmed the 3′ adapter sequence from the reads, removed reads containing the 5′ adapter sequence, sorted reads according to their 5′ barcode and removed the barcode and sequence insert sequences from the start of each read. Finally reads were trimmed following short tracts (5 nt) containing multiple N’s (>2). Quality control information is provided for each sample within the FASTQ file (Fig. 3A) with metrics also describing reads for which no barcode was identified.
Fig. 3.

Analysis of a barcoded small RNA cloning experiment. Examples of the plots produced by the SequenceImp pipeline to summarise the analysis of small RNA. (A) Two plots taken from the reaper stage of the SequenceImp pipeline. These plots describe the ACTG-barcoded sample before Reaper trims and cleans the reads. (B) The length of reads for the ACTG barcoded sample, at the filter stage. Trimming in the reaper step defines a clear 20–23 nt peak in this sample. At the filter step reads can be selected for downstream analysis based on length. Solid bars correspond to those reads passed to the later stages of the pipeline. Hashed bars represent reads removed, falling outside the maximum and minimum length criteria. (C) Reads passed from the filter step which map to Ensembl annotation at the align stage of the pipeline are separated into individual annotation classes.
The filter step selects reads from each sample between 18 and 26 nt in length (Fig. 3B). These are subsequently mapped to the genome. Mapping information is summarised in a further set of plots and the 5′ ends of mapped reads are compared to Ensembl annotation [3] to give an impression of the genomic composition of each barcoded sample (Fig. 3C). As expected, in this case, the vast majority of mapped and annotated reads for each sample overlap miRNAs. Finally, in the features step, the complete genomic alignments are overlapped with miRBase mature miRNA annotations. Where reads overlap a miRNA locus by a specified number of nucleotides (15 or more), they are assigned to the miRNA and added to the miRNA count. These numbers may be fractions as reads mapping to more than one location may be split between loci according to the multi-mapping option specified.
The results are summarised below (Table 2).
Table 2.
Example miRNA counts for a single barcoded sample. The first column lists the miRBase mature miRNA sequence identified and the second identifies the hairpin sequence from which it originates. The last two columns specify the sequence depth identified for that molecule as both total sequencing depth and the total number of unique sequences identified. The count data here were requested to be split equally across loci for multi-mapping reads and hence are not whole numbers. A number of options for handling such occurrences are provided.
| Mature | Precursor | Width | ACTG_Read_Depth | ACTG_Non_Redundant_Reads |
|---|---|---|---|---|
| mmu-miR-126-3p | mmu-mir-126 | 22 | 239276.4 | 2239.9 |
| mmu-miR-30a-5p | mmu-mir-30a | 22 | 50122.1 | 917.6 |
| mmu-miR-378-3p | mmu-mir-378 | 21 | 69861.8 | 876.6 |
| mmu-miR-24-3p | mmu-mir-24-2;mmu-mir-24-1 | 22 | 26338 | 683.9 |
| mmu-miR-1a-3p | mmu-mir-1a-1;mmu-mir-1a-2 | 22 | 31360 | 553.1 |
| mmu-miR-30a-3p | mmu-mir-30a | 22 | 12362.4 | 504.2 |
| mmu-miR-148a-3p | mmu-mir-148a | 22 | 22958.4 | 503 |
| mmu-let-7c-5p | mmu-let-7c-2;mmu-let-7c-1 | 22 | 10408.7 | 470.3 |
| mmu-miR-499-5p | mmu-mir-499 | 21 | 18895.2 | 415.7 |
| mmu-let-7f-5p | mmu-let-7f-1;mmu-let-7f-2 | 22 | 13510.8 | 412.5 |
| mmu-miR-101a-3p | mmu-mir-101a | 21 | 11545.6 | 409.2 |
| mmu-miR-143-3p | mmu-mir-143 | 21 | 27757.1 | 389.2 |
| mmu-miR-30e-3p | mmu-mir-30e | 22 | 9638.3 | 380.1 |
| mmu-miR-26a-5p | mmu-mir-26a-1;mmu-mir-26a-2 | 22 | 7579.6 | 304.7 |
| mmu-let-7a-5p | mmu-let-7a-2;mmu-let-7a-1 | 22 | 4137.2 | 303.2 |
| mmu-miR-21-5p | mmu-mir-21 | 22 | 5798.6 | 258 |
| mmu-miR-30d-5p | mmu-mir-30d | 22 | 4554 | 252 |
| mmu-miR-30e-5p | mmu-mir-30e | 22 | 4446.7 | 249.4 |
| mmu-miR-133a-3p | mmu-mir-133a-2;mmu-mir-133a-1 | 22 | 1974.4 | 234.5 |
| mmu-miR-27b-3p | mmu-mir-27b | 21 | 4568.9 | 195.6 |
| mmu-miR-152-3p | mmu-mir-152 | 21 | 6701.7 | 192.2 |
| mmu-miR-10a-5p | mmu-mir-10a | 23 | 2923.8 | 180.9 |
| mmu-miR-125b-5p | mmu-mir-125b-1;mmu-mir-125b-2 | 22 | 3404 | 173.4 |
| mmu-miR-101b-3p | mmu-mir-101b | 21 | 2149.7 | 172.3 |
3.2. piRNA sequencing experiment with a 5′ barcode
These data are obtained from a piwi-associated RNA (piRNA) sequencing experiment. The sequence libraries once again have a 5′ barcode (Fig. 2B), with multiple samples being sequenced together using barcode multiplexing. In this case no sequence insert is included between the barcode and the RNA/DNA fragment during library preparation. The pipeline proceeds as above, using default parameters for Reaper, according to the read geometry, and a default configuration file for mouse piRNA analysis. In this case, however, multiple FASTQ files are processed simultaneously. Each raw file is annotated as a single line in the description file. Multi-processor threading allows the pipeline to perform the sequential reaper, filter, align and features steps in parallel for each of the FASTQ files accelerating the procedure across all data sets, if sufficient processors are available. For repeat analysis the final output of the features step differs to that described above, instead examining read length, distribution and overlap when mapped to repeat sequences (Fig. 4A). Currently repeat analysis is only supported for mouse but we hope to expand this to include other species.
Fig. 4.

Examples of additional Kraken features. Additional examples of the plots produced by the pipeline when analysing alternative datasets based upon different criteria. (A) A repeat analysis can be performed at the features step of the pipeline. This will align reads to repeat sequences (in this case LINE1 (GeneBank: M13002.1)) and calculate a series of metrics that can be used to identify signals apparent due to the presence of piRNAs within a sequencing sample. (B) Reaper can be applied with many different filtering and trimming options, here trimming 3′ adapter sequences, low complexity trailing sequences enriched in adenine, poor quality regions, sequences following regions enriched for N′s and removing reads that are subsequently less than 10 nt in length. The pie chart summarises the reasons for which reads were removed from the sample in their entirety (e.g. fall below the length threshold passed to Reaper). discarded_length_cutoff: adapter trimming reduced the length of read below the length threshold specified in the Reaper configuration file, discarded_tri: the trimming of low complexity regions reduced the length below the threshold, discarded_QQQ: trimming of low quality bases reduced the read length below the length threshold. (C) For paired end sequencing Tally identifies redundant read sequences at the filter step. This plot describes the reasons that Tally discards reads from each of the paired samples, while ensuring read pairing.
3.3. Small RNA sequencing with no barcode
This data set is obtained from the Hannon, Guigo and Gingeras laboratories as part of the ENCODE project [2] (Fig. 2D). The dataset GEO Accession is GSM973684. The sample preparation involved a poly-adenylation step and adenine represents a large proportion of bases found at each sequence position within the input file (Fig. 4B). To trim and clean up the FASTQ files prior to downstream analysis we applied additional filters within Reaper. Rather than using the default parameters provided within the pipeline for the geometry, user-defined options can be passed to Reaper. In this case we altered the parameters required for identifying a 3′ adapter match, added a minimum clean read length, initiated trimming based on quality score and trimmed low complexity sequences, enriched in adenine from the 3′ end of reads both before and after adapter removal (Fig. 4B).
Users can define their own pipeline analysis configurations by providing an edited experimental configuration file. In this case the configuration file directed the pipeline to user defined Reaper configurations.
3.4. Paired end RNA sequencing
Here we have filtered and trimmed a dataset which contains no barcode and no sequence inserts between the adapter sequences and the RNA/DNA fragment (Fig. 2C). The paired FASTQ files are passed to the pipeline together but processed individually at the reaper stage, with adapter sequences determined according to whether the file corresponds to the first or second sequencing reaction (Section 2.6). In contrast, at the filter stage, Tally filters and removes redundancy from each file simultaneously, pairing reads and reporting the number of reads removed through filters and file mismatches. These metrics are visualised by the pipeline (Fig. 4C).
When analyzing sequencing datasets, it is not always a trivial task to identify the adapter sequences used to derive the sequencing libraries. We used Minion to identify the adapter sequences in this paired-end, RNAseq data set. By comparing the sequences reported by Minion to known adapter sequences frequently used in sequence library preparation it is possible to confirm their origins. Once confirmed, these sequences can then be supplied to the pipeline in the sample description file, to be trimmed from the FASTQ files by Reaper.
4. Benchmarks
In order to assess the performance of the Kraken suite we have performed benchmarking of its key components and compared them to other widely-available tools with similar functionality. Benchmarking presents challenges as each method has its own parameters which can greatly affect performance. In general we have benchmarked at three different levels: Adapter removal in its simplest possible form, adapter removal combined with barcode resolution and adapter removal with advanced cleaning features (e.g. low-complexity sequence removal). Benchmarking was performed using a dataset comprising of four lanes of small RNA sequencing data containing 1, 5, 10 and 25 million sequences in four separate FASTQ files. Additionally, the parallel performance of the methods was assessed by running these analyses on 1, 2 and 4 processors. All analyses were performed using the local disk on a dedicated 24 processor Linux benchmarking machine. In all cases the input format was compressed FASTQ sequencing data and the output was also compressed FASTQ.
The benchmarking results indicate (Fig. 5) that the Kraken system outperforms all but one method. The fastest approach (btrim) [6] has few features except for simple adapter removal. Even given the disparity in terms of features, Reaper trimming is only 10.6% slower than Btrim (1.28 versus 1.42 million reads per minute, respectively) on average across the test samples sets (Fig. 5). The closest alternative tool was the FASTX toolkit (0.85 million reads per minute), which again has a rich feature set for trimming.
Fig. 5.

Read trimming and filtering benchmarking. (A) Run-time for a test benchmark dataset of 1, 5, 10 and 25 million reads for Reaper, Btrim, Cutadapt, FASTX and Adapter Removal. For each size the total runtime in seconds for each method is given. Input was in all cases provided as compressed FASTQ format and output was compressed on the fly. The same adapter sequence and barcode sequences were provided to each method. (B) Memory usage and run-time benchmark for a deduplication task for a FASTQ file with 65 M reads and 2.5G bases. Results are shown for Tally, Fastx_collapser, and a simple custom Perl program employing an associative array, including a Tally run where quality data was tracked for each deduplicated read (using the per-base maximum quality score across all duplicated reads).
Although a near trivial task, deduplication of large sequencing data can become a bottleneck due to memory pressure, or in the worst case, disk access. The Tally program described above is optimised for efficient memory allocation and hashing techniques and reduces memory by compressing sequences.
We sought to benchmark deduplication in terms of both memory and time and considered three different approaches. The first is Fastx_collapser, an efficient and fast program written in C++ and part of the FASTX toolkit. The second is Tally, part of Kraken. The third is a simple Perl program (provided at the Kraken website in the ‘supporting material’ section), which performs deduplication by means of an associative array. Perl associative arrays are heavily optimized and competing approaches should do at least as well. The dataset used for deduplication was the ENCODE cleaned dataset described above (Section 3.3) consisting of 65 M reads with 2.5 gigabases. The results (Fig. 5B) show that both Tally and Fastx_collapser outperform the simple Perl program, being both faster and using less memory. Tally however, uses less than a third of the memory required by fastx (Fig. 5B). Also shown are the measurements for a tally run on the same data where it kept track of quality scores for each deduplicated read. In this mode tally associates the highest quality score observed for each base in a read. This is highly useful as it may be beneficial when mapping singleton and low-count reads to have quality scores associated with them. Tally is still more memory efficient in this mode when compared to fastx_collapser. Finally, we remark that the fastx_collapser and tally run-times are entirely dominated by the reading and writing stages of processing, hence the memory requirements are most relevant. In practice we have processed paired-end data from multiple lanes with more than 20 gigabases, requiring more than 40 Gb of memory.
5. Conclusion
We present Kraken, a suite of tools for the analysis of next-generation sequencing datasets. These tools encompass adapter contaminant detection and removal (Minion and Reaper), cleaning of low-complexity and low-quality sequence tracts and other contaminants arising from sample preparation. The system supports multiplexed (barcoded) sample data and also complex sequence read geometries arising from different experimental protocols. The core tools can be accessed via an integrated pipeline for convenient high-throughput analysis of common data-types (SequenceImp). These tools have been designed to be lightweight and highly efficient in terms of memory usage and running time. All processing can be achieved using compressed sequence data and an additional tool (Tally) is capable of collapsing redundant sequence data allowing for smaller datasets. Benchmarking indicates that the core tools within Kraken are feature-rich without sacrificing performance and out-perform many existing tools. Detailed quality control metrics are provided together with useful downstream analyses for small RNA experiments (e.g. miRNAs and piRNAs). The tools together can be used as a stand-alone system to prepare samples and perform genomic mapping or used separately for dedicated tasks. We hope these tools will prove useful to the community.
6. Availability
Kraken and its component tools are freely available at http://www.ebi.ac.uk/research/enright/software/kraken under the GNU Public License (GPLv3).
Acknowledgements
We thank the members of the Enright lab for critical testing and feedback. Additionally we would like to thank Stathis Kanterakis, Ugis Sarkans, Maria Krestyaninova, Balaji Rajashekar, Raivo Kolde and Jaak Vilo for feedback on early test versions. Early versions of this software were funded by the EU FP7 (SIROCCO, LSHG-CT-2006-037900) and later versions and development have been supported by BBSRC UK (BB/01589X/1).
Footnotes
This is an open-access article distributed under the terms of the Creative Commons Attribution-NonCommercial-No Derivative Works License, which permits non-commercial use, distribution, and reproduction in any medium, provided the original author and source are credited.
References
- 1.Alon S., Vigneault F., Eminaga S., Christodoulou D.C., Seidman J.G., Church G.M., Eisenberg E. Genome Res. 2011;21(9):1506–1511. doi: 10.1101/gr.121715.111. [DOI] [PMC free article] [PubMed] [Google Scholar]
- 2.ENCODE Project Consortium PLoS Biol. 2011;9(4):e1001046. doi: 10.1371/journal.pbio.1001046. [DOI] [PMC free article] [PubMed] [Google Scholar]
- 3.Flicek P., Amode M.R., Barrell D., Beal K., Brent S., Chen Y. Nucl Acids Res. 2011;39:D800–D806. doi: 10.1093/nar/gkq1064. [DOI] [PMC free article] [PubMed] [Google Scholar]
- 4.Gentleman R.C., Carey V.J., Bates D.M., Bolstad B., Dettling M., Dudoit S. Genome Biol. 2004;5(10):R80. doi: 10.1186/gb-2004-5-10-r80. [DOI] [PMC free article] [PubMed] [Google Scholar]
- 5.Gunaratne P.H., Coarfa C., Soibam B., Tandon A. Methods Mol Biol (Clifton, NJ) 2012;822:273–288. doi: 10.1007/978-1-61779-427-8_19. [DOI] [PubMed] [Google Scholar]
- 6.Kong Y. Genomics. 2011;98(2):152–153. doi: 10.1016/j.ygeno.2011.05.009. [DOI] [PubMed] [Google Scholar]
- 7.Kozomara A., Griffiths-Jones S. Nucl Acids Res. 2011;39:D152–D157. doi: 10.1093/nar/gkq1027. [DOI] [PMC free article] [PubMed] [Google Scholar]
- 8.Langmead B., Salzberg S.L. Nat Methods. 2012;9(4):357–359. doi: 10.1038/nmeth.1923. [DOI] [PMC free article] [PubMed] [Google Scholar]
- 9.Li H., Handsaker B., Wysoker A., Fennell T., Ruan J., Homer N. Bioinformatics (Oxford, England) 2009;25:2078–2079. doi: 10.1093/bioinformatics/btp352. [DOI] [PMC free article] [PubMed] [Google Scholar]
- 10.Lindgreen S. BMC Res Notes. 2012;5(1):337. doi: 10.1186/1756-0500-5-337. [DOI] [PMC free article] [PubMed] [Google Scholar]
- 11.Lohse M., Bolger A.M., Nagel A., Fernie A.R., Lunn J.E., Stitt M., Usadel B. Nucl Acids Res. 2012;40(W1):W622–W627. doi: 10.1093/nar/gks540. [DOI] [PMC free article] [PubMed] [Google Scholar]
- 12.Martin M. EMBnet J. 2011;17(1):10–12. [Google Scholar]
- 13.Moxon S., Schwach F., Dalmay T., MacLean D., Studholme D.J., Moulton V. Bioinformatics (Oxford, England) 2008;24(19):2252–2253. doi: 10.1093/bioinformatics/btn428. [DOI] [PubMed] [Google Scholar]
- 14.Nekrutenko A., Taylor J. Nat Rev Genet. 2012;13(9):667–672. doi: 10.1038/nrg3305. [DOI] [PubMed] [Google Scholar]
- 15.Pevzner P.A., Tang H., Waterman M.S. Proc Natl Acad Sci USA. 2001;98(17):9748–9753. doi: 10.1073/pnas.171285098. [DOI] [PMC free article] [PubMed] [Google Scholar]
- 16.Taub M.A., Corrada Bravo H., Irizarry R.A. Genome Med. 2010;2(12):87. doi: 10.1186/gm208. [DOI] [PMC free article] [PubMed] [Google Scholar]