

Abstract
Objective
To investigate the association of prenatal mercury exposure and fish intake with ADHD-related behavior.
Design
Population-based prospective cohort study.
Setting
Birth cohort recruited 1993-1998 at main hospital in New Bedford, Massachusetts.
Participants
421 8-year old children with mercury measures (515 had fish consumption data).
Main Exposures
Mercury measured in peripartum maternal hair and fish consumption during pregnancy.
Main outcome measures
Inattentive and impulsive/hyperactive behaviors assessed with a teacher rating scale and neuropsychological testing.
Results
Median maternal hair mercury level was 0.45 μg/g (range=0.03-5.14) and 52% of mothers consumed >2 fish servings/week. In multivariable regression models mercury was associated with inattention and impulsivity/hyperactivity; for some outcomes there was an apparent threshold with associations at ≥1 μg/g mercury. For example, at ≥1 μg/g, the adjusted risk ratio (RR) for mild/markedly atypical DSM-IV Inattentive and Impulsive/Hyperactive behaviors was 1.4 (95% confidence interval (CI): 1.0, 1.8) and 1.7 (95% CI: 1.2, 2.4), respectively for an interquartile range (0.5 μg/g) mercury increase; there was no confounding by fish consumption. For neuropsychological assessments, mercury and behavior associations were detected primarily for boys. There was a protective association for fish consumption (>2 servings/week) with ADHD-related behaviors, particularly DSM-IV Impulsive/Hyperactive behaviors (RR=0.4; 95% CI: 0.2, 0.6).
Conclusions
Our results indicate that low-level prenatal mercury exposure is associated with greater risk for ADHD-related behaviors and that fish consumption during pregnancy is protective of these behaviors. These findings underscore the difficulties of balancing the benefits of fish with the detriments of low-level mercury in developing dietary recommendations in pregnancy.
INTRODUCTION
Childhood behavioral disorders are increasingly prevalent and result in substantial costs to families and society, with impacts on the educational system, quality of life and often on productivity into adulthood.1 ADHD is one of the most common neurodevelopmental disorders of childhood, affecting 8-12% of children worldwide2, yet the etiology is not well understood.3, 4 Increasing evidence supports associations between metals and ADHD-related behaviors, including prenatal and postnatal lead exposures.5-7
The developmental neurotoxicity of mercury is well-established, demonstrated by mass poisoning episodes in Japan8, 9 and Iraq.10 Central nervous system effects of mercury have been shown in animal models11, including changes in rodent dopaminergic function12, providing a biologic basis for effects on ADHD.13 Epidemiologic studies of lower-dose mercury exposure are inconsistent14, with some studies showing associations between mercury and ADHD-related behaviors15, 16 and others reporting null associations.17-20
Non-occupational methylmercury exposure results primarily from fish consumption, which led the US Environmental Protection Agency and Food and Drug Administration to issue a joint federal advisory recommending that pregnant women limit their total fish intake to no more than two 6-ounce servings/week.21 Fish is also a source of nutrients, such as omega-3 fatty acids, which have been shown to benefit brain development22-25, potentially confounding mercury-related risk estimates.26
We investigated the association of peripartum maternal hair mercury and prenatal fish intake with ADHD-related behaviors at 8 years of age in a prospective birth cohort.
METHODS
Study Population
The New Bedford cohort consists of 788 infants recruited at birth between 1993-1998 at the main hospital serving the greater New Bedford area. This study was designed to investigate the association between polychlorinated biphenyls (PCBs), which were discharged into the New Bedford harbor for decades prior to their ban in the U.S. in the 1970s, and neurodevelopment. Associations between PCBs and ADHD-related behaviors in infancy and at school age have been documented in New Bedford27, 28, despite low cord serum PCB levels compared with other PCB-exposed populations.29, 30
Eligible mothers were age 18+, resided in one of the four towns adjacent to the contaminated harbor (New Bedford, Acushnet, Fairhaven and Dartmouth) for at least the duration of pregnancy, and spoke English or Portuguese. Study infants were generally healthy at birth; eligibility requirements included ability to undergo neonatal examination and vaginal birth. We conducted neuropsychological assessments at approximately 8 years of age on 607 children (78% of those eligible for follow-up); 421 and 515 children had measures of maternal hair mercury and fish consumption, respectively. We excluded multiple births (n=3 children) from the current analysis.
Exposure Assessment
We collected and archived maternal hair at approximately 10 days postpartum. Total hair mercury (which approximates methylmercury) was analyzed at the Harvard School of Public Health Trace Metals Analysis Laboratory (Boston, MA). We cleaned hair using sonication, rinsed with distilled deionized water and dried at 60°C for 24 hr. We analyzed the 3 cm proximal to the scalp to represent mercury levels closer to the end of pregnancy.31 When the cut-end was indeterminable, a random 3 cm was analyzed. We performed analysis using a DMA-80 direct mercury analyzer (Milestone Inc., Monroe, CT). Samples were weighed in a nickel boat, thermally decomposed, amalgamated, and, via rapid heating of the amalgamator, released mercury was measured by atomic absorption spectroscopy with a limit of detection of 50 ng/g-1. Quality control measures included daily calibration verification with high and low concentration standards using GBW 07601 (human hair; Shanghai Institute of Nuclear Research, Academia Sinica, China), a procedural blank, and certified reference material CRM-397 (human hair: Community Bureau of Reference).
We collected data on prenatal fish consumption with a food frequency questionnaire (FFQ) administered shortly after the birth. The FFQ quantified consumption of dark fish (e.g., salmon, mackerel, bluefish, swordfish), tuna, including canned tuna, shellfish (e.g., lobster, clams), eel, and other fish. We summed these frequencies to estimate total fish servings/week.
Outcome Assessment
We assessed inattentive and impulsive behaviors using a rating scale and two neuropsychological tests. The Conners’ Rating Scale-Teachers (CRS-T)32 is a 59-item questionnaire used to evaluate problem behaviors. We analyzed three Diagnostic and Statistical Manual of Mental Disorders (DSM)-IV CRS-T subscales: 1) Inattentive, 2) Hyperactive-Impulsive, and 3) Total (subtypes combined). CRS-T scores were standardized to age- and sex-adjusted t-scores (mean=50, standard deviation=10); a higher score indicates more adverse behavior. For the Neurobehavioral Evaluation System 2 Continuous Performance Test (CPT)33, a computer-assisted exam, a random series of animal silhouettes are displayed and the child is instructed to press a button only upon the appearance of a cat, to respond as quickly as possible, and to refrain from pressing the button for another animal. We analyzed 4 components of the CPT: 1) mean response time (longer reflects inattention), 2) response time variability (standard deviation of response time, a measure of performance inconsistency that may represent fluctuations/lapses in attention), 3) errors of omission (non-responses), and 4) errors of commission (incorrect responses). We focused on two age-standardized subscales of the Wechsler Intelligence Scale for Children-Third Edition (WISC-III),34 a test that evaluates intellectual abilities, for which children with ADHD are found to score lowest: Processing Speed (includes coding and symbol search), and Freedom from Distractibility (includes digit span and arithmetic).
Statistical Analysis
We estimated associations for prenatal mercury and fish consumption with behavioral outcomes using multivariable regression. We log-transformed continuous CRS-T t-scores to better satisfy model assumptions (i.e., homoscedasticity) and fit multivariable linear regression models. To identify children with more extreme behavioral patterns suggestive of possible ADHD diagnosis, we dichotomized outcomes at the 86th percentile (T ≥ 61), which identifies children with mild to markedly atypical scores32, and used log risk models to estimate risk ratios (RRs). CPT mean reaction time and reaction time variability and WISC-III outcomes were approximately normally distributed, met regression model assumptions and were modeled with linear regression. CPT errors of omission and commission are Poisson distributed count data and were modeled with negative binomial regression models to correct for overdispersion (variance>mean). We expressed mercury-related effect estimates per interquartile range in exposure and dichotomized fish consumption at 2 servings/week. We explored non-linearity of mercury-outcome associations using non-parametric models.
We assessed sex differences in associations for prenatal mercury and fish consumption with behavioral outcomes by including an interaction term between sex and mercury/fish consumption in the model. For RRs we computed the Relative Excess Risk for Interaction (RERI) and associated confidence intervals35, which quantifies additive interaction on the RR scale, a better indication of biologic interaction.36
Data on covariates came from maternal and pediatric medical records and study questionnaires administered 2 weeks after birth and at the 8-year exam. The 8-year exam also included assessment of maternal intelligence and depression symptoms using the Kaufman Brief Intelligence Test (KBIT) and the Beck Depression Inventory (BDI), respectively, and family and home characteristics using the Home Observation for Measurement of the Environment (HOME).37 We used directed acyclic graphs38 (DAGs), causal diagrams based on a priori knowledge of relationships between variables of interest, to identify confounders39; all multivariable models included characteristics of the mother (age at child’s birth, prenatal smoking and alcohol consumption, illicit drug use in the year before the child’s birth, and, at the 8-year exam, education, marital status, IQ and depression) and the child (age at exam, sex and race) as well as household income, paternal education, and HOME37 score assessed at the time of the 8-year exam.
We investigated confounding by prenatal diet, including total fish consumption and intake of omega-3 polyunsaturated fatty acids, estimated using data from the FFQ. We also assessed the sensitivity of our results to ADHD medication use, 2-year blood Pb levels (from pediatric medical records) and cord serum PCB levels. We measured cord serum PCBs using gas chromatography, as described previously29, and represented PCBs as the sum of four prevalent congeners (118, 138, 153, and 180).
The study protocol was reviewed and approved by the Human Subjects Committees of Harvard School of Public Health and Brigham and Women’s Hospital, Boston, MA, and Southcoast Hospitals Group, New Bedford, MA. Written informed consent was obtained from all participating families before study evaluation.
RESULTS
For the 604 singleton births with an 8-year exam, 421 (70%) and 515 (85%) had prenatal mercury and fish consumption data, respectively. Summary statistics for mercury, fish consumption and outcome measures are presented in Table 1. As shown in Table 2, participants with maternal mercury levels (n=421) were similar to all participants with 8-year follow-up data (n=604), and were diverse with respect to sociodemographic indicators, including education (39% of mothers and 67% of fathers had no college education), household income (18% earned <$20,000/year), marital status (39% of mothers were unmarried) and race (26% of children are non-white). Child’s age at the 8-year exam ranged from 7-10 years. Table 2 also shows higher mercury levels among mothers who were older, married, had higher household income, did not smoke during pregnancy or use illicit drugs the year before birth, consumed more fish during pregnancy and had children of white race. Mercury-education associations were U-shaped, with higher levels among parents with the lowest and highest educational status. Mercury was also positively correlated with HOME score, prenatal omega-3 and fish servings/week, and cord serum PCBs, and inversely correlated with maternal depression symptoms.
TABLE 1.
Statistics for mercury, total fish consumption, and ADHD-related outcomes for 8-year old children born in New Bedford, 1993-1998.
| Exposure and outcome measures | N | Mean (SD) | Median | Range |
|---|---|---|---|---|
| Hair mercury (μg/g) | 421 | 0.62 (0.57) | 0.45 | 0.03 - 5.14 |
| Total fish consumption (servings/week) | 515 | 3.7 (3.9) | 2.3 | 0.0 - 22.6 |
| Conners Rating Scale – Teachers (CRS-T) | ||||
| DSM-IV Inattentive | 505 | 53.2 (10.5) | 50.0 | 40.0 - 89.0 |
| DSM-IV Impulsive/Hyperactive | 505 | 51.7 (10.1) | 47.0 | 42.0 - 90.0 |
| DSM-IV Total | 505 | 52.9 (10.0) | 50.0 | 41.0 - 89.0 |
| NES2 Continuous Performance Test (CPT) | ||||
| Mean Reaction Time (ms) | 511 | 648.7 (64.8) | 646.9 | 492.4 - 861.7 |
| Reaction Time Variability | 511 | 128.3 (30.8) | 127.4 | 57.5 - 393.9 |
| Errors of Omission | 511 | 2.3 (2.2) | 2.0 | 0.0 - 14.0 |
| Errors of Commission | 511 | 2.3 (2.6) | 1.0 | 0.0 - 14.0 |
| Wechsler Intelligence Scale for Children – Third Edition (WISC-III) | ||||
| Processing speed | 515 | 104.6 (14.6) | 104.0 | 58.0 - 146.0 |
| Freedom from Distractibility | 515 | 98.6 (12.7) | 98.0 | 50.0 - 134.0 |
Abbreviations: SD=standard deviation; ms=milliseconds.
TABLE 2.
Study characteristics for all children with 8-year data (n=604) vs. those with maternal hair mercury data (n=421), and unadjusted associations with maternal hair mercury levels in New Bedford, 1993-1998.
| N = 604 with 8-year data
|
N = 421 with 8-year data and maternal mercury data
|
|||||||||
|---|---|---|---|---|---|---|---|---|---|---|
| Hair mercury (μg/g)
|
||||||||||
| N | % | Mean (SD) | N | % | Mean (SD) | Mean | Median | Range (μg/g) | p-value* | |
| Maternal age at child’s birth (years) | ||||||||||
| <20 | 79 | 13.1 | 56 | 13.3 | 0.37 | 0.31 | 0.04 - 1.12 | <0.01 | ||
| 20-29 | 317 | 52.5 | 209 | 49.6 | 0.56 | 0.40 | 0.03 - 3.27 | |||
| 30-34 | 131 | 21.7 | 100 | 23.8 | 0.76 | 0.57 | 0.09 - 5.14 | |||
| 35+ | 77 | 12.8 | 56 | 13.3 | 0.79 | 0.62 | 0.07 - 3.14 | |||
| Maternal education at child’s 8-year exam | ||||||||||
| <12th grade | 65 | 10.9 | 34 | 8.2 | 0.83 | 0.64 | 0.13 - 3.27 | 0.03 | ||
| H.S. graduate | 193 | 32.3 | 127 | 30.5 | 0.54 | 0.42 | 0.04 - 5.14 | |||
| Some college | 340 | 56.9 | 255 | 61.3 | 0.63 | 0.46 | 0.03 - 3.09 | |||
| Missing | 6 | 5 | ||||||||
| Paternal education at child’s 8-year exam | ||||||||||
| <12th grade | 140 | 24.4 | 95 | 23.5 | 0.65 | 0.47 | 0.09 - 5.14 | <0.01 | ||
| H.S. graduate | 247 | 43.0 | 176 | 43.5 | 0.53 | 0.41 | 0.03 - 3.14 | |||
| Some college | 188 | 32.7 | 134 | 33.1 | 0.73 | 0.52 | 0.07 - 3.09 | |||
| Missing | 29 | 16 | ||||||||
| Annual household income at child’s 8-year exam | ||||||||||
| <$20,000 | 124 | 20.8 | 74 | 17.8 | 0.54 | 0.30 | 0.03 - 5.14 | 0.09 | ||
| $20-39,999 | 165 | 27.7 | 112 | 27.0 | 0.56 | 0.41 | 0.03 - 3.27 | |||
| ≥$40,000 | 307 | 51.5 | 229 | 55.2 | 0.67 | 0.52 | 0.05 - 3.04 | |||
| Missing | 8 | 6 | ||||||||
| Maternal marital status at child’s 8-year exam | ||||||||||
| Married | 353 | 58.4 | 257 | 61.0 | 0.68 | 0.49 | 0.04 - 5.14 | <0.01 | ||
| Unmarried | 251 | 41.6 | 164 | 39.0 | 0.51 | 0.38 | 0.03 - 3.09 | |||
| Maternal smoking during pregnancy | ||||||||||
| Non-smoker | 394 | 70.4 | 277 | 66.6 | 0.68 | 0.51 | 0.04 - 5.14 | <0.01 | ||
| 1-10 cigarettes/day | 122 | 21.8 | 102 | 24.5 | 0.49 | 0.38 | 0.03 - 3.04 | |||
| >10 cigarettes/day | 44 | 7.9 | 37 | 8.9 | 0.50 | 0.37 | 0.03 - 1.52 | |||
| Missing | 44 | 5 | ||||||||
| Maternal illicit drug use in year prior to birth | ||||||||||
| No | 439 | 85.6 | 352 | 85.6 | 0.64 | 0.48 | 0.03 - 5.14 | 0.05 | ||
| Yes | 74 | 14.4 | 59 | 14.4 | 0.49 | 0.37 | 0.03 - 2.59 | |||
| Missing | 91 | 10 | ||||||||
| Maternal local fish consumption during pregnancy | ||||||||||
| No | 459 | 89.1 | 367 | 88.9 | 0.62 | 0.44 | 0.03 - 5.14 | 0.73 | ||
| Yes | 56 | 10.9 | 46 | 11.1 | 0.59 | 0.54 | 0.17 - 1.49 | |||
| Missing | 89 | 8 | ||||||||
| Maternal total fish consumption during pregnancy | ||||||||||
| ≤2 servings/week | 248 | 48.2 | 196 | 47.5 | 0.55 | 0.36 | 0.04 - 3.27 | 0.03 | ||
| >2 servings/week | 267 | 51.8 | 217 | 52.5 | 0.68 | 0.53 | 0.03 - 5.14 | |||
| Missing | 89 | 8 | ||||||||
| Child’s Sex | ||||||||||
| Female | 296 | 49.0 | 209 | 49.6 | 0.62 | 0.45 | 0.03 - 5.14 | 0.82 | ||
| Male | 308 | 51.0 | 212 | 50.4 | 0.61 | 0.44 | 0.03 - 3.14 | |||
| Child’s race | ||||||||||
| White | 411 | 69.3 | 308 | 74.2 | 0.67 | 0.51 | 0.05 - 5.14 | <0.01 | ||
| Non-white | 182 | 30.7 | 107 | 25.8 | 0.47 | 0.36 | 0.03 - 3.09 | |||
| Missing | 11 | 6 | ||||||||
| Spearman Correlation Coefficient
|
||||||||||
| r
|
p-value
|
|||||||||
| Child’s age at exam | 603 | 8.2 (0.6) | 421 | 8.2 (0.6) | -0.04 | 0.42 | ||||
| Maternal IQ | 600 | 97.9 (10.4) | 419 | 98.7 (10.2) | 0.05 | 0.26 | ||||
| Maternal depression | 601 | 8.3 (8.8) | 419 | 8.0 (8.5) | -0.17 | <0.01 | ||||
| HOME score | 589 | 45.6 (5.4) | 410 | 45.8 (5.4) | 0.19 | <0.01 | ||||
| Omega3 intake (gm/month) | 509 | 28.5 (15.0) | 413 | 28.4 (14.9) | 0.20 | <0.01 | ||||
| Fish intake (servings/week) | 515 | 3.7 (3.9) | 413 | 3.7 (3.8) | 0.32 | <0.01 | ||||
| Cord serum PCBs (ng/g) | 587 | 0.3 (0.3) | 406 | 0.3 (0.3) | 0.42 | <0.01 | ||||
Abbreviations: SD=standard deviation; ng/g=nanograms per gram serum.
p-value for unadjusted covariate-mercury association from ANOVA.
Mercury and ADHD
Several ADHD-related endpoints had non-linear associations with hair mercury levels. Figure 1, which shows the covariate-adjusted association between prenatal hair mercury and log-transformed CRS-T DSM-IV total t-score from a penalized spline40, demonstrates an apparent threshold for exposure-response at approximately 1 μg/g. For outcomes with this threshold exposure-response pattern, we used piecewise linear regression, which produces separate mercury-behavior associations at mercury levels <1 μg/g (n=355) and ≥1 μg/g (n=66).
Figure 1.
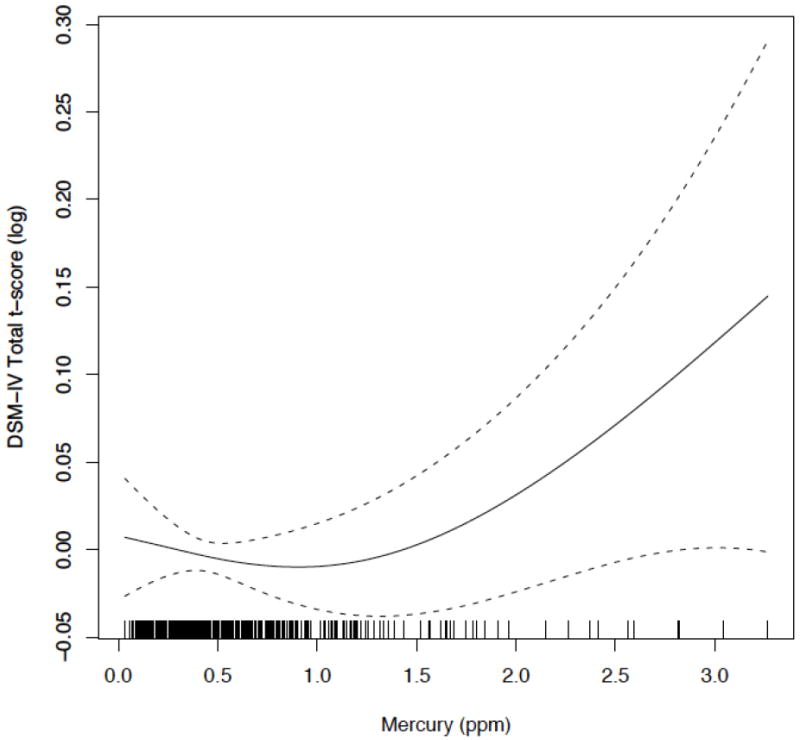
Penalized spline of the adjusted association of perinatal maternal hair mercury with log-transformed DSM-IV Total t-score (centered on 0) from the CRS-T for 8-year old children born in New Bedford, 1993-1998.
Unadjusted and adjusted associations between prenatal hair mercury and ADHD-related behaviors are reported in Table 3. Mercury and CRS-T associations were consistent for continuous and dichotomized CRS-T scores; we present RRs for the dichotomized CRS-T in Table 3 for ease of interpretation. We detected an apparent threshold at mercury levels of 1 μg/g for the CRS-T and piecewise regression suggested a slightly protective association between mercury and inattentive, impulsive/hyperactive and combined behaviors with increasing mercury levels up to 1 μg/g, and an increase in risk for these behaviors with increasing mercury levels ≥1 μg/g, particularly for impulsivity/hyperactivity (adjusted RR for an interquartile range (IQR) increase in mercury=1.7; 95% CI: 1.2, 2.4). Higher hair mercury was also associated with higher risk for errors of commission (RR=1.1; 95% CI: 1.0, 1.2) and lower scores on the WISC subscales, particularly processing speed (β=-1.5; 95% CI: -2.9, -0.1).
Table 3.
Unadjusted and adjusted associations between hair Hg and ADHD-like behaviors, for 8-year-old children born in New Bedford, 1993-1998.
| Mercury Categories |
Unadjusted
|
Adjusted *
|
Adjusted* + fish consumption†
|
||||
|---|---|---|---|---|---|---|---|
| Outcome Measure | N | β or RR (95% CI) | N | β or RR (95% CI) | N | β or RR (95% CI) | |
| Conners Rating Scale – Teachers (CRS-T) dichotomized at 86th percentile | |||||||
| DSM-IV Inattentive (RR) | < 1 μg/g‡ | 412 | 0.7 (0.5, 0.9) | 362 | 0.8 (0.5, 1.1) | 362 | 0.8 (0.6, 1.2) |
| 1+ μg/g‡ | 1.3 (1.0, 1.6) | 1.4 (1.0, 1.8) | 1.3 (1.0, 1.7) | ||||
| DSM-IV Impuls/Hyper (RR) | < 1 μg/g‡ | 412 | 0.6 (0.4, 0.8) | 362 | 0.8 (0.5, 1.2) | 362 | 0.8 (0.5, 1.3) |
| 1+ μg/g‡ | 1.6 (1.3, 2.0) | 1.7 (1.2, 2.4) | 1.6 (1.1, 2.4) | ||||
| DSM-IV Total (RR) | < 1 μg/g‡ | 412 | 0.6 (0.4, 0.8) | 362 | 0.7 (0.5, 1.0) | 362 | 0.7 (0.5, 1.1) |
| 1+ μg/g‡ | 1.5 (1.2, 1.8) | 1.6 (1.2, 2.1) | 1.5 (1.1, 2.0) | ||||
| NES2 Continuous Performance Test (CPT) | |||||||
| Mean Reaction Time (β) | < 1 μg/g‡ | 417 | -8.6 (-20.4, 3.2) | 359 | -9.6 (-22.9, 3.8) | 359 | -11.9 (-25.7, 1.8) |
| 1+ μg/g‡ | 6.5 (-2.8, 15.7) | 2.5 (-9.5, 14.5) | 3.6 (-8.5, 15.7) | ||||
| Reaction Time Variability (β) | < 1 μg/g‡ | 417 | -3.9 (-9.3, 1.5) | 359 | -3.1 (-8.7, 2.4) | 359 | -3.0 (-8.8, 2.7) |
| 1+ μg/g‡ | 3.5 (-0.7, 7.8) | 4.7 (-0.3, 9.7) | 4.6 (-0.4, 9.7) | ||||
| Errors of Omission (RR) | continuous | 417 | 1.0 (0.9, 1.1) | 359 | 1.0 (0.9, 1.2) | 359 | 1.0 (0.9, 1.2) |
| Errors of Commission (RR) | continuous | 417 | 1.0 (1.0, 1.1) | 359 | 1.1 (1.0, 1.2) | 359 | 1.1 (1.0, 1.2) |
| Wechsler Intelligence Scale for Children – Third Edition (WISC-III) | |||||||
| Processing speed (β) | continuous | 421 | -0.5 (-1.7, 0.7) | 362 | -1.5 (-2.9, -0.1) | 362 | -1.6 (-3.0, -0.2) |
| Freedom from Distractibility (β) | continuous | 421 | -0.5 (-1.5, 0.5) | 362 | -0.9 (-2.2, 0.3) | 362 | -1.0 (-2.2, 0.3) |
Abbreviations: RR=risk/rate ratio for an interquartile range increase (75%ile-25%ile=0.48 μg/g) in Hg; β=change in outcome score for an interquartile range increase in Hg; CI=confidence interval.
Adjusted for child’s age (continuous), sex and race (white vs. non-white), maternal age (continuous), education (<12 years vs. 12+ years), marital status (married vs. unmarried), IQ (continuous), depression symptoms (continuous), prenatal smoking (yes/no and average # cigarettes per day), prenatal alcohol consumption (yes/no and average grams per day) and illicit drug use (ever vs. never during year before birth), paternal education (<12 years vs. 12+ years), household income (<$20,000 per year vs. $20,000+ per year) and HOME score (continuous).
Total fish consumption:(>2 servings/week vs. ≤2 servings/week).
Modeled using piecewise linear regression, producing separate slopes at <1 μg/g and 1+ μg/g hair mercury.
Adjusting for total fish consumption (Table 3) and omega 3 intake (data not shown) did not consistently change associations between mercury and ADHD-related endpoints. PCBs, though moderately correlated with mercury (r=0.42), neither confounded nor modified mercury-ADHD associations (data not shown). Finally, adjusting for two-year Pb levels and excluding children who were treated with ADHD medications (n=26) did not change associations between mercury and endpoints (data not shown).
Sex differences
Table 4 reports sex-specific effect estimates generated using a single model with a mercury*sex interaction term. Mercury and CRS-T associations were similar across sex, and RERI estimates were close to 0, indicating no interaction on the additive scale (the same pattern was found using raw CRS-T scores that were not sex and age standardized.) Estimates were most notably different across sex for the CPT errors of omission and WISC outcomes, especially Processing Speed where associations were considerably stronger among males (β=-4.0; 95% CI: -6.0, -1.9) than females (β=0.2; 95% CI: -1.6, 2.0). The interpretation of the RERI for CPT errors of omission is that there is a 0.4 (95% CI: -0.1, 0.8) increase in the RR of an error over what the RR would be if there was no interaction between mercury and sex. Protective associations between mercury at levels <1 μg/g and CPT Reaction Time (faster Mean Reaction Time, lower Reaction Time Variability) were found among girls.
Table 4.
Sex-specific associations of hair Hg with ADHD-like behaviors, for 8-year-old children born in New Bedford, 1993-1998.
| All children
|
Females
|
Males
|
Sex Interaction p-value |
RERI | |||
|---|---|---|---|---|---|---|---|
| Mercury Categories |
Adjusted*
|
Adjusted*
|
Adjusted*
|
||||
| Outcome Measure | N | β or RR (95% CI) | β or RR (95% CI) | β or RR (95% CI) | |||
| Conners Rating Scale – Teachers (CRS-T) dichotomized at 86th percentile | |||||||
| DSM-IV Inattentive (RR) | < 1 μg/g† | 362 | 0.8 (0.5, 1.1) | 0.8 (0.5, 1.3) | 0.7 (0.4, 1.3) | 0.90 | 0.0 (-1.2, 3.3) |
| 1+ μg/g† | 1.4 (1.0, 1.8) | 1.4 (1.0, 1.9) | 1.3 (0.8, 2.1) | -0.45 (-3.8, 3.4) | |||
| DSM-IV Impuls/Hyper (RR) | < 1 μg/g† | 362 | 0.8 (0.5, 1.2) | 0.9 (0.5, 1.6) | 0.6 (0.3, 1.3) | 0.72 | -0.1 (-3.8, 5.8) |
| 1+ μg/g† | 1.7 (1.2, 2.4) | 1.5 (0.9, 2.4) | 2.1 (1.2, 3.6) | 0.3 (-4.1, 7.0) | |||
| DSM-IV Total (RR) | < 1 μg/g† | 362 | 0.7 (0.5, 1.0) | 0.7 (0.4, 1.2) | 0.6 (0.3, 1.3) | 0.97 | 0.1 (-1.2, 3.5) |
| 1+ μg/g† | 1.6 (1.2, 2.1) | 1.5 (1.1, 2.2) | 1.6 (0.9, 2.8) | -0.4 (-4.6, 5.5) | |||
| NES2 Continuous Performance Test (CPT) | |||||||
| Mean Reaction Time (β) | < 1 μg/g† | 359 | -9.6 (-22.9, 3.8) | -20.7 (-38.2, -3.2) | 2.1 (-17.1, 21.3) | 0.01 | |
| 1+ μg/g† | 2.5 (-9.5, 14.5) | -2.6 (-17.7, 12.6) | 13.0 (-6.6, 32.6) | ||||
| Reaction Time Variability (β) | < 1 μg/g† | 359 | -3.1 (-8.7, 2.4) | -7.5 (-14.9, -0.2) | 1.7 (-6.3, 9.8) | 0.09 | |
| 1+ μg/g† | 4.7 (-0.3, 9.7) | 4.1 (-2.2, 10.5) | 6.2 (-2.0, 14.4) | ||||
| Errors of Omission (RR) | continuous | 359 | 1.0 (0.9, 1.2) | 0.9 (0.8, 1.1) | 1.2 (1.0, 1.4) | 0.06 | 0.4 (-0.1, 0.8) |
| Errors of Commission (RR) | continuous | 359 | 1.1 (1.0, 1.2) | 1.1 (1.0, 1.2) | 1.1 (1.0, 1.3) | 0.68 | 0.1 (-0.2, 1.0) |
| Wechsler Intelligence Scale for Children – Third Edition (WISC-III) | |||||||
| Processing speed (β) | continuous | 362 | -1.5 (-2.9, -0.1) | 0.2 (-1.6, 2.0) | -4.0 (-6.0, -1.9) | <0.01 | |
| Freedom from Distractibility (β) | continuous | 362 | -0.9 (-2.2, 0.3) | 0.3 (-1.3, 1.9) | -2.6 (-4.5, -0.7) | 0.02 | |
Abbreviations: RR=risk/rate ratio for an interquartile range increase (75%ile-25%ile=0.48 μg/g) in Hg; β=change in outcome score for an interquartile range increase in Hg; CI=confidence interval; RERI=Relative Excess Risk due to Interaction.
Adjusted for child’s age (continuous), sex and race (white vs. non-white), maternal age (continuous), education (<12 years vs. 12+ years), marital status (married vs. unmarried), IQ (continuous), depression symptoms (continuous), prenatal smoking (yes/no and average # cigarettes per day), prenatal alcohol consumption (yes/no and average grams per day) and illicit drug use (ever vs. never during year before birth), paternal education (<12 years vs. 12+ years), household income (<$20,000 per year vs. $20,000+ per year) and HOME score (continuous).
Modeled using piecewise linear regression, producing separate slopes at <1 μg/g and 1+ μg/g hair mercury.
Maternal fish consumption and ADHD
We found strong protective associations for prenatal fish consumption with CRS-T outcomes (Table 5), particularly for DSM-IV Impulsivity/Hyperactivity (adjusted RR for a score above the 86th percentile = 0.4; 95% CI: 0.2, 0.6 for >2 vs. ≤2 fish servings/week). After adjusting for mercury and other covariates, fish consumption was associated with higher scores for the WISC outcomes, particularly Processing Speed (β=2.0; 95% CI: -0.8, 4.8). We did not see protective associations for the CPT outcomes, but rather slightly higher risk for errors of commission (RR=1.1; 95% CI: 0.9, 1.3) with >2 vs. ≤2 servings/week. There were no consistent differences in the association between fish consumption and ADHD-related behaviors by sex.
Table 5.
Unadjusted and adjusted associations of fish consumption with ADHD-like behaviors, for 8-year-old children born in New Bedford, 1993-1998.
| Fish Consumption servings/week |
Unadjusted Model
|
Adjusted*
|
Adjusted + Hg†
|
||||
|---|---|---|---|---|---|---|---|
| Outcome Measure | N | β or RR (95% CI) | N | β or RR (95% CI) | N | β or RR (95% CI) | |
| Conners Rating Scale - Teachers (CRS-T) dichotomized at 86th percentile | |||||||
| DSM-IV Inattentive (RR) | ≤ 2 | 245 | reference | 222 | reference | 173 | reference |
| > 2 | 260 | 0.8 (0.6, 1.0) | 235 | 0.6 (0.4, 0.8) | 189 | 0.6 (0.4, 0.9) | |
| DSM-IV Impuls/Hyper (RR) | ≤ 2 | 245 | reference | 222 | reference | 173 | reference |
| > 2 | 266 | 0.5 (0.3, 0.8) | 235 | 0.4 (0.2, 0.6) | 189 | 0.4 (0.2, 0.6) | |
| DSM-IV Total (RR) | ≤ 2 | 245 | reference | 222 | reference | 173 | reference |
| > 2 | 260 | 0.7 (0.5, 1.0) | 235 | 0.5 (0.4, 0.7) | 189 | 0.6 (0.4, 0.9) | |
| NES2 Continuous Performance Test (CPT) | |||||||
| Mean Reaction Time (β) | ≤ 2 | 245 | reference | 219 | reference | 170 | reference |
| > 2 | 266 | 5.9 (-5.3, 17.1) | 235 | 7.7 (-3.8, 19.3) | 189 | 10.1 (-3.9, 24.1) | |
| Reaction Time Variability (β) | ≤ 2 | 245 | reference | 219 | reference | 170 | reference |
| > 2 | 266 | 3.6 (-1.8, 8.9) | 235 | 1.5 (-3.6, 6.7) | 189 | -0.5 (-6.3, 5.4) | |
| Errors of Omission (RR) | ≤ 2 | 245 | reference | 219 | reference | 170 | reference |
| > 2 | 266 | 1.1 (0.9, 1.3) | 235 | 1.0 (0.8, 1.3) | 189 | 0.9 (0.7, 1.2) | |
| Errors of Commission (RR) | ≤ 2 | 245 | reference | 219 | reference | 170 | reference |
| > 2 | 266 | 1.2 (1.0, 1.3) | 235 | 1.1 (1.0, 1.3) | 189 | 1.1 (0.9, 1.3) | |
| Wechsler Intelligence Scale for Children – Third Edition (WISC-III) | |||||||
| Processing speed (β) | ≤ 2 | 248 | reference | 222 | reference | 173 | reference |
| > 2 | 267 | -0.4 (-2.9, 2.2) | 235 | 1.3 (-1.2, 3.8) | 189 | 2.0 (-0.8, 4.8) | |
| Freedom from Distractibility (β) | ≤ 2 | 248 | reference | 222 | reference | 173 | reference |
| > 2 | 267 | -0.8 (-3.0, 1.4) | 235 | 0.3 (-1.9, 2.6) | 189 | 1.5 (-1.1, 4.0) | |
Abbreviations: RR=risk/rate ratio; β=change in outcome score; CI=confidence interval.
Adjusted for child’s age (continuous), sex and race (white vs. non-white), maternal age (continuous), education (<12 years vs. 12+ years), marital status (married vs. unmarried), IQ (continuous), depression symptoms (continuous), prenatal smoking (yes/no and average # cigarettes per day), prenatal alcohol consumption (yes/no and average grams per day) and illicit drug use (ever vs. never during year before birth), paternal education (<12 years vs. 12+ years), household income (<$20,000 per year vs. $20,000+ per year) and HOME score (continuous).
Hair mercury was modeled with piecewise linear regression (cutpoint at 1 μg/g) for Conners Rating Scale-Teachers outcomes and CPT mean reaction time and reaction time variability, and as a continuous variable for CPT errors and WISC outcomes.
DISCUSSION
In this population-based prospective cohort study, prenatal hair mercury levels were consistently associated with ADHD-related behaviors, including inattention and hyperactivity/impulsivity. We also found that higher prenatal fish consumption was protective with respect to these behaviors. Results are supported by data from a well-characterized birth cohort with prospectively measured exposure and covariate data, including important confounders.
Hair is a well-established biomarker of methylmercury and maternal hair mercury levels correlate well with fetal brain and blood mercury.41 Median hair mercury levels for this cohort were higher (0.45 μg/g) than levels reported among women of childbearing age during 1999-2000 in the National Health and Nutrition Examination Survey (NHANES) (geometric mean=0.12 μg/g), though comparable to levels in NHANES participants that were frequent fish consumers (geometric mean=0.38 μg/g).42
There is uncertainty concerning the effect of low-level mercury on neurodevelopment.14 Two seminal studies of prenatal mercury exposure report inconsistent results with respect to behavioral outcomes. For 1,022 children born in the Faroe Islands during 1986-1987 with high mercury levels (geometric mean=22.9 μg/l in cord blood, 4.27 μg/g in maternal hair), higher cord blood mercury was associated with more errors of omission and longer mean reaction time on the NES2 CPT at 7 and 14 years of age.15, 43 In contrast, a study of 779 children born in the Seychelles Islands during 1989-1990 with high mercury levels (mean=6.8 μg/g in maternal hair) reported null associations with neurodevelopmental outcomes, including measures from the Child Behavior Checklist, the Conners’ CPT, and improved scores on the impulsivity/hyperactivity index of the CRS-T.17, 19, 20 Mixed results have also been reported in other studies of mercury and behavior.16, 18, 44
One explanation for inconsistency is that nutrients in fish that promote neurodevelopment, such as omega-3 fatty acids, may offset the neurotoxicant effects of mercury exposure26; this is supported by previous studies that report enhanced deleterious associations between mercury and neuropsychological endpoints after adjusting for fish consumption (benefits of fish consumption were also stronger after adjusting for mercury)25, 45, and by a second study in the Seychelles Islands that reported deleterious mercury effects on neurodevelopment only after adjusting for omega-3 and omega-6 fatty acids measured in prenatal maternal blood.46, 47 Adjusting for fish consumption (or omega-3 intake) did not change mercury-behavior associations in the current study. Measurement error in collecting self-reported dietary intake of fish and related nutrients may have resulted in residual confounding by these factors. In addition, the degree of confounding by fish consumption is likely a function of the fish species (and their respective nutrient content) consumed by the study population. Fish consumption was associated with better behavioral scores for most of our study outcomes, however, and for the CRS-T outcomes in particular. Notably these associations were protective for fish consumption during pregnancy >2 servings/week, which is higher than the FDA-EPA federal advisory limit.21 Adjusting for mercury enhanced the protective association for fish consumption with WISC-III outcomes. Previous studies report associations between greater childhood omega-3 fatty acid intake and reduced risk of ADHD, though mostly in the context of alleviating clinical ADHD symptoms.48 To our knowledge this is the first study to report a protective association of prenatal fish consumption with offspring ADHD-related behavior.
We previously reported associations of PCBs with ADHD-related behaviors in this cohort.27, 28 Though PCBs were moderately correlated with mercury, adjusting for PCBs did not change mercury-ADHD associations. We did not find an interaction between PCBs and mercury on ADHD-related behavior, in contrast to two previous studies of cognitive and behavioral outcomes. 49, 50
For the CRS-T outcomes and CPT reaction time threshold associations between mercury and ADHD-related behavior were detected at approximately 1 μg/g. This is consistent with a study of hair mercury and neurodevelopment that also found a threshold for adverse effects between 0.5 and 1 μg/g.51 In addition, the U.S. EPA reference dose for mercury (0.1 μg/kg/day)31 is equivalent to 1.2 μg/g in hair52, which is roughly the level for the threshold we report in this study. We detected slightly protective associations of mercury with ADHD-related behavior at mercury levels <1 μg/g. Because fish is the main source of mercury, this may reflect the beneficial effect of fish consumption, which may have been inadequately adjusted due to measurement error. At higher mercury levels (≥1 μg/g) these nutritional benefits may have been outweighed by neurotoxicity from mercury exposure.
We detected sex differences for mercury and some ADHD-related behaviors, with associations found primarily among boys. Previous studies have reported stronger mercury-related associations among boys vs. girls.15, 19, 53 Though the mechanism underlying sex differences in exposure-related neurotoxicity is unknown, a growing literature shows differences in the impact of endocrine disrupting chemicals (including mercury) on neurodevelopment among males and females54, such as Bisphenol A55 and phthalates.56
We did not assess clinical ADHD diagnosis in this study. Though common, clinically diagnosed ADHD is too rare to study in moderate-sized prospective population-based samples. Measuring behavior on a continuum in this study has several advantages, including: 1) minimization of bias due to outcome misclassification, where categorization is often made at an arbitrary cutoff point that may change over time, 2) detection of early or milder manifestations of a disorder that a clinical diagnosis could miss, and 3) enhancement of power to detect an effect of exposure.57 A limitation of using the CPT and WISC-III outcomes as markers for inattentive and hyperactive/impulsive behaviors is that these outcomes may also reflect other skills that could compromise or enhance resulting scores for these neuropsychological tests.
CONCLUSION
In summary, our results suggest that prenatal mercury exposure is associated with higher risk for ADHD-related behaviors, and fish consumption during pregnancy is associated with lower risk for these behaviors. While a single estimate combining these beneficial vs. detrimental effects vis-à-vis fish intake is not possible with our data, these findings are consistent with a growing literature showing risk of mercury and benefits of maternal consumption of fish on fetal brain development and are important for informing dietary recommendations for pregnant women.
Acknowledgments
grant information:
We thank Cristina Kehoe and Wendy Atkinson for data collection; Diane Sredl, Changzhong Chen, Catrina Crociani and Elizabeth Wood for database management and programming; Debbie Raposo and the Labor and Delivery staff at St. Luke’s Hospital for support on data collection; and Nick Lupoli for conducting the mercury analyses. This study was supported by grants P42 ES005947, P42 ES016454, R01 ES014864 and R03 ES016604 from the National Institute of Environmental Health Sciences, NIH.
References
- 1.Brauner CB, Stephens CB. Estimating the prevalence of early childhood serious emotional/behavioral disorders: challenges and recommendations. Public Health Rep. 2006 May-Jun;121(3):303–310. doi: 10.1177/003335490612100314. [DOI] [PMC free article] [PubMed] [Google Scholar]
- 2.Faraone SV, Sergeant J, Gillberg C, Biederman J. The worldwide prevalence of ADHD: is it an American condition? World Psychiatry. 2003 Jun;2(2):104–113. [PMC free article] [PubMed] [Google Scholar]
- 3.Biederman J, Faraone SV. Attention-deficit hyperactivity disorder. Lancet. 2005 Jul 16-22;366(9481):237–248. doi: 10.1016/S0140-6736(05)66915-2. [DOI] [PubMed] [Google Scholar]
- 4.Rowland AS, Lesesne CA, Abramowitz AJ. The epidemiology of attention-deficit/hyperactivity disorder (ADHD): a public health view. Ment Retard Dev Disabil Res Rev. 2002;8(3):162–170. doi: 10.1002/mrdd.10036. [DOI] [PubMed] [Google Scholar]
- 5.Bellinger D, Leviton A, Allred E, Rabinowitz M. Pre- and postnatal lead exposure and behavior problems in school-aged children. Environ Res. 1994 Jul;66(1):12–30. doi: 10.1006/enrs.1994.1041. [DOI] [PubMed] [Google Scholar]
- 6.Braun JM, Kahn RS, Froehlich T, Auinger P, Lanphear BP. Exposures to environmental toxicants and attention deficit hyperactivity disorder in U.S. children. Environ Health Perspect. 2006 Dec;114(12):1904–1909. doi: 10.1289/ehp.9478. [DOI] [PMC free article] [PubMed] [Google Scholar]
- 7.Needleman HL, Gunnoe C, Leviton A, et al. Deficits in psychologic and classroom performance of children with elevated dentine lead levels. N Engl J Med. 1979 Mar 29;300(13):689–695. doi: 10.1056/NEJM197903293001301. [DOI] [PubMed] [Google Scholar]
- 8.Harada M. Congenital Minamata disease: intrauterine methylmercury poisoning. Teratology. 1978 Oct;18(2):285–288. doi: 10.1002/tera.1420180216. [DOI] [PubMed] [Google Scholar]
- 9.Harada M. Minamata disease: methylmercury poisoning in Japan caused by environmental pollution. Crit Rev Toxicol. 1995;25(1):1–24. doi: 10.3109/10408449509089885. [DOI] [PubMed] [Google Scholar]
- 10.Bakir F, Damluji SF, Amin-Zaki L, et al. Methylmercury poisoning in Iraq. Science. 1973 Jul 20;181(4096):230–241. doi: 10.1126/science.181.4096.230. [DOI] [PubMed] [Google Scholar]
- 11.Castoldi AF, Onishchenko N, Johansson C, et al. Neurodevelopmental toxicity of methylmercury: Laboratory animal data and their contribution to human risk assessment. Regul Toxicol Pharmacol. 2008 Jul;51(2):215–229. doi: 10.1016/j.yrtph.2008.03.005. [DOI] [PubMed] [Google Scholar]
- 12.Dreiem A, Shan M, Okoniewski RJ, Sanchez-Morrissey S, Seegal RF. Methylmercury inhibits dopaminergic function in rat pup synaptosomes in an age-dependent manner. Neurotoxicol Teratol. 2009 Sep-Oct;31(5):312–317. doi: 10.1016/j.ntt.2009.05.001. [DOI] [PubMed] [Google Scholar]
- 13.Faraone SV, Biederman J. Neurobiology of attention-deficit hyperactivity disorder. Biol Psychiatry. 1998 Nov 15;44(10):951–958. doi: 10.1016/s0006-3223(98)00240-6. [DOI] [PubMed] [Google Scholar]
- 14.Karagas MR, Choi AL, Oken E, et al. Evidence on the Human Health Effects of Low Level Methylmercury Exposure. Environ Health Perspect. 2012 Jun;120(6):799–806. doi: 10.1289/ehp.1104494. [DOI] [PMC free article] [PubMed] [Google Scholar]
- 15.Grandjean P, Weihe P, White RF, et al. Cognitive deficit in 7-year-old children with prenatal exposure to methylmercury. Neurotoxicol Teratol. 1997 Nov-Dec;19(6):417–428. doi: 10.1016/s0892-0362(97)00097-4. [DOI] [PubMed] [Google Scholar]
- 16.Stewart P, Reihman J, Gump B, Lonky E, Darvill T, Pagano J. Response inhibition at 8 and 9 1/2 years of age in children prenatally exposed to PCBs. Neurotoxicol Teratol. 2005 Nov-Dec;27(6):771–780. doi: 10.1016/j.ntt.2005.07.003. [DOI] [PubMed] [Google Scholar]
- 17.Davidson PW, Myers GJ, Cox C, et al. Effects of prenatal and postnatal methylmercury exposure from fish consumption on neurodevelopment: outcomes at 66 months of age in the Seychelles Child Development Study. Jama. 1998 Aug 26;280(8):701–707. doi: 10.1001/jama.280.8.701. [DOI] [PubMed] [Google Scholar]
- 18.Grandjean P, White RF, Nielsen A, Cleary D, de Oliveira Santos EC. Methylmercury neurotoxicity in Amazonian children downstream from gold mining. Environ Health Perspect. 1999 Jul;107(7):587–591. doi: 10.1289/ehp.99107587. [DOI] [PMC free article] [PubMed] [Google Scholar]
- 19.Myers GJ, Davidson PW, Cox C, et al. Prenatal methylmercury exposure from ocean fish consumption in the Seychelles child development study. Lancet. 2003 May 17;361(9370):1686–1692. doi: 10.1016/S0140-6736(03)13371-5. [DOI] [PubMed] [Google Scholar]
- 20.Myers GJ, Davidson PW, Palumbo D, et al. Secondary analysis from the Seychelles Child Development Study: the child behavior checklist. Environ Res. 2000 Sep;84(1):12–19. doi: 10.1006/enrs.2000.4085. [DOI] [PubMed] [Google Scholar]
- 21.Environmental Protection Agency and Food and Drug Administration. [January 12, 2012];What You Need to Know About Mercury in Fish and Shellfish: EPA and FDA Advice For Women Who Might Become Pregnant, Women Who are Pregnant, Nursing Mothers and Young Children. 2004 Available at: http://www.fda.gov/Food/FoodSafety/Product-SpecificInformation/Seafood/FoodbornePathogensContaminants/Methylmercury/ucm115662.htm.
- 22.Cohen JT, Bellinger DC, Connor WE, Shaywitz BA. A quantitative analysis of prenatal intake of n-3 polyunsaturated fatty acids and cognitive development. Am J Prev Med. 2005 Nov;29(4):366–374. doi: 10.1016/j.amepre.2005.06.008. [DOI] [PubMed] [Google Scholar]
- 23.Helland IB, Smith L, Saarem K, Saugstad OD, Drevon CA. Maternal supplementation with very-long-chain n-3 fatty acids during pregnancy and lactation augments children’s IQ at 4 years of age. Pediatrics. 2003 Jan;111(1):e39–44. doi: 10.1542/peds.111.1.e39. [DOI] [PubMed] [Google Scholar]
- 24.Hibbeln JR, Davis JM, Steer C, et al. Maternal seafood consumption in pregnancy and neurodevelopmental outcomes in childhood (ALSPAC study): an observational cohort study. Lancet. 2007 Feb 17;369(9561):578–585. doi: 10.1016/S0140-6736(07)60277-3. [DOI] [PubMed] [Google Scholar]
- 25.Oken E, Wright RO, Kleinman KP, et al. Maternal fish consumption, hair mercury, and infant cognition in a U.S. Cohort. Environ Health Perspect. 2005 Oct;113(10):1376–1380. doi: 10.1289/ehp.8041. [DOI] [PMC free article] [PubMed] [Google Scholar]
- 26.Choi AL, Cordier S, Weihe P, Grandjean P. Negative confounding in the evaluation of toxicity: the case of methylmercury in fish and seafood. Crit Rev Toxicol. 2008;38(10):877–893. doi: 10.1080/10408440802273164. [DOI] [PMC free article] [PubMed] [Google Scholar]
- 27.Sagiv SK, Nugent JK, Brazelton TB, et al. Prenatal organochlorine exposure and measures of behavior in infancy using the Neonatal Behavioral Assessment Scale (NBAS) Environ Health Perspect. 2008 May;116(5):666–673. doi: 10.1289/ehp.10553. [DOI] [PMC free article] [PubMed] [Google Scholar]
- 28.Sagiv SK, Thurston SW, Bellinger DC, Tolbert PE, Altshul LM, Korrick SA. Prenatal organochlorine exposure and behaviors associated with attention deficit hyperactivity disorder in school-aged children. Am J Epidemiol. 2010 Mar 1;171(5):593–601. doi: 10.1093/aje/kwp427. [DOI] [PMC free article] [PubMed] [Google Scholar]
- 29.Korrick SA, Altshul LM, Tolbert PE, Burse VW, Needham LL, Monson RR. Measurement of PCBs, DDE, and hexachlorobenzene in cord blood from infants born in towns adjacent to a PCB-contaminated waste site. J Expo Anal Environ Epidemiol. 2000;10(6 Pt 2):743–754. doi: 10.1038/sj.jea.7500120. [DOI] [PubMed] [Google Scholar]
- 30.Longnecker MP, Wolff MS, Gladen BC, et al. Comparison of polychlorinated biphenyl levels across studies of human neurodevelopment. Environ Health Perspect. 2003;111(1):65–70. doi: 10.1289/ehp.5463. [DOI] [PMC free article] [PubMed] [Google Scholar]
- 31.National Research Council. Toxicological Effects of Methylmercury. Washington DC: National Academy Press; 2000. [Google Scholar]
- 32.Conners CK. Conners’ Rating Scales-Revised Technical Manual. North Tonawanda, NY: Multi-Health Systems; 1997. [Google Scholar]
- 33.Letz R. NES2 User’s Manual, Version 4.7. Atlanta, GA: Neurobehavioral Systems, Inc.; 1998. [Google Scholar]
- 34.Wechsler D. Wechsler Scale for Infant Intelligence. Third Edition. The Psychological Corporation; 1991. [Google Scholar]
- 35.Hosmer DW, Lemeshow S. Confidence interval estimation of interaction. Epidemiology. 1992 Sep;3(5):452–456. doi: 10.1097/00001648-199209000-00012. [DOI] [PubMed] [Google Scholar]
- 36.Rothman KJ, Greenland S, Lash TL. Modern Epidemiology. Third Edition. Philadelphia, PA: Lippincott Williams and Wilkins; 2008. [Google Scholar]
- 37.Caldwell B, Bradley R. Home Observation for Measurement of the Environment. Revised Edition. Little Rock: University of Arkansas; 1984. [Google Scholar]
- 38.Greenland S, Pearl J, Robins JM. Causal diagrams for epidemiologic research. Epidemiology. 1999 Jan;10(1):37–48. [PubMed] [Google Scholar]
- 39.Weng HY, Hsueh YH, Messam LL, Hertz-Picciotto I. Methods of covariate selection: directed acyclic graphs and the change-in-estimate procedure. Am J Epidemiol. 2009 May 15;169(10):1182–1190. doi: 10.1093/aje/kwp035. [DOI] [PubMed] [Google Scholar]
- 40.Peng RD, Dominici F. Statistical Methods for Environmental Epidemiology with R: A Case Study in Air Pollution and Health. New York: Springer Science; 2008. [Google Scholar]
- 41.Cernichiari E, Brewer R, Myers GJ, et al. Monitoring methylmercury during pregnancy: maternal hair predicts fetal brain exposure. Neurotoxicology. 1995 Winter;16(4):705–710. [PubMed] [Google Scholar]
- 42.McDowell MA, Dillon CF, Osterloh J, et al. Hair mercury levels in U.S. children and women of childbearing age: reference range data from NHANES 1999-2000. Environ Health Perspect. 2004 Aug;112(11):1165–1171. doi: 10.1289/ehp.7046. [DOI] [PMC free article] [PubMed] [Google Scholar]
- 43.Debes F, Budtz-Jorgensen E, Weihe P, White RF, Grandjean P. Impact of prenatal methylmercury exposure on neurobehavioral function at age 14 years. Neurotoxicol Teratol. 2006 Sep-Oct;28(5):536–547. doi: 10.1016/j.ntt.2006.02.005. [DOI] [PubMed] [Google Scholar]
- 44.Ha M, Kwon HJ, Lim MH, et al. Low blood levels of lead and mercury and symptoms of attention deficit hyperactivity in children: a report of the children’s health and environment research (CHEER) Neurotoxicology. 2009 Jan;30(1):31–36. doi: 10.1016/j.neuro.2008.11.011. [DOI] [PubMed] [Google Scholar]
- 45.Budtz-Jorgensen E, Grandjean P, Weihe P. Separation of risks and benefits of seafood intake. Environ Health Perspect. 2007 Mar;115(3):323–327. doi: 10.1289/ehp.9738. [DOI] [PMC free article] [PubMed] [Google Scholar]
- 46.Davidson PW, Strain JJ, Myers GJ, et al. Neurodevelopmental effects of maternal nutritional status and exposure to methylmercury from eating fish during pregnancy. Neurotoxicology. 2008 Sep;29(5):767–775. doi: 10.1016/j.neuro.2008.06.001. [DOI] [PMC free article] [PubMed] [Google Scholar]
- 47.Strain JJ, Davidson PW, Bonham MP, et al. Associations of maternal long-chain polyunsaturated fatty acids, methyl mercury, and infant development in the Seychelles Child Development Nutrition Study. Neurotoxicology. 2008 Sep;29(5):776–782. doi: 10.1016/j.neuro.2008.06.002. [DOI] [PMC free article] [PubMed] [Google Scholar]
- 48.Richardson AJ. Omega-3 fatty acids in ADHD and related neurodevelopmental disorders. Int Rev Psychiatry. 2006 Apr;18(2):155–172. doi: 10.1080/09540260600583031. [DOI] [PubMed] [Google Scholar]
- 49.Grandjean P, Weihe P, Burse VW, et al. Neurobehavioral deficits associated with PCB in 7-year-old children prenatally exposed to seafood neurotoxicants. Neurotoxicol Teratol. 2001;23(4):305–317. doi: 10.1016/s0892-0362(01)00155-6. [DOI] [PubMed] [Google Scholar]
- 50.Stewart PW, Reihman J, Lonky EI, Darvill TJ, Pagano J. Cognitive development in preschool children prenatally exposed to PCBs and MeHg. Neurotoxicol Teratol. 2003;25(1):11–22. doi: 10.1016/s0892-0362(02)00320-3. [DOI] [PubMed] [Google Scholar]
- 51.Surkan PJ, Wypij D, Trachtenberg F, et al. Neuropsychological function in school-age children with low mercury exposures. Environ Res. 2009 Aug;109(6):728–733. doi: 10.1016/j.envres.2009.04.006. [DOI] [PMC free article] [PubMed] [Google Scholar]
- 52.Rice DC, Schoeny R, Mahaffey K. Methods and rationale for derivation of a reference dose for methylmercury by the U.S. EPA. Risk Anal. 2003 Feb;23(1):107–115. doi: 10.1111/1539-6924.00294. [DOI] [PubMed] [Google Scholar]
- 53.Cordier S, Garel M, Mandereau L, et al. Neurodevelopmental investigations among methylmercury-exposed children in French Guiana. Environ Res. 2002 May;89(1):1–11. doi: 10.1006/enrs.2002.4349. [DOI] [PubMed] [Google Scholar]
- 54.Weiss B. Same sex, no sex, and unaware sex in neurotoxicology. Neurotoxicology. 2011 Oct;32(5):509–517. doi: 10.1016/j.neuro.2010.09.005. [DOI] [PMC free article] [PubMed] [Google Scholar]
- 55.Braun JM, Yolton K, Dietrich KN, et al. Prenatal bisphenol A exposure and early childhood behavior. Environ Health Perspect. 2009 Dec;117(12):1945–1952. doi: 10.1289/ehp.0900979. [DOI] [PMC free article] [PubMed] [Google Scholar]
- 56.Engel SM, Miodovnik A, Canfield RL, et al. Prenatal phthalate exposure is associated with childhood behavior and executive functioning. Environ Health Perspect. 2010 Apr;118(4):565–571. doi: 10.1289/ehp.0901470. [DOI] [PMC free article] [PubMed] [Google Scholar]
- 57.Bellinger DC. What is an adverse effect? A possible resolution of clinical and epidemiological perspectives on neurobehavioral toxicity. Environ Res. 2004 Jul;95(3):394–405. doi: 10.1016/j.envres.2003.07.013. [DOI] [PubMed] [Google Scholar]