

Abstract
Acetaminophen (paracetamol, N-(4-hydroxyphenyl) acetamide) is one of the most commonly prescribed drugs for the management of pain in children. Quantification of acetaminophen in pre-term and term neonates and small children requires the availability of highly sensitive assays in small volume blood samples.
We developed and validated an LC-MS/MS assay for the quantification of acetaminophen in human plasma, cerebro-spinal fluid (CSF) and dried blood spots (DBS). Reconstitution in water (DBS only) and addition of a protein precipitation solution containing the deuterated internal standard were the only manual steps. Extracted samples were analyzed on a Kinetex 2.6 μm PFP column using an acetonitrile/formic acid gradient. The analytes were detected in the positive multiple reaction mode. Alternatively, DBS were automatically processed using direct desorption in a sample card and preparation (SCAP) robotic autosampler in combination with online extraction.
The range of reliable response in plasma and CSF was 3.05-20,000 ng/ml (r2 > 0.99) and 27.4-20,000 ng/ml (r2 > 0.99) for DBS (manual extraction and automated direct desorption). Inter-day accuracy was always within 85-115% and inter-day precision for plasma, CSF and manually extracted DBS were less than 15%. Deming regression analysis comparing 167 matching pairs of plasma and DBS samples showed a correlation coefficient of 0.98. Bland Altman analysis indicated a 26.6% positive bias in DBS, most likely reflecting the blood: plasma distribution ratio of acetaminophen.
DBS are a valid matrix for acetaminophen pharmacokinetic studies.
Keywords: acetaminophen, LC-MS/MS, human plasma, human CSF, dried blood spots, direct desorption, sample card and preparation autosampler
1. Introduction
Acetaminophen (paracetamol, N-(4-hydroxyphenyl) acetamide) is one of the most commonly prescribed drugs for the management of mild to moderate pain in neonates, infants and children. A parenteral version is available [1] but limited pharmacokinetics studies are available for the pediatric population [2-4]. In typical adult pharmacokinetic testing, large volume, high-frequency blood and/or serum sampling strategies are utilized for complete time- drug concentration profiling. Hence, pediatric patients have often been ignored due to logistical and ethical study constraints. Additionally, parents are hesitant to expose their children to multiple venipunctures for drug studies. These obstacles instigated the development of new methods for laboratory testing in small children. According to the European Medicines Agency and Federal Drug Administration, for minimal risk studies blood loss for research trials should not exceed 1% of total blood volume at any given time or 3% of total blood volume over four weeks, making studies in pediatrics, especially neonates difficult [5]. Collecting samples for analysis with dried blood spots (DBS) in combination with highly sensitive modern mass spectrometry technologies, micro-volume samples (≤50 μl) of capillary blood can be used with high precision to measure drug levels from these DBS [6-11].
Although acetaminophen is considered a safe analgesic and antipyretic with a wide therapeutic window, it causes approximately one half of all acute liver failure cases in the United States and Great Britain [12,13]. Annually, including deaths, hospitalization, and poison control center inquiries, the cost of acetaminophen toxicity is estimated to be as high as $87 million in the United States and Great Britain [14,15]. At least two studies have reported acetaminophen toxicity, one pediatric, with dosages reported to be within the therapeutic range [16,17].
Acetaminophen has been shown to be metabolically activated by specific cytochrome P450 enzymes into N-acetyl-p-benzoquinone imine (NAPQI), a toxic compound [16,17]. Evidence suggests that expression of some of these enzymes is highly variable and often asynchronous, particularly due to ontogeny [18]. This can result in unpredictable toxicity levels during development. As a result, the need for more efficient, acceptable analytic techniques in children is desirable.
Here we describe an automated HPLC-tandem mass spectrometry (LC-MS/MS) assay and its validation to quantify acetaminophen on dried blood spots (DBS), in plasma and cerebro-spinal fluid (CSF). This assay was specifically developed for pediatric pharmacokinetics trials after oral and IV acetaminophen to allow for much smaller blood samples (20-50 μl) per draw versus the established per draw blood sampling amount (500-1,000 μl).
2. Materials and methods
2.1 Chemicals and reagents
Reference materials for acetaminophen and the internal standard acetaminophen-D4 (IS) were purchased from Toronto Research Chemicals, Toronto, Canada. All reference materials had a valid certificate of analysis. The isotopic purity of the internal standard was >99%. During the study, the D4-labeled internal standard never caused an unlabeled acetaminophen peak with an area >20% of the acetaminophen detector response at the LLOQ and was stable in the extracted samples for at least 24 h, indicating that H/D exchange was not a relevant issue for this assay. HPLC grade water, HPLC grade acetonitrile and formic acid (88%, certified ACS) used for sample extraction and as mobile phase were from Fisher Scientific (Fairlawn, NJ). Whatman 903 Protein Saver Cards (from Fisher Scientific, Fair Lawn, NJ) were used to collect study samples and used to prepare the calibrators and quality controls for DBS analysis. Drug-free human plasma and human whole blood containing K2EDTA (ethylenediaminetetraacetic acid) as the anticoagulant for assay development, validation and study sample analysis were purchased from Bonfils Blood Center (Denver, CO). Collection and use of plasma and whole blood from healthy volunteers for the development, validation and quality control of analytical assays was granted exempt status by the Colorado Multi-Institutional Review Board (COMIRB, Aurora, CO). Drug free CSF samples from healthy volunteers for calibrators and quality controls as required for assay development, validation and study sample analysis were purchased from Bioreclamation (Westbury, NY). CSF was used from the pre-dose time points samples collected for this study. These samples as well as the 167 EDTA plasma and DBS used for the cross-validation studies described below were from a clinical trial. The clinical study was approved by the appropriate institutional review board, study subjects had given their written informed consent, including the use of samples for the purpose described herein, and the clinical study was carried out following the rules of good clinical practice and all applicable regulatory rules and guidances.
Each stock solution was based on three independent weightings of each compound. Stock solutions (1.0 mg/ml, Stock A) were prepared in dimethyl sulfoxide and were stored at -80°C. Working solutions for quality control samples and standard curves were prepared by direct dilution of the stock solutions in DMSO. Serial dilutions were avoided. A 500 ng/ml acetaminophen D4 internal standard working solution was prepared in HPLC grade acetonitrile.
2.1 Preparation of calibrator and quality control (QC) samples
For all three matrices (plasma, CSF, and DBS) a 0.4 mg/ml working solution was prepared from Stock A by diluting 200 μl into 300 μl of dimethyl sulfoxide (DMSO). The standard curve was prepared by aliquoting 50 μl of blank matrix into 12 wells of a 96-deepwell plate. The matrix was spiked with 2.5 μl of the standard solutions using a low volume multi-channel pipette to result in the following concentrations: 3.04, 9.14, 27.4, 82.3, 241, 741, 2222, 6667, and 20000 ng/ml. For plasma and CSF, quality control samples with the following concentrations were prepared: 198, 593 and 16000 ng/ml. For DBS samples, the appropriate acetaminophen stock solutions were spiked into 50 μl of blood to give concentrations of 198, 593, and 16000 ng/ml. 50 μl of the spiked blood was then transferred onto Whatman 903 Protein Saver Cards and allowed to dry for 2 hours at room temperature.
2.3 Sample Extraction
2.3.1 Plasma and CSF
50 μl of plasma were aliquoted into a 96-deepwell plate. A 300 μl aliquot of acetonitrile containing the internal standard acetaminophen-D4 (500 ng/ml) was then added to each study sample, calibrator or quality control to precipitate the proteins. The 96-well plate was sealed and samples were vortexed for 5 minutes and centrifuged for 10 minutes at 13,000 g at +4°C. One hundred μl of the top layer was transferred to an injection vial containing 100 μl of water and 3 μl was injected into an AB Sciex (Foster City, CA) API5000 LC-MS/MS system.
2.3.2 Manual DBS extraction
Each DBS was punched out with a 3 mm whole punch from the Whatman 903 Protein Saver Cards and placed into a 2 ml polypropylene micro-tube with conical bottom and snap-on lid. An aliquot of 100 μl of HPLC-grade water was added to each tube and the DBS were agitated with a clean pipette tip until the blood was solubilized. Then a 300 μl aliquot of working internal standard solution (30% 0.2M ZnSO4 in water/ 70% methanol containing 500 ng/ml of acetaminophen D4) was added to each sample, calibrator and quality control sample to precipitate the proteins.
2.3.3 Automated DBS extraction
Automated DBS extraction was based on the Leap Technologies Sample Card and Preparation (SCAP, Carrboro, NC) autosampler. The rack with the DBS cards (Leap Technologies) was directly placed into the SCAP system. The robotic arm transferred the card into the clamp module where the DBS card was directly integrated into the HPLC flow path for online elution and extraction without punching of DBS cards. The connection of the SCAP autosampler, online extraction and analytical column are shown in Figure 1. After introduction into the clamp module, the DBS were eluted using 9.5% water with 0.1% formic acid with a flow of 1.0 ml/min for 90 seconds, whereby the internal standard (50 ng/ml) that had previously been loaded into an injection loop was flushed onto the DBS (Figure 1, positions 1 and 2). HPLC separation and MS/MS detection was carried out as described below. Then the 6-port valve for the second HPLC pump was activated and the column was back flushed with 95% acetonitrile at a flow of 1.0 ml/min for 2.0 min to clean the column and system. (Figure 1, position 3) before the system was re-equilibrated to starting conditions (5% acetonitrile) for one minute.
Figure 1. Connections of the Sample Card and Preparation (SCAP) autosampler, switching valves, HPLC equipment, and mass spectrometer for automated DBS analysis.
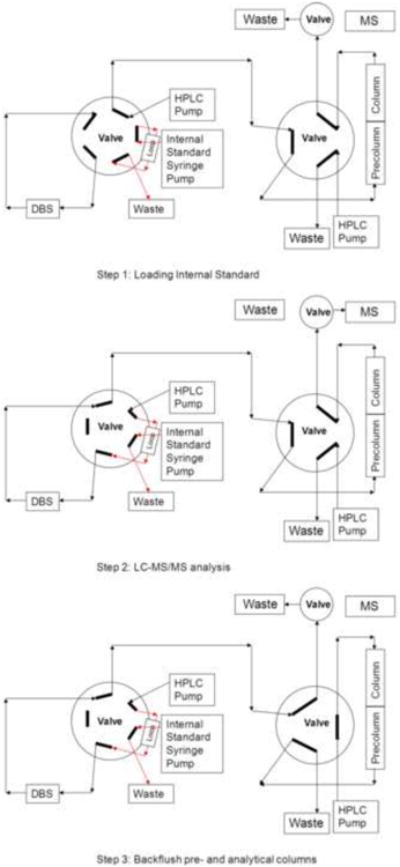
(A) Loading of internal standard D4 acetaminophen into the loop. (B) extraction of DBS and LC-MS/MS analysis, (C) system wash and backflush of pre-column and analytical columns.
2.4 HPLC/MS analysis
An AB Sciex API5000/Agilent 1100 series LC-MS/MS system (AB Sciex, Foster City, CA, and Agilent Technologies, Santa Clara, CA) was used to analyze the samples. The mobile phases consisted of 0.1% formic acid in water (solvent A) and 0.1% formic acid in acetonitrile (solvent B). The gradient was from 5- 95% solvent B over 3.0 minutes with a flow rate of 1 ml/min. Solvent B was kept at 95% until 3.2 min and hereafter the system was re-equilibrated to starting conditions for 1 min. Acetaminophen and its internal standard were analyzed on a Phenomenex (Torrance, CA) Kinetix 2.6 μm, 100 Å, 100 × 4.6 mm PFP ultra-high performance liquid chromatography (U-HPLC) analytical column with a Phenomenex ADF-8497 Krudcatcher as a pre-filter. The analytical column was kept at ambient temperature. The AB Sciex API5000 mass spectrometer was run in the positive MRM (Multiple Reaction Monitoring) using electrospray ionization (ESI). Nitrogen of >99.999% purity was used as Collision Activated Dissociation (CAD) gas and curtain gas. The following parameters were found to give the best sensitivities: the source temperature was set to 500°C, and the ion spray voltage was 5000V, gases were set at 60 for nebulizer gas, 40 for drying gas, curtain gas was 40 and the CAD gas was 10 (all arbitrary units as used in the Analyst software). The declustering potential (DP) was set to 71V and the collision energy (CE) to 25eV. The dwell time for each transition was 200 msec. The following mass transitions were monitored m/z= 152.1 → 110.0 for acetaminophen [M+H]+ and m/z= 156.1 → 114.1 for the internal standard acetaminophen-D4 [M+H]+.
2.5 Quantification
Acetaminophen concentrations in human plasma, CSF and DBS were quantified by plotting nominal concentrations versus response factor of analyte (Peak Area[Analyte]/Peak Area[IS]). Using a quadratic fit turned out to give the best results. All calculations were carried out by the AB Sciex Analyst Software (version 1.5.1.).
2.6 Validation procedures
The assay was validated using acetaminophen free human plasma, human CSF, and whole blood (DBS) from healthy volunteers enriched with the analyte. Quantification of acetaminophen in human plasma, human CSF and DBS was validated following applicable Clinical Laboratory Standards Institute (CLSI) and Food and Drug Administration (FDA) guidelines [19] as considered “fit-for-purpose”.
2.6.1 Predefined acceptance criteria
The performance of the assay was considered acceptable if imprecision (residual standard deviation, RSD%) at each concentration was ≤15% for intra-day and inter-day variability except at the lower limit of quantitation (≤20%). The accuracy compared with the nominal value had to be within ± 15% for both intra- and inter-day variability, except at the lower limit of quantitation (±20%). The calibration curve was to have a correlation coefficient (r2) of 0.99 or better.
2.6.2 Lower limit of detection (LLOD) and lower limit of quantification (LLOQ)
The lower limit of detection (LLOD) was the lowest analyte concentration in CSF, plasma, or DBS that results in a peak-to-noise ratio of 4:1. The lower limit of quantification (LLOQ) was determined as the lowest concentration of the calibration curve consistently achieving accuracy better than ±20% of the nominal concentration and imprecision ≤ 20%.
2.6.3 Inter- and intra-assay imprecision and accuracy
Imprecision and accuracy were tested at three concentration levels of 198 ng/ml (QC1), 593 ng/ml (QC2), and 16,000 ng/ml (QC3). Intra-day imprecision and accuracy was determined with n=6/ QC level. For plasma, inter-day imprecision and accuracy was measured over 21 days with each QC level measured in duplicate each day. After validation of the assay for plasma, for CSF and DBS an abbreviated validation strategy was employed and inter-day accuracy and imprecisions were confirmed over 3 days.
2.6.4 Exclusion of matrix interferences, matrix effects and carry-over
Interferences caused by matrix signals were excluded by analysis of blank CSF, plasma, and DBS collected from six (CSF) or ten (plasma, DBS) different individuals. To detect changes in ionization efficiency by co-eluting matrix substances (“matrix effects”), we used a dual strategy Blank human CSF samples from five different healthy individuals were obtained. In the first approach [20], supernatants obtained from blank samples after extraction were enriched with 198, 593 and 16,000 ng/ml acetaminophen and signal intensities were compared with those after injection of a corresponding amount of the compounds from a stock solution. For the second approach to detect changes in ionization efficiency by co-eluting matrix substances, extracted blank matrix samples were injected into the HPLC system and were analyzed using the newly developed assay. A mixture of the analytes (10 μg/ml dissolved in 0.01 formic acid/acetonitrile, 25/75, v/v) was infused post-column via T-piece at 10 μl/min using a syringe pump (Harvard Apparatus, Holliston, MA). The extent of ion suppression was established by monitoring the intensity of the ion currents at the retention times of analytes and internal standard as previously described [21]. A potential carry-over effect was assessed by analyzing extracted blank human CSF, DBS, and plasma samples after the highest calibrators (20000 ng/ml).
2.6.5 Extraction recoveries
The recoveries were determined by comparing the signals of the analytes after extraction of QC1-3 (n=6/concentration) with the signals of extracted blank matrix spiked with the respective concentrations of analytes after the extraction procedure.
2.6.6 Dilution integrity
Dilution integrity was established using freshly prepared samples spiked with the analytes at 16000 ng/ml. Dilutions (1:10, and 1:100, n=6) were made using blank plasma Deviations from the nominal concentrations were calculated and had to fall within ±15%.
2.6.7 Stabilities
CSF, DBS, and plasma acetaminophen stabilities were investigated using QC1-3 samples which were extracted and analyzed at the different time-points under the different storage conditions. The results after storage were compared with the nominal values and had to fall with ±15% of these. Sample stability was established for 24 hours at ambient temperature, one week at +4° C and -20°C and one month at -80°C (DBS only). Freeze-thaw stability over three cycles (-20°C) was tested Extracted sample/autosampler stability was tested. by placing samples into the thermostatted autosampler adjusted to +4°C. Samples were injected after 24 hours.
2.6.8 Cross validation of DBS and plasma samples based on matching sample pairs collected during a clinical trial
To compare the concentrations of acetaminophen measured in plasma samples and in DBS, a cross validation study based on 167 plasma/DBS sample pairs was carried out. The samples were from the aforementioned clinical trial and plasma samples and DBS were collected in parallel at the same time. The results in both matrices (plasma: reference; DBS: test) were compared using the EP Evaluator software (version/built 9.4.0.457, Data Innovations, South Burlington, VT) including Deming regression and Passing-Bablok plots.
3. Results
3.1 Plasma
In human EDTA plasma the LLOD was 1.00 ng/ml and the LLOQ was 3.05 ng/ml (Figure 2). The imprecision at the LLOQ (RSD%, n=10) was 8.0% and the accuracy was 97.7% of nominal. In human EDTA plasma, the assay was linear from 3.05 to 20,000 ng/ml. The correlation coefficient of the calibration curves was consistently r2> 0.99. As aforementioned, intra-day imprecision and accuracy was determined by analysis of QC1-3 (n=6/concentration) on the same day and calculation of the residual standard deviation (RSD%). The intra-day imprecisions at the three QC levels were 4.9, 2.8 and 3.4% and intra-day accuracies were 93.5, 104 and 106% For the estimation of inter-day accuracies and imprecisions, each QC level was measured over 21 days Inter-day imprecisions at the three QC levels were 8.7, 3.4 and 6.3% and accuracies were 99.1, 107 and 102%. No interferences with other compounds extracted from human EDTA plasma exceeding 20% of the LLOQ signal were found. A potential carry-over effect was assessed by analyzing extracted blank human EDTA plasma samples after the highest calibrators (20000 ng/ml). Less than 0.1% carry-over was found. No relevant ion suppression was detected for any of the human EDTA plasma samples tested (comparison of signal after spiking into extracted plasma sample versus the corresponding amount of neat solution injected into the LC-MS/MS system): 198 ng/ml: 90.9±8.3%, 593 ng/ml: 97.0±10.9% and 16,000 ng/ml: 101.0±4.0% (Figure 3). The mean absolute extraction recoveries of acetaminophen after protein precipitation of human plasma in samples QC1 (198 ng/ml), QC2 (593 ng/ml), and QC3 (16,000 ng/ml) were 90.9%, 100%, and 103%, respectively. Plasma samples could be diluted 1:10 (deviation from nominal: -1.9±5.5%) and 1:100 (-2.6±3.5%) using blank EDTA plasma within ±15% of target. No significant instabilities were found at ambient temperature, 4°C for 24 hours, and -20°C for one week. Extracted samples stored at +4°C in the thermostatted autosampler were found to be stable for at least 24 hours. Samples could undergo three freeze thaw cycles with no significant instability. For more details, please see Supplementary Table 1.
Figure 2. Representative ion chromatograms of blank samples (right) and samples enriched with concentrations at the LLOQ (left).

(A) EDTA plasma, (B) CSF, (C) DBS (manual) and (D) DBS (automated, SCAP). The arrows mark the retention time of acetaminophen. Abbreviation: SCAP: sample card and preparation autosampler.
Figure 3. Ion suppression test using continuous post-column infusion.

Blank human EDTA plasma samples from ten different healthy individuals were extracted and injected into the LC-MS/MS system. A representative experiment is shown Acetaminophen (10 μg/ml dissolved in 01 formic acid/acetonitrile, 3:7, v/v) was infused post-column via T-piece at a rate of 10 μl/min using a syringe pump (Harvard Apparatus, Holliston, MA). The extent of ion suppression was established by monitoring the signal intensity of the ion currents in MRM-mode (m/z= 152 [M+H]+ → 110) at the retention times of the analyte (marked by arrow) after injection of blank extracted plasma samples into the LC-MS/MS system. Ion suppression would have caused a “dip” in the acetaminophen signal produced by constant infusion. The arrow marks the retention time of acetaminophen. Red: continuous infusion of acetaminophen, blue: overlaid analysis of extracted sample with acetaminophen peak.
3.2 CSF
In human CSF the LLOD was 1.0 ng/ml and the LLOQ was 3.05 ng/ml (Figure 2). The imprecision at the LLOQ was 6.6% (RSD%, n=10) and the average accuracy 106% of nominal In human CSF, the assay was linear from 3.05 to 20,000 ng/ml The correlation coefficient of the calibration curves was consistently r2> 0.99. At the three QC levels intra-day imprecisions were 8.3 (198 ng/ml), 9.2 (593 ng/ml) and 5.3% (16,000 ng/ml) and accuracies were 110%, 104% and 89.5% Inter-day accuracies were 11.7, 10.9 and 6.3%, respectively. Inter-day imprecisions at the three QC levels were 102, 100 and 93.0%. No interferences with other compounds extracted from human CSF exceeding 20% of the LLOQ signal were found. No relevant ion suppression was detected for any of the human CSF samples tested (n= 6 different individuals): 198 ng/ml: 104.0± 11.9%, 593 ng/ml: 101.0± 5.8% and 16,000 ng/ml: 92.8± 10.0%. No relevant carry-over was found (<0.1% in all samples). The mean absolute extraction recoveries of acetaminophen after protein precipitation of human CSF in samples QC1 (198 ng/ml), QC2 (593 ng/ml), and QC3 (16,000 ng/ml) were 79.4%, 106.0%, and 93.8%, respectively. For CSF at ambient temperature for 24 hours, as well as at +4°C and -20°C for 1 week no significant instability was observed. Samples could undergo at least three freeze/thaw cycles and extracted samples stored at +4°C in the autosampler were found to be stable for at least 24 hours. For more details, please see Supplementary Table 1.
3.3 DBS
In DBS the LLOD was 13.7 ng/ml and the LLOQ was 27.4 ng/ml (Figure 2). The imprecision (RSD%, n=10) at the LLOQ was 9.6% and the average accuracy 100.4% (% of nominal). The assay was linear from 27.4 to 20,000 ng/ml. The correlation coefficient of the calibration curves was consistently r2> 0.99. Intra-day imprecisions at the 3 QC levels were 6.7%, 4.5% and 4.0%. Intra-day accuracies (% of nominal) were: 102%, 99.0% and 105%. Inter-day imprecisions at the three QC levels were 8.3%, 6.3% and 8.5% and inter-day accuracies: 103%, 104% and 105%. No interferences with other compounds extracted from DBS exceeding 20% of the LLOQ signal were found. No relevant ion suppression was detected for any of the human DBS samples tested (n= 6 different individuals): 198 ng/ml: 104.0± 11.4%, 593 ng/ml: 90.3±3.0% and 16,000 ng/ml: 92.4±9.8%. No carry-over was found. The mean absolute recoveries of acetaminophen after protein precipitation of human blood in samples QC1 (198 ng/ml), QC2 (593 ng/ml), and QC3 (16,000 ng/ml) were 90.5%, 97.0%, 99.4%, respectively. For the automated DBS extraction, the LLOD and LLOQ (Figure 2) as well as the range of reliable response matched those after manual extraction of DBS. No interferences with other compounds extracted from DBS exceeding 20% of the LLOQ signal were found (Figure 2). The intra-day imprecisions at the 3 QC levels were 17.8%, 5.8% and 5.4%. Intra-day accuracies (% of nominal) were: 94.9%, 96.5% and 95.9% Inter-day imprecisions at the three QC levels were 8.06%, 15.3% and 15.9% and inter-day accuracies: 96.4%, 90.2% and 96.7% There was no evidence for carry-over.
In DBS no significant instability was found at ambient temperature for 24 hours, and -80°C for one month. Extracted samples stored at +4°C in the thermostatted autosampler were found to be stable for at least 24 hours For more details, please see Supplementary Table 1.
3.4 Cross validation of DBS and plasma samples based on matching sample pairs collected during a clinical trial
Representative ion chromatograms of corresponding plasma and DBS samples from samples collected during this study are shown in Figure 4.
Figure 4. Representative ion chromatograms of plasma (A) samples and the corresponding DBS (B) from a patient after intra-venous acetaminophen injection.
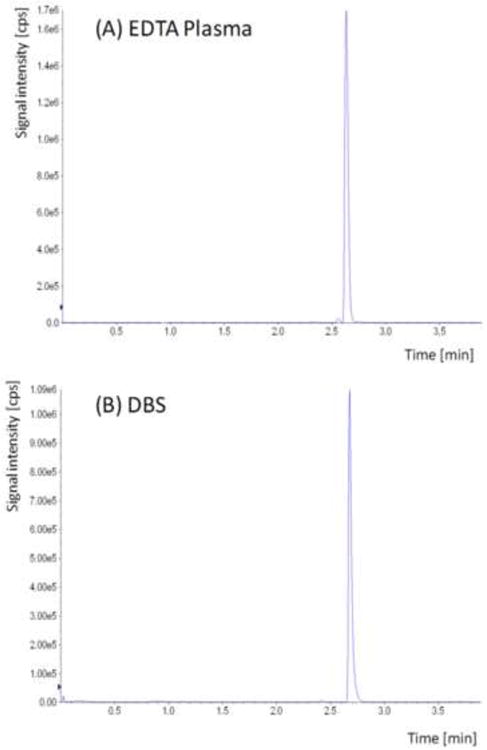
The acetaminophen concentrations in these samples were 11,700 ng/ml (plasma) and 17,900 ng/ml in the corresponding DBS.
Deming regression analysis comparing 167 matching pairs of plasma and DBS samples collected during a patient study after IV acetaminophen showed a correlation coefficient of 0.976 (reference: plasma; test: DBS, slope: 1.34, intercept: -352.2). Bland Altman analysis indicated a 26.6% bias of the DBS results in comparison with the plasma samples, which may be explained by the blood-to-plasma distribution ratio of acetaminophen.
To test this hypothesis, we determined the blood-to-plasma distribution ratio by collecting 10 EDTA whole blood samples from different healthy individuals. These samples were spiked with 198 ng/ml, 593 ng/ml and 16,000 ng/ml (n=10/each concentration). After spiking, plasma was prepared, the acetaminophen concentration in plasma was quantified and compared to the nominal concentration spiked into the whole blood samples (Table 2). Indeed, the results in Table 2 translated into the following average blood-to-plasma distribution ratios: 198 ng/ml: 1.36, 593 ng/ml: 1.37, and 16,000 ng/ml: 1.56.
Table 2.
Blood-to-plasma distribution of acetaminophen in human EDTA blood samples Ten EDTA whole blood samples were collected from different individuals. These samples were spiked with 198 ng/ml, 593 ng/ml and 16,000 ng/ml (n=10/each concentration). After spiking, plasma was prepared, the acetaminophen concentration in plasma was quantified as described and compared to the nominal concentration spiked into the whole blood sample. Abbreviation: SD: standard deviation.
| Nominal Concentration in blood [ng/ml] | Plasma [ng/ml] | Concentration blood [%] | Nominal Concentration in blood [ng/ml] | Plasma [ng/ml] | Concentration blood [%] | Nominal Concentration in blood [ng/ml] | Plasma [ng/ml] | Concentration blood [%] |
|---|---|---|---|---|---|---|---|---|
| 198 | 174 | 87.9 | 593 | 413 | 69.6 | 16000 | 11400 | 71.3 |
| 198 | 152 | 76.8 | 593 | 408 | 68.8 | 16000 | 10900 | 68.1 |
| 198 | 140 | 70.7 | 593 | 463 | 78.1 | 16000 | 11500 | 71.9 |
| 198 | 138 | 69.7 | 593 | 510 | 86.0 | 16000 | 9860 | 61.6 |
| 198 | 156 | 78.8 | 593 | 439 | 74.0 | 16000 | 9260 | 57.9 |
| 198 | 131 | 66.2 | 593 | 409 | 69.0 | 16000 | 9810 | 61.3 |
| 198 | 166 | 83.8 | 593 | 453 | 76.4 | 16000 | 10200 | 63.8 |
| 198 | 133 | 67.2 | 593 | 425 | 71.7 | 16000 | 10100 | 63.1 |
| 198 | 117 | 59.1 | 593 | 384 | 64.8 | 16000 | 9280 | 58.0 |
| 198 | 146 | 73.7 | 593 | 426 | 71.8 | 16000 | 10100 | 63.1 |
|
| ||||||||
| Mean | 145.3 | 73.4 | mean | 433.0 | 73.0 | mean | 10241 | 64.0 |
| SD | 17.2 | 8.7 | SD | 35.6 | 6.0 | SD | 790.3 | 4.9 |
4 Discussion
There is a substantial renewed interest in studying the pharmacokinetics, drug metabolism and toxicological potential of acetaminophen in infants, neonates and children due to the involvement of acetaminophen metabolites in hepatotoxicity [15]. This has triggered the publication of several multi-analyte LC-MS/MS assays, such as the study described by Tonoli et al. [22] that can simultaneously quantify acetaminophen and its major conjugated metabolites. Our goal was to develop a highly sensitive assay that can be used for small volume, minimally invasive DBS sampling strategies for pediatric pharmacokinetic studies. A first assay to quantify acetaminophen on DBS using LC-MS/MS was recently published [23]. This assay was limited to quantification of acetaminophen on DBS. Our present study took advantage of the unique opportunity to have samples from a clinical trial that allowed for assessment of acetaminophen concentrations after intravenous administration in three different matrices that were simultaneously collected at the same time points. This gives the advantage of the present assay being developed and validated in these three matrices. In addition, we were able to directly compare the manual extraction of DBS with an automated extraction procedure based on the Leap Sample Card and Preparation (SCAP) autosampler using direct desorption of DBS without any prior processing.
Acetaminophen overdose and therapeutic target concentrations, which range from 10-20 μg/ml, do not require very sensitive assays. However, highly sensitive assays are required in the case of late admission of an emergency patient or if low matrix volumes are collected, such as in pediatric studies. Our assay with an LLOQ of 3.05 ng/ml in plasma and CSF was more sensitive than when DBS were analyzed (LLOQ of 27.4 ng/ml). This difference did not seem relevant as the vast majority of the samples in the clinical trial had concentrations >100 ng/ml even at the last time point collected (6 hours). The upper limit of quantitation for the assay in all matrices was 20,000 ng/ml, which was sufficient for most maximum concentrations. Only one plasma sample (22,600 ng/ml) and two DBS samples (30,300 and 25,900 ng/ml) among a total of 167 samples for each matrix had to be diluted. The sensitivity and range of reliable response of the present assay compared favorably with recently published LC-MS/MS assays. The assay described in reference [22] had a range of reliable response from 20-10,000 ng/ml in plasma and a recently described DBS LC-MS/MS assay [23] had a range of reliable response from 50-5,000 ng/ml.
Several analytical strategies allowing for automated handling of DBS without pretreatment have been developed and were reviewed by Déglon et al [8]. One of the most mature commercially available automated solutions is the SCAP robotic autosampler system which enables direct desorption of the DBS with subsequent sample extraction using online column switching [8,24,25]. As shown in Table 1, the intra-day and inter-day accuracies of the assay in all matrices and the automated DBS assay were well within the 85-115% acceptance limits at all concentrations tested. In addition, the intra- and inter-day imprecisions of the assay in the three matrices, including DBS (manual extraction,) were comparable and well within the acceptance limits of 15%. The only exception was the automated DBS extraction assay that interestingly seemed to be more variable than the DBS assay based on manual extraction with inter-day imprecisions slightly beyond the 15%. acceptance limit. One anticipated potential problem with the automated assay was that DBS are a relatively “dirty” matrix. In addition, the blood spots were eluted directly into the LC-MS/MS system without any prior sample processing such as protein precipitation as used in the manual DBS extraction procedure. However, the automated DBS assay proved to be very robust and batches of at least 100 samples could be run without noticeable loss of sensitivity due to contamination of the electrospray source. This suggested that the online extraction (see Figure 1) efficiently removed any relevant contaminations. Another potential concern with the SCAP equipment is carry-over, which was not observed. An advantage of the SCAP autosampler was that it automatically added the deuterated internal standard. It is reasonable to expect that this is critical to compensate for any matrix effects.
Table 1.
Comparison of inter-day and intra-day imprecision and accuracy for plasma (over 21 days), DBS (manual), CSF and automated DBS extraction (all over three days).
| Imprecision [RSD%] | Accuracy [% of Nominal] | ||||||
|---|---|---|---|---|---|---|---|
| Plasma | DBS | CSF | Plasma | DBS | CSF | ||
|
|
|||||||
| Concentration | |||||||
| Intra-day: | |||||||
| 198 ng/ml | 4.8 | 6.7 | 8.3 | 93.5 | 102.0 | 110.0 | |
| 593 ng/ml | 2.7 | 4.5 | 9.2 | 104.0 | 99.0 | 104.0 | |
| 16000 ng/ml | 3.4 | 4.0 | 4.0 | 106.0 | 105.0 | 89.5 | |
| Inter-day: | 198 ng/ml | 8.7 | 8.3 | 11.7 | 99.1 | 103.0 | 102.0 |
| 593 ng/ml | 3.4 | 6.3 | 10.9 | 107.0 | 104.0 | 100.0 | |
| 16000 ng/ml | 6.3 | 8.5 | 6.3 | 102.0 | 105.0 | 93.0 | |
| Automated Extraction | |||||||
| Intra-day: | 198 ng/ml | 17.8 | 94.9 | ||||
| 593 ng/ml | 5.8 | 96.5 | |||||
| 16000 ng/ml | 5.4 | 95.9 | |||||
| Inter-day: | 198 ng/ml | 8.1 | 96.4 | ||||
| 593 ng/ml | 15.3 | 90.2 | |||||
| 16000 ng/ml | 15.9 | 96.7 | |||||
Recently there has been increased interest in DBS as a minimally invasive, low volume sampling strategy [6-11] for pharmacokinetic studies in neonates, infants and small children [6,7]. Most acetaminophen pharmacokinetics studies in the literature were based on plasma samples. To be able to compare plasma and DBS pharmacokinetics results, it was important to study potential concentration differences in plasma and DBS. These may be caused by different distribution of the drug between plasma and cellular blood components. Indeed, Deming regression showed a surprisingly good correlation between plasma and DBS concentrations with r=0.98 (n=167). Bland-Altman analysis confirmed an average 26.6% positive bias of DBS compared to the corresponding plasma samples It can be hypothesized that acetaminophen preferably distributes into the blood cellular components. An extensive literature search did not reveal any previous data describing the blood-to-plasma distribution ratio of acetaminophen. This hypothesis was supported by the data in Table 2 that confirmed that the acetaminophen blood-to-plasma concentration ratios at the concentration levels tested were close to the observed DBS/plasma bias. Moreover, as the DBS/plasma sample cross-validation study were based on samples from healthy individuals who all had hematocrits within the normal range, the positive bias observed in DBS in comparison to plasma samples was unlikely to be affected by the hematocrit.
Dried blood spot analysis presents certain challenges such as the potential limitations introduced by the sampling method, such as the effect of the hematocrit on blood viscosity and thus the diffusion properties of the blood applied on paper [26]. Additional potential limitations include the more complex matrix of coagulated whole blood when compared to plasma or serum and the potential interactions with the filter paper matrix. Previous studies have reported that the punching of the dried blood spot is not a significant source of variability in terms of sample volume, as long as the punch is made in a completely saturated area, ideally in the center of the preprinted circle [26]. This is further supported by the present study. The good correlation between plasma and DBS would not have been possible if the DBS blood volumes in the punched filter paper spots had varied significantly.
Overall the accuracy and imprecision of acetaminophen concentrations in DBS matched those in plasma and the good correlation between DBS and plasma concentrations confirmed that DBS are a valid matrix for future acetaminophen pharmacokinetic studies.
Supplementary Material
Figure 5. Comparison of acetaminophen concentrations in plasma samples and corresponding DBS using Deming regression (n= 167 matching pairs collected at the same time).
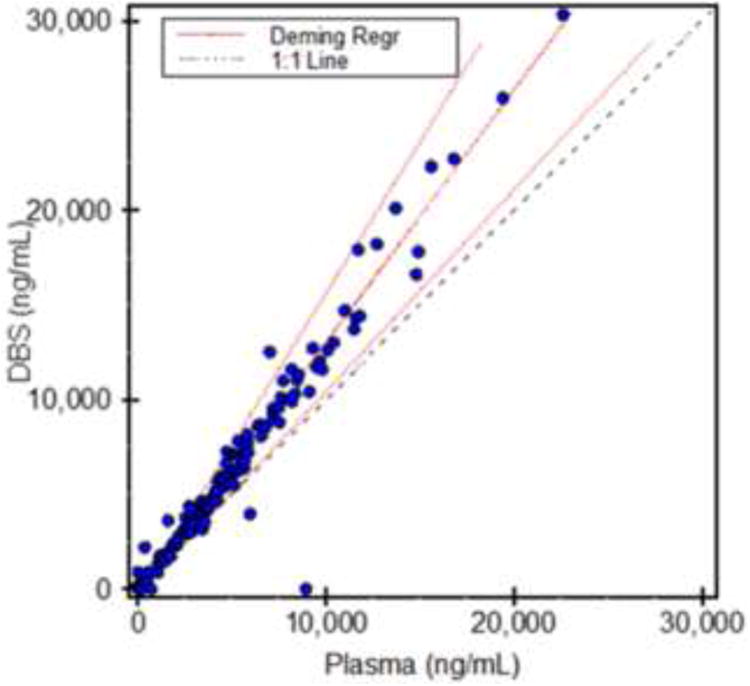
Data was analyzed using the EP Evaluator software (version 9.4., Data Innovations, South Burlington, VT).
Highlights.
Comparison of assay performance in plasma, CSF and dried blood spots (DBS).
Assay performance in DBS is similar to that of acetaminophen in plasma samples.
Automated DBS extraction met acceptance criteria, however, was inferior to manual extractions.
Matching DBS and plasma samples (n=167) from a clinical trial showed excellent correlation.
This comparison also showed a 26.6% positive bias of the DBS when compared to plasma.
Acknowledgments
This study was supported in part by the United States National Institutes of Health, grants P30 DK048520 Mass Spectrometry Core, UL1RR025780 and 3UL1RR025744-02S3 and a grant from Cadence Pharmaceuticals (San Diego, CA).
Abbreviations
- DBS
dried blood spots
- CSF
cerebro-spinal fluid
- CV%
coefficient of variance
- DMSO
dimethyl sulfoxide
- EDTA
ethylenediaminetetraacetic acid
- LLOD
lower limit of detection
- LLOQ
lower limit of quantitation
- QC
quality control
- RSD%
relative standard deviation
- SCAP
sample card and preparation
- U-HPLC
ultra-high performance liquid chromatography
Footnotes
Publisher's Disclaimer: This is a PDF file of an unedited manuscript that has been accepted for publication. As a service to our customers we are providing this early version of the manuscript. The manuscript will undergo copyediting, typesetting, and review of the resulting proof before it is published in its final citable form. Please note that during the production process errors may be discovered which could affect the content, and all legal disclaimers that apply to the journal pertain.
References
- 1.Macario A, Royal MA. A literature review of randomized clinical trials of intravenous acetaminophen (paracetamol) for acute postoperative pain. Pain Practice. 2011;11:290–296. doi: 10.1111/j.1533-2500.2010.00426.x. [DOI] [PubMed] [Google Scholar]
- 2.Allegaert K, Van der Marel CD, Debeer A, Pluim MA, Van Lingen RA, Vanhole C, Tibboel D, Devlieger H. Pharmacokinetics of single dose intravenous propacetamol in neonates: Effects of gestational age. Arch Dis Child Fetal Neonatal Ed. 2004;89:F25–F28. doi: 10.1136/fn.89.1.F25. [DOI] [PMC free article] [PubMed] [Google Scholar]
- 3.Autret E, Dutertre JP, Breteau M, Jonville AP, Furet Y, Laugier J. Pharmacokinetics of paracetamol in the neonate and infant after administration of propacetamol chlorhydrate. Dev Pharmacol Ther. 1993;20:129–134. doi: 10.1159/000457553. [DOI] [PubMed] [Google Scholar]
- 4.Granry JC, Rod B, Boccard E, Hermann P, Gendron A, Saint-Maurice C. Pharmacokinetics and antipyretic effects on an injectable pro-drug of paracetamol (propacetamol) in children. Paediatr Anaesth. 1992;2:291–295. [Google Scholar]
- 5.EMEA. [last accessed 12-11-2012];Guidelines on the Investigation of Medicinal Products in the Term and Preterm Neonate Doc Ref EMEA/267484/2007. http://wwwemaeuropaeu/docs/en_GB/document_library/Scientific_guideline/2009/09/WC500003754pdf.
- 6.Patel P, Mulla H, Tanna S, Pandya H. Facilitating pharmacokinetic studies in children: a new use of dried blood spots. Arch Dis Child. 2010;95:484–487. doi: 10.1136/adc.2009.177592. [DOI] [PubMed] [Google Scholar]
- 7.Pandya HC, Spooner N, Mulla H. Dried blood spots, pharmacokinetic studies and better medicines for children. Bioanalysis. 2011;3:779–786. doi: 10.4155/bio.11.19. [DOI] [PubMed] [Google Scholar]
- 8.Déglon J, Thomas A, Mangin P, Staub C. Direct analysis of dried blood spots coupled with mass spectrometry: concepts and biomedical applications. Anal Bioanal Chem. 2012;402:2485–2498. doi: 10.1007/s00216-011-5161-6. [DOI] [PubMed] [Google Scholar]
- 9.Keevil BG. The analysis of dried blood spot samples using liquid chromatography tándem mass spectrometry. J Clin Biochem. 2011;44:110–118. doi: 10.1016/j.clinbiochem.2010.06.014. [DOI] [PubMed] [Google Scholar]
- 10.Li W, Tse FL. Dried blood spot sampling in combination with LC-MS-MS for quantitative analysis of small molecules. Biomed Chromatogr. 2010;24:49–65. doi: 10.1002/bmc.1367. [DOI] [PubMed] [Google Scholar]
- 11.Edelbroek PM, van der Hejden J, Stlok LML. Dried blood spot methods in therapeutic drug monitoring: methods, assays, and pitfalls. Ther Drug Monit. 2009;31:327–336. doi: 10.1097/FTD.0b013e31819e91ce. [DOI] [PubMed] [Google Scholar]
- 12.Larson AM, Polson J, Fontana RJ, Davern TJ, Lalani E, Hynan LS, Reisch JS, Schoidt FV, Ostapowicz G, Shakil AO, Lee WM. Acetaminophen-induced acute liver failure: results of a United States multicenter, prospective study. Hepatology. 2005;42:1364–1372. doi: 10.1002/hep.20948. [DOI] [PubMed] [Google Scholar]
- 13.Ostapowicz G, Fontana RJ, Schiodt FV, Larson A, Davern TJ, Han SH, McCashland TM, Shakil AO, Hey JE, Hynan L, Crippin JS, Blei AT, Samuel G, Reisch J, Lee WM. Results of a prospective study of acute liver failure at 17 tertiary care centers in the United States. Ann Intern Med. 2002;137:947–954. doi: 10.7326/0003-4819-137-12-200212170-00007. [DOI] [PubMed] [Google Scholar]
- 14.Bond GR, Novak JE. The human and economic cost of paracetamol (acetaminophen) overdose. Pharmacoeconomics. 1995;8:177–181. doi: 10.2165/00019053-199508030-00001. [DOI] [PubMed] [Google Scholar]
- 15.Hinson JA, Roberts DW, James LP. Mechanisms of acetaminophen-induced liver necrosis. Handb Exp Pharmacol. 2010;196:369–405. doi: 10.1007/978-3-642-00663-0_12. [DOI] [PMC free article] [PubMed] [Google Scholar]
- 16.Heubi JE, Barbacci MB, Zimmerman HJ. Therapeutic misadventure with acetaminophen: hepatotoxicity after multiple doses in children. J Pediatr. 1998;132:22–27. doi: 10.1016/s0022-3476(98)70479-2. [DOI] [PubMed] [Google Scholar]
- 17.Makin AJ, Wendon J, Williams R. A 7-year experience of severe acetaminophen-induced hepatotoxicity. Gastroenterology. 1995;109:1907–1916. doi: 10.1016/0016-5085(95)90758-0. [DOI] [PubMed] [Google Scholar]
- 18.Thummel KE, Lee CA, Kunze KL, Nelson SD, Slattery JT. Oxidation of acetaminophen to N-acetyl-p-benzoquinone imine by human CYP3A4. Biochem Phamacol. 1993;45:1563–1569. doi: 10.1016/0006-2952(93)90295-8. [DOI] [PubMed] [Google Scholar]
- 19.Center for Drug Evaluation and Research (CDER) [last accessed September 22, 2012];Guidance for Industry, Bioanalytical Method Validation. 2001 http://wwwfdagov/downloads/Drugs/GuidanceComplianceRegulatoryInformation/Guidances/UCM070107pdf.
- 20.Matuszewski BK, Constanzer ML, Chavez-Eng CM. Strategies for the assessment of matrix effect in quantitative bioanalytical methods based on HPLC-MS/MS. Anal Chem. 2003;75:3019–3030. doi: 10.1021/ac020361s. [DOI] [PubMed] [Google Scholar]
- 21.Müller C, Schafer P, Stortzel M, Vogt S, Weinmann W. Ion suppression effects in liquid chromatography-electrospray-ionisation transport-region collision induced dissociation mass spectrometry with different serum extraction methods for systematic toxicological analysis with mass spectra libraries. J Chromatogr B Analyt Technol Biomed Life Sci. 2002;773:47–52. doi: 10.1016/s1570-0232(02)00142-3. [DOI] [PubMed] [Google Scholar]
- 22.Tonoli D, Varesio E, Hopfgartner G. Quantification of acetaminophen and two of its metabolites in human plasma by ultra-high performance liquid chromatography-low and high resolution tandem mass spectrometry. J Chromatogr B Analyt Technol Biomed Life Sci. 2012;904:42–50. doi: 10.1016/j.jchromb.2012.07.009. [DOI] [PubMed] [Google Scholar]
- 23.Li W, Doherty JP, Kulmatycki K, Smith HT, Tse FL. Simultaneous LC-MS/MS quantitation of acetaminophen and its glucuronide and sulfate metabolites in human dried blood spot samples collected by subjects in a pilot clinical study. Bioanalysis. 2012;4:1429–1443. doi: 10.4155/bio.12.119. [DOI] [PubMed] [Google Scholar]
- 24.Miller JH, IV, Poston PA, Karnes HT. Direct analysis of dried blood spots by in-line desorption combined with high-resolution chromatography and mass spectrometry for quantification of maple syrup urine disease biomarkers leucine and isoleucine. Anal Bioanal Chem. 2011;400:237–244. doi: 10.1007/s00216-011-4740-x. [DOI] [PubMed] [Google Scholar]
- 25.Heinig K, Wirz T, Bucheli F, Gajate-Perez A. Determination of oseltamivir (Tamiflu) and oseltamivir carboxylate in dried blood spots using offline or online extraction. Bioanalysis. 2010;3:421–437. doi: 10.4155/bio.11.4. [DOI] [PubMed] [Google Scholar]
- 26.Mei JV, Alexander JR, Adam BW, Hannon WH. Use of filter paper for the collection and analysis of human whole blood specimens. J Nutr. 2001;131:1631S–1636S. doi: 10.1093/jn/131.5.1631S. [DOI] [PubMed] [Google Scholar]
Associated Data
This section collects any data citations, data availability statements, or supplementary materials included in this article.