Abstract
The shape of the human face and skull is largely genetically determined, but the genetic drivers of craniofacial morphology remain poorly understood. Here we used a combination of epigenomic profiling, in vivo characterization of candidate enhancer sequences in transgenic mice, and targeted deletion experiments to examine the role of distant-acting enhancers in craniofacial development. We identified complex regulatory landscapes, consisting of enhancers that drive a remarkable spatial complexity of developmental expression patterns. Deletion of individual craniofacial enhancers from the mouse genome resulted in significant alterations of craniofacial shape, demonstrating their functional importance in defining face and skull morphology. These results demonstrate that enhancers play a pervasive role in mammalian craniofacial development and suggest that enhancer sequence variation contributes to human facial morphology.
Introduction
The shape of the face is one of the most distinctive features among humans, and differences in facial morphology have substantial implications in many areas, including social interaction, psychology, forensics, and clinical genetics (1–3). The resemblance of facial shapes within families in general, and between monozygotic twins in particular, suggests a major contribution of genetic factors to craniofacial morphology (4–6). Many protein-coding genes whose disruption causes major aberrations of craniofacial morphology are known. This includes pathological dysmorphologies of the face itself, such as clefts of the lip or palate, as well as distinctive facial features associated with genetic syndromes that are indicative of associated pathologies in other organ systems (7–14). In contrast to these disease-associated genes, the genetic drivers of normal craniofacial variation remain poorly understood. A small number of candidate genes have been implicated in variation of craniofacial shape through genome-wide association studies, but collectively they explain only a minute fraction of the morphological variation observed in human populations (15–17). It remains a central question how complex traits such as the overall shape of the face can be modulated in quantitatively subtle ways, while avoiding the often severe consequences associated with protein-coding mutations (18).
Recent observations of large numbers of distant-acting transcriptional enhancers in mammalian genomes (19, 20) raise the possibility that these sequences play a significant role in the development of structures like the craniofacial complex. Enhancers typically have highly restricted in vivo activity patterns and often control the expression of their target genes in a modular fashion, where different enhancers activate the expression of the same gene in different cell types, anatomical regions, or at different developmental time points (21). In principle, such complex arrays of enhancers acting on individual genes may provide a general mechanism for the independent fine tuning of distinct aspects of gene expression in different developmental processes, which in turn may affect specific phenotypic traits including facial shape (22). This model is consistent with the extensive studies of the genes and gene regulatory networks involved in the development of the neural crest, a cell population contributing to multiple tissues including facial bone and cartilage (23). In-depth studies of individual genes involved in neural crest development (e.g., (24–26)), as well as genome-wide studies of regulatory sequences active in human neural crest cells (27) support that many genes involved in craniofacial development are associated with complex regulatory architecture. However, owing to the lack of systematic genome-scale in vivo studies, the genomic location and spatiotemporal activity patterns of such craniofacial in vivo enhancers remain poorly understood. In the present study we use an epigenomic method on whole face tissue to explore the genome-wide landscape of craniofacial enhancers, and study their involvement in defining craniofacial morphology using large-scale transgenic reporter assays and enhancer knockout studies in mice.
Identification of in vivo Craniofacial Enhancers
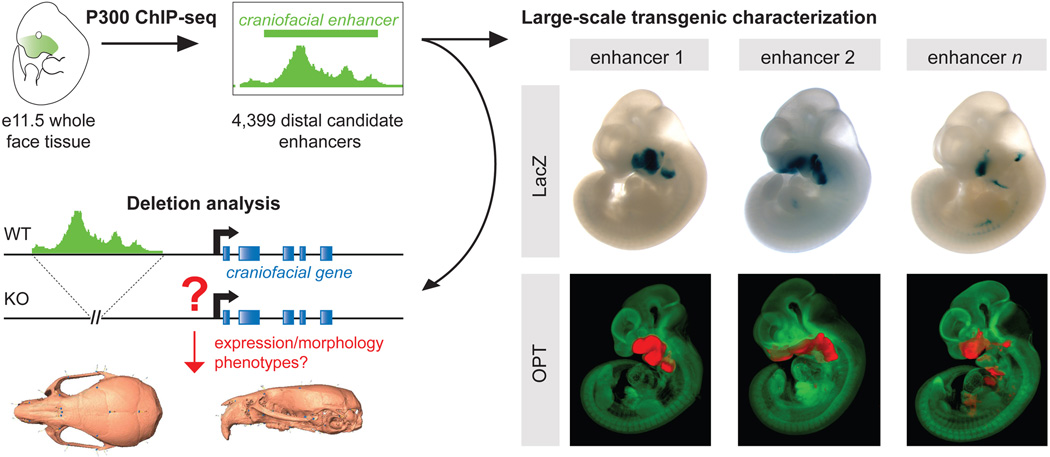
To identify craniofacial developmental enhancers on a genome-wide scale, we performed ChIP-seq analysis on mouse embryonic day (e) 11.5 facial tissue with the enhancer-associated p300 protein (21) (fig. 1). At this developmental time point, key events of craniofacial development are in progress, including growth and morphogenetic processes affecting the size, shape and structure of all major craniofacial prominences (28, 29). All major facial subregions were included in this tissue preparation (30), building on the previously described efficiency of this inclusive approach to identify enhancers with both broad and tightly confined patterns in subregions of developing embryonic structures (31, 32).
Fig. 1. Study Overview.
P300 ChIP-seq was performed on whole mouse face tissue from e11.5 embryos, which identified 4,399 putative distant-acting craniofacial enhancers. More than 200 craniofacial candidate enhancers were characterized in depth through LacZ transgenesis in mouse embryos (LacZ panel), and selected enhancers were further analyzed by optical projection tomography (OPT panel; unstained tissue is shown in green, LacZ stained tissue is shown in red). Furthermore, a panel of three enhancers near functionally unrelated genes was studied by knockout analysis and detailed skull morphometry in mice.
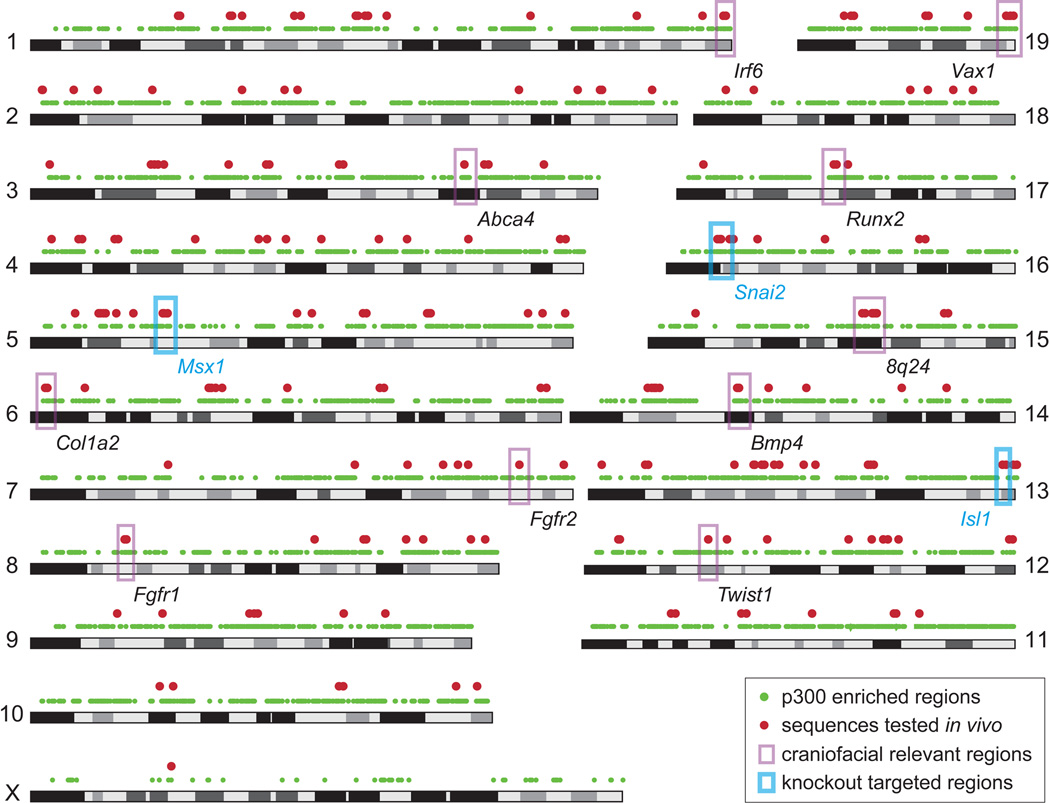
Enrichment analysis identified 4,399 distal candidate enhancers genome-wide, defined as regions that showed significant p300 binding in craniofacial tissue and were at least 2.5kb from known transcription start sites (fig. 2, table S1 and S2). Candidate enhancers were located at a median distance of 44kb from the nearest transcript start site, with 38.4% in introns of genes and 54.7% located in non-coding regions outside of genes (intergenic). The majority of candidate enhancers also showed evidence of significant evolutionary constraint (87.5%, table S1) and had unique orthologous sequences in the human genome (96.7%). Unbiased ontology analysis (33) revealed that candidate craniofacial enhancers are enriched near genes that are known to cause craniofacial phenotypes when deleted in mouse models or mutated in humans (table 1). Candidate craniofacial enhancers were also significantly enriched at loci implicated in human craniofacial traits and birth defects through genome-wide association studies (fig. S1). These observations are consistent with a role of the identified enhancer candidate sequences in the regulation of genes with known roles in craniofacial development. Taken together, these results suggest that thousands of distant-acting enhancers are involved in orchestrating the genome-wide gene expression landscape during craniofacial development.
Fig. 2. Genome-wide identification of candidate craniofacial enhancers.
Mouse genome graph showing all p300-enriched regions (green dots) and all 281 sequences tested in vivo or re-examined for craniofacial activity in this study (red dots). Examples of selected major craniofacial genes (34) and genomic regions (e.g., 8q24 (35), ABCA4 (36)) are highlighted by pink boxes. Known craniofacial loci were generally enriched in candidate sequences and were specifically targeted for sampling in transgenic assays (red dots). The three genomic regions studied by knockout analysis are highlighted by blue boxes.
Table 1. Top enriched annotations of mouse and human phenotypes associated with candidate craniofacial enhancers.
Top: Ten of the twelve most significantly enriched terms from the Mouse Phenotype ontology directly relate to craniofacial development. The remaining two phenotypes (abnormal axial skeleton morphology and abnormal skeleton development, not shown) relate to general skeleton development, a process that shares key signaling pathways with cranial skeleton development (37). Bottom: Six of the ten most significantly enriched terms from the Human Phenotype ontology are relevant to craniofacial development. The four remaining phenotypes (not shown) are all associated with limb abnormalities, consistent with previous knowledge of shared developmental pathways during limb and face development (38–40). In each analysis, only terms exceeding 2-fold binomial enrichment were considered and ranked by P-value (binomial raw P-values).
| Rank | Phenotype Term | Binomial P-value |
Binomial Fold Enrichment |
|---|---|---|---|
| Mouse phenotypes | |||
| 1 | abnormal craniofacial morphology | 5.8e-110 | 2.0 |
| 3 | abnormal head morphology | 1.7e-88 | 2.1 |
| 4 | abnormal craniofacial development | 3.8e-82 | 2.4 |
| 5 | abnormal craniofacial bone morphology | 1.3e-78 | 2.1 |
| 6 | abnormal facial morphology | 5.5e-78 | 2.2 |
| 7 | abnormal cranium morphology | 3.1e-77 | 2.2 |
| 9 | abnormal mouth morphology | 3.5e-72 | 2.3 |
| 10 | abnormal orofacial morphology | 1.5e-71 | 2.3 |
| 11 | abnormal viscerocranium morphology | 1.0e-62 | 2.3 |
| 12 | abnormal neurocranium morphology | 2.1e-60 | 2.5 |
| Human phenotypes | |||
| 2 | malar hypoplasia | 3.6e-17 | 2.4 |
| 3 | abnormality of the midface | 7.6e-17 | 2.3 |
| 5 | abnormal location of ears | 5.7e-16 | 2.1 |
| 7 | low-set ears | 1.1e-15 | 2.1 |
| 8 | abnormality of the fontanelles and cranial sutures | 1.2e-15 | 2.2 |
| 9 | abnormality of the calvarium | 1.3e-15 | 2.1 |
Large-scale Transgenic Analysis of Craniofacial Enhancers
ChIP-seq performed directly on craniofacial tissues provided a genome-wide catalogue of sequences that are likely to be active in vivo enhancers during craniofacial development at e11.5. However, this approach does not provide direct insight into the exact activity patterns of individual candidate enhancer sequences. To examine craniofacial enhancer activity patterns in detail, we used transgenic enhancer reporter assays in mice, coupled to high-resolution three-dimensional mapping of LacZ reporter activities by optical projection tomography (OPT) (fig. 1 and (30)) (41, 42). Since many, but not all in vivo enhancers can be identified by p300 binding (43), we also considered sequence conservation (41) and proximity to genes or loci with a known role in craniofacial development as additional criteria in the selection of candidate sequences. In total, we tested 205 candidate sequences in transgenic mice, with the majority (123 or 60%) located within or near regions associated with craniofacial development through experimental, genetic or genome-wide association studies (see table S3 for properties of all tested candidate sequences). Each candidate enhancer sequence was coupled to a minimal promoter and used to generate multiple transgenic embryos by pronuclear injection (30). Only patterns that were independently observed in at least three different embryos were considered reproducible. In total, 121 of 205 tested sequences showed reproducible reporter gene expression in at least one craniofacial structure. We further extended the set of in vivo characterized craniofacial enhancers by re-examining data from previously described large-scale enhancer screens not specifically targeted at craniofacial enhancer discovery (21, 31, 32, 41, 44–46), providing an additional 75 craniofacial enhancers (table S3). Transgenic results for all 196 craniofacial enhancers identified or re-examined in this study are available through the Vista Enhancer Browser (http://enhancer.lbl.gov) or the NIDCR FaceBase consortium web site (http://facebase.org) (47).
To gain higher-resolution insight into the three-dimensional activity patterns of craniofacial enhancers in the context of developing embryos, we used optical projection tomography (OPT). In total, representative embryos for 55 craniofacial enhancers, including 48 that were newly identified in this study, were analyzed by OPT. Selected examples of three-dimensional views are provided as supplementary movies (movies S1–S11). More comprehensive OPT data collections can be interactively explored through a dedicated viewer at the NIDCR FaceBase database (see fig. S2) (47). Examination of this large set of in vivo-validated and characterized craniofacial enhancers highlights several salient features and resulting potential applications of these data sets, which we will describe using selected examples. Specifically, this collection of enhancers 1) identifies a remarkable diversity of enhancer activity patterns, highlighting the regulatory complexity of the genetic code; 2) enables the dissection of the regulatory landscapes of individual genes known to be involved in craniofacial development; 3) provides a starting point for the mechanistic exploration of genomic intervals implicated in craniofacial development through genome-wide association studies.
Diversity of Patterns
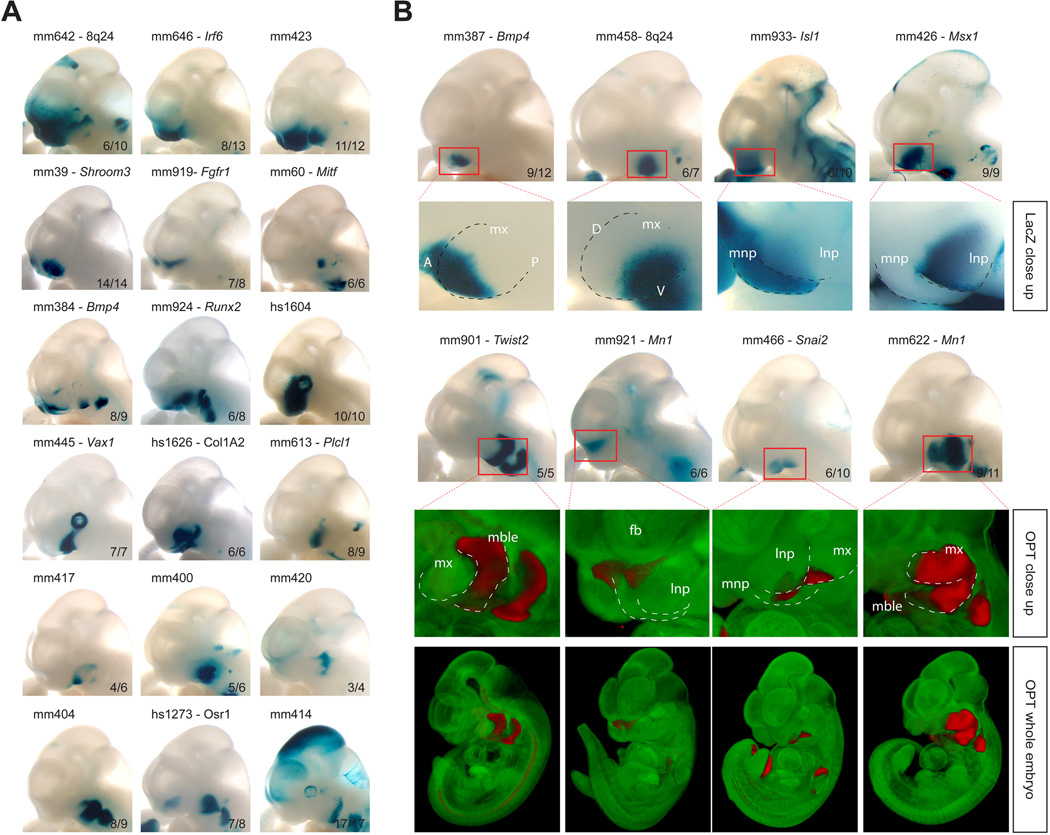
To illustrate the reproducibility and diversity of craniofacial activity patterns identified in transgenic embryos, selected examples of enhancers identified in this study are shown in fig. 3A. For all craniofacial prominences (medial nasal, lateral nasal, maxillary, and mandibular), structure-specific active enhancers were identified (see fig. 3A and S4A for a schematic view of the e11.5 mouse face). In depth analysis of craniofacial activity patterns through the combined use of whole-mount LacZ staining and OPT imaging revealed that in many cases only subregions of these structures were reproducibly targeted by an enhancer. For example, enhancer mm387 drives expression in the anterior part of the maxillary prominence while enhancer mm458 is restricted to a posterior ventral region (fig. 3B, top). Similar region-specific activities are observed in other facial substructures such as the nose, where enhancer mm933 is active in the medial nasal prominence, while the activity of enhancer mm426 is confined to the lateral nasal prominence (fig. 3B, top). OPT scans of whole-mount embryos provide additional spatial information about enhancer activity pattern by capturing the activity signal in internal embryonic structures (fig. 3B, bottom). These data highlight the complexity, diversity, and spatially highly restricted activity patterns of distant-acting enhancer sequences active during craniofacial development.
Fig. 3. Transgenic characterization of craniofacial candidate enhancers results in the identification of facial substructure-specific enhancers.
(A) Selection of 18 reproducible craniofacial enhancers at e11.5 illustrates the broad spectrum of activity patterns observed in vivo. For each tested candidate enhancer, one representative embryo face is shown, the reproducibility of each pattern among multiple transgenic founder embryos is indicated at the right bottom corner of each image. For each element, the nearest relevant craniofacial gene, if any, is also provided. Additional embryo images obtained with each enhancer construct can be viewed at http://enhancer.lbl.gov or http://facebase.org. (B) Upper panel: Four examples of highly restricted specificity to craniofacial substructures (see main text). Lower panel: Four examples of internal enhancer activity captured by OPT scanning of LacZ stained embryos. Green: no LacZ activity (enhancer inactive), red: LacZ activity (enhancer active). A, anterior; D, dorsal; fb, forebrain; lnp, lateral nasal prominence; mble, mandibular process; mnp, medial nasal prominence; mx, maxillary process; P, posterior; V, ventral.
Regulatory Landscapes of Craniofacial Genes
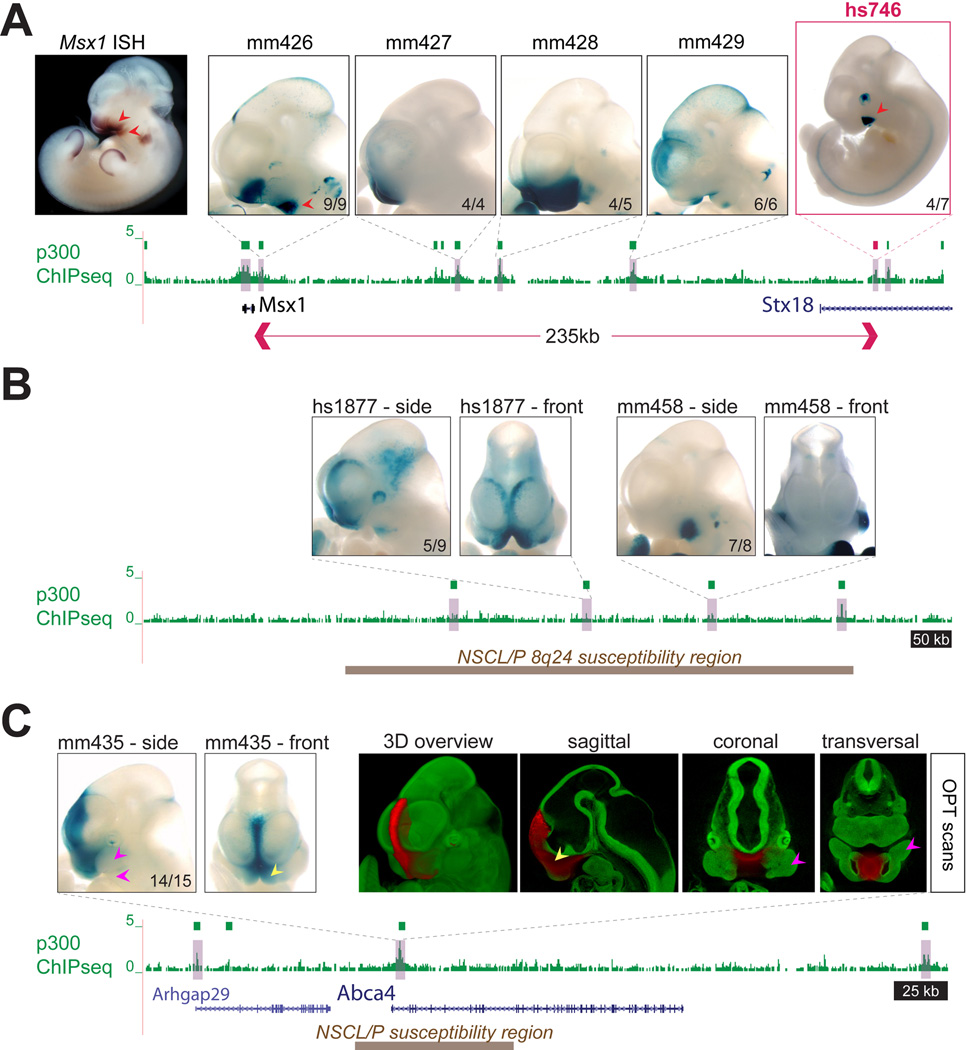
Systematic screening of individual genomic loci via ChIP-seq followed by transgenic characterization enables functional dissection of the distant-acting enhancer landscapes of individual genes with known roles in craniofacial development. As an example, mouse Msx1 and human MSX1 have been extensively studied for their role in craniofacial development (supplementary online text and (48)). Msx1 is surrounded by several hundred kilobases of non-coding DNA, which renders the search for distant-acting enhancers by tiling approaches challenging. Transgenic testing of seven candidate sequences identified by ChIP-seq and located up to 235kb away from the Msx1 transcription start site resulted in the identification of five distinct craniofacial enhancers potentially regulating its expression (fig. 4A). At e11.5, each of these enhancers drove patterns that partially recapitulated the endogenous Msx1 RNA expression. For instance, Msx1 activity in the second branchial arch and in the maxillary process of the e11.5 embryo is recapitulated by the combined activity of two separate enhancers located at 1kb and 235kb upstream of the promoter (mm426 and hs746, fig. 4A). These observations support the notion that complex spatial expression patterns of key developmental genes are driven by modular arrays of distant-acting enhancers (49) and highlights the potential of enhancers to provide a mechanism for fine tuning of in vivo gene expression patterns.
Fig. 4. Regulatory landscapes of craniofacial loci.
(A) Craniofacial enhancers near Msx1, a major craniofacial gene, were identified by p300 ChIP-seq (green boxes). This included the re-identification of a region proximal to Msx1 with previously described enhancer activity (mm426, (50)), as well as four additional, more distal enhancers with complementary activity patterns. For each enhancer, only one representative embryo is shown, numbers indicate reproducibility. Red arrows indicate selected correlations between Msx1 RNA expression (ISH) and individual enhancers (see main text). Red box indicates enhancer hs746 which was further studied by knockout analysis. Msx1 ISH: Embrys database (http://embrys.jp) (51). (B) Identification of craniofacial enhancers in the cleft- and morphology-associated gene desert at human chromosome 8q24 (orthologous mouse region shown, (35)). Brown box indicates the region corresponding to a 640kb human region associated with orofacial clefts (non-syndromic cleft lip with or without cleft palate, NSCL/P) and devoid of protein-coding genes. Two of four candidate enhancers within the region drove craniofacial expression. For each enhancer, lateral and frontal views of one representative embryo are shown. (C) Identification of a craniofacial midline enhancer at the cleft-associated susceptibility interval at the ABCA4 locus (36). The enhancer is highly active in the nasal prominences (yellow arrows), but not the maxillary or mandible (pink arrows).
Craniofacial Enhancers within Disease-Associated Intervals
To illustrate the utility of these enhancer datasets in the follow-up of genome-wide association, population scale sequencing, and candidate locus studies, 50 candidate enhancers mapping to intervals implicated in craniofacial morphology or orofacial birth defects through human genetic studies were included in the transgenic assays (see table S3). Trait-associated variants that map to non-coding genome regions or are not linked to any protein-altering variants are a common challenge in the interpretation of such genetic studies. A prototypical example is the gene desert at human chromosome 8q24. A 640kb region in this interval is devoid of protein-coding genes, but is a major susceptibility locus for cleft palate with a calculated population attributable risk of 41% (35, 52, 53) and is significantly linked to normal variation in several facial morphology traits (16). We identified four craniofacial enhancer candidate sequences in this risk interval, two of which drive reproducible craniofacial reporter activity at e11.5 in transgenic mice (fig. 4B). As a second example, we examined the 1p22 locus. In this interval, markers located near and within the ABCA4 gene are associated with an increased risk for cleft palate, but it remains unclear whether these variants are linked to deleterious protein-coding mutations of ABCA4 (36, 54). Based on RNA expression data the neighboring gene ARHGAP29, rather than ABCA4 itself, has been proposed to be causatively involved in craniofacial development (55). However, ARHGAP29 falls outside the genomic boundaries of the risk-associated linkage block. By scanning the region comprising these two genes for possible associated enhancers, we identified a human-mouse conserved sequence in the first intron of Abca4 that drove highly reproducible reporter activity in the facial midline, a pattern reminiscent of Arhgap29 RNA expression, suggesting that this enhancer may drive expression of Arhgap29 during craniofacial development (fig. 4C and movie S10) (56). A causative effect of sequence or copy number variants in these particular enhancers on craniofacial morphology remains to be demonstrated, furthermore we cannot exclude the existence of additional enhancer sequences at these loci that were not captured in the present screen. These possible limitations notwithstanding, our results illustrate the utility of collections of validated enhancers as starting points for the mechanistic interpretation of human genetic studies by linking functional genomic and human genetic data sets.
Targeted Deletions of Craniofacial Enhancers
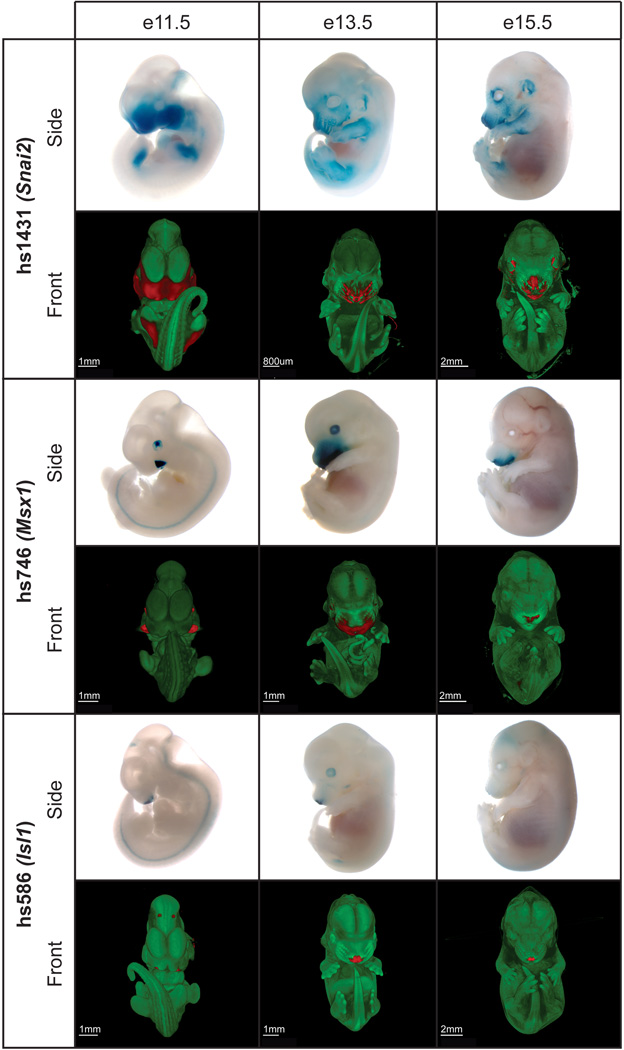
The existence of large numbers of distant-acting enhancers with precise tissue-specific activities during craniofacial development raises the question of their functional impact on craniofacial morphology through the regulation of their respective target genes. To examine such contributions in more detail, we selected three enhancers with highly reproducible craniofacial activity patterns and explored their functions through targeted deletions in mice (fig. 1). The three enhancers, termed hs1431 (near Snai2), hs746 (near Msx1) and hs586 (near Isl1), were chosen based on their association with known craniofacial genes (7, 57, 58) (see supplementary online text), the robustness of their activity patterns, and the absence of additional known enhancers with overlapping activity near the same gene. Furthermore, the in vivo activity patterns driven by these enhancers partially recapitulate the known expression patterns of their presumptive target genes (fig. 4A and fig. S3). The enhancers were intentionally chosen from different, functionally unrelated loci in order to provide a representative sample of the genome-wide enhancer data set, rather than an in-depth exploration of a single gene or pathway. All selected enhancers are located at a very long distance from their respective target genes (350kb, 235kb and 190kb respectively) and are active in the craniofacial complex through multiple stages of embryonic development (fig. 4A, fig. S3, fig. 5 and movies S1–S9).
Fig. 5. Developmental activity patterns of three enhancers selected for deletion studies.
The in vivo activity of each enhancer was monitored at different stages of development (e11.5, e13.5 and e15.5). All enhancers were reproducibly active in the craniofacial complex during embryonic development, with spatial changes in activity across stages. Side views, LacZ-stained whole-mount embryos. Front views, optical projection tomography reconstructed 3D images. Regions of enhancer activity are shown in red. Also see movies S1–S9.
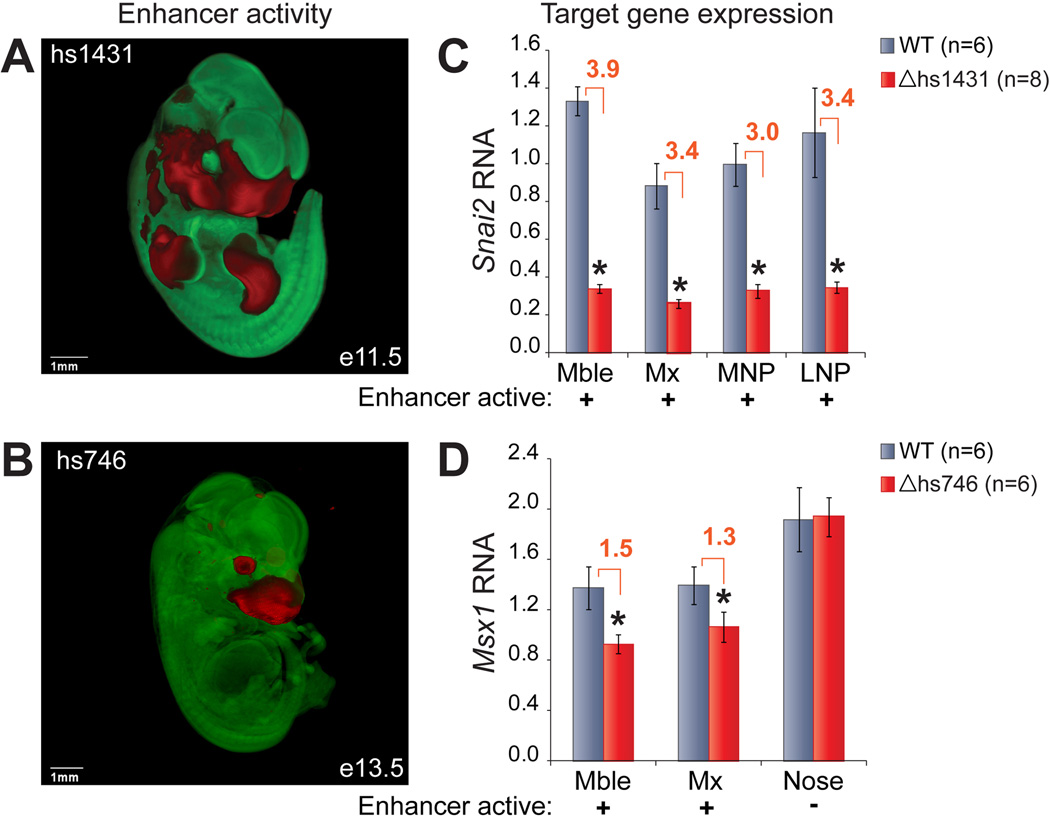
To test if these enhancers play a role in modulating craniofacial morphology, we created three separate mouse lines carrying deletion alleles for each of the three enhancers using a standard homologuous recombination strategy in embryonic stem cells (30). Mice homozygous for any of the three enhancer deletions do not display gross craniofacial malformations or other obvious deficiencies. To evaluate the effect of each enhancer deletion on the expression of the presumptive target genes (Snai2, Msx1 and Isl1), we used quantitative RT-PCR to measure transcript levels in different craniofacial structures of individual wild-type and enhancer deletion embryos (littermates) at e11.5 and e13.5 (fig. 6 and fig. S4). Depending on time-point and substructure, we observed up to 3.9-fold down-regulation (P=4e-05) of Snai2 in homozygous Δhs1431 embryos, 1.5-fold down-regulation (P=0.015) of Msx1 in Δhs746 and 1.3-fold down-regulation (P=0.04) of Isl1 in Δhs586 (fig. 6C, D and fig. S4E). Notably, in all cases the changes in transcript levels of the respective target gene were confined to subregions in which the enhancer was active. However, not all subregions with enhancer reporter activity showed significant down-regulation of the target gene. These observations raise the possibility of partial functional redundancy between the enhancers studied here and overlapping regulatory activities from gene promoters or additional distant-acting enhancers that were not captured in our genome-wide screen. Regardless of the presence of possible additional regulatory sequences in these genome intervals, these results provide direct evidence for the requirement of enhancers for normal gene expression during craniofacial development.
Fig. 6. Expression phenotypes resulting from craniofacial enhancer deletions.
(A, B) In vivo activity pattern of hs1431 (at e11.5) and hs746 (at e13.5). OPT data is represented in red (LacZ, enhancer active) and green (no LacZ, enhancer inactive). (C, D) Expression levels of enhancer target genes in craniofacial tissues dissected from wild-type (gray) and knockout (red) littermate embryos. Error bars show the variation among individuals of the same genotype (SEM). *, P < 0.05 (Student T-test, 1-tailed); Mble, mandibular; Mx, maxillary; MNP, medial nasal process; LNP, lateral nasal process.
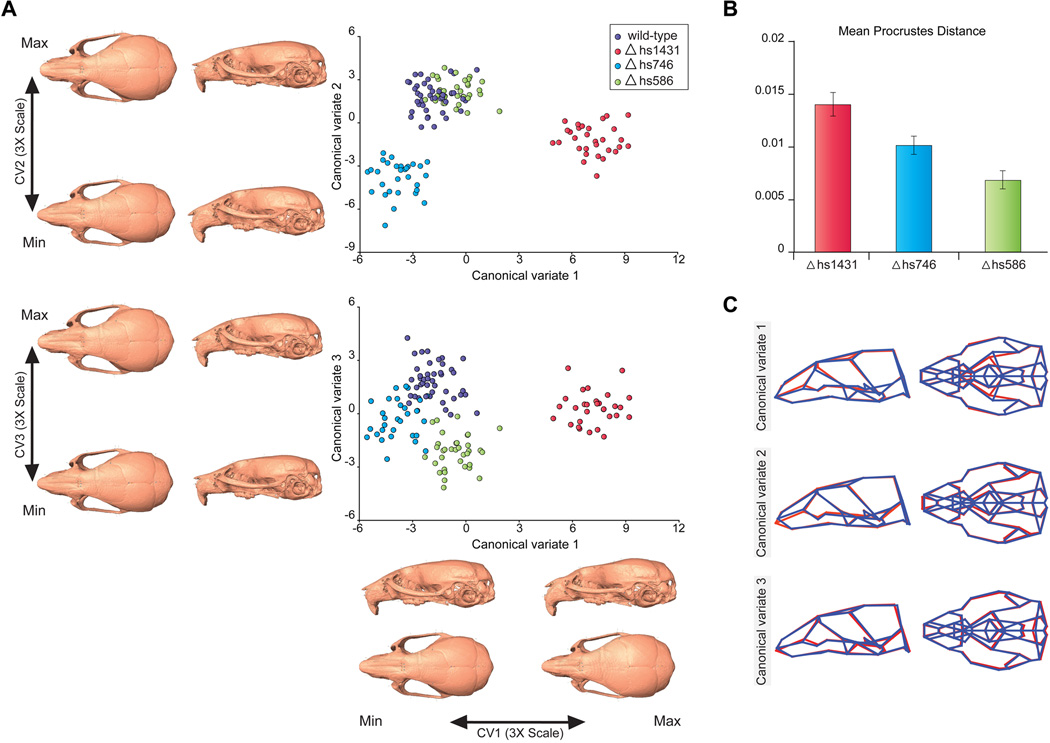
To examine if the deletion of these enhancers had a significant impact on craniofacial development beyond expression phenotypes, we compared mouse skulls from wild-type and enhancer deletion mice at eight weeks of age. Since it is challenging to quantify possible differences in craniofacial morphology by visual observation alone, we used micro-computed tomography (micro-CT) to obtain accurate three-dimensional measurements of the skulls. Three cohorts, each consisting of at least 30 mice homozygous for a deletion of one of the three enhancers, were compared to a cohort of 44 wild-type littermates. Micro-CT reconstructions of each mouse head were measured using 54 standardized skeletal landmarks (fig. S5). The cohorts of wild-type and enhancer deletion mice were compared using canonical variate analysis (CVA) to identify possible changes in craniofacial morphology resulting from the enhancer deletions (fig. 7). Procrustes ANOVA (F=12.0, p<0.0001) and MANOVA (Pillau’s Trace 2.5, p<0.0001) tests both showed that enhancer deletion genotypes were significantly associated with alterations of craniofacial shape. All individual pair-wise permutation tests (Procrustes distances) between wild-type and enhancer deletion lines revealed significant differences (table S4), with the most pronounced differences observed for Δhs1431 and Δhs746 (both P<0.0001 compared to wild-type). Differences between wild-type, Δhs1431, and Δhs746 mice were also significant after Bonferroni adjustment for the 6 pairwise comparisons between groups. The largest magnitude of effect on shape was observed for Δhs1431, followed by an intermediate quantitative effect for Δhs746 (fig. 7B), whereas possible changes in Δhs586 were mildest and sub-significant after correction for multiple hypothesis testing. These results mirror the magnitude of expression phenotypes, which were most pronounced in Δhs1431, followed by intermediate changes in Δhs746 and only a limited expression phenotype observed in Δhs586 (fig. 6 and fig. S4). In summary, these results demonstrate a significant effect of enhancer deletions on craniofacial morphology.
Fig. 7. Enhancer deletions cause changes of craniofacial morphology.
(A) Canonical variate analysis (CVA) of micro-CT data from mice with three different enhancer deletions, compared to wild-type. The 3D morphs show the morphological variation that corresponds to the first three canonical variates. Renderings show CV endpoints 3× expanded to improve visualization. (B) Magnitude of shape differences between wild-type and enhancer null mice, based on Procrustes distances (30). Error bars indicate standard deviation of shape differences from resampling Procrustes distances across 10,000 iterations. (C) Wireframe visualization of the first three canonical variates, which are predominantly driven by morphological differences between wild-type mice and Δhs1431, Δhs746 and Δhs586, respectively. CV endpoints are superimposed as red and blue wireframes, respectively.
Each enhancer deletion causes a distinct set of differences compared to wild-type morphology. This is evident from the CVA, where the first three canonical variates (CV1-CV3) most clearly separate wild-type mice from Δhs1431, Δhs746, and Δhs586 respectively (fig. 7). Each enhancer deletion produces phenotypic effects that are not confined to a single feature, but involve multiple regions of the skull (fig. 7C, movies S12–S20). For example, deletion of hs1431 results in an increase in facial length, a relative increase in the width of the anterior neurocranium and a shortening of the anterior cranial base. In contrast, Δhs746 results in a shortening of the face, a widening of the posterior neurocranium, a narrowing of the palate and shortening of the cranial base. While both Δhs1431 and Δhs746 have significant effects on facial morphology in structures derived from regions with enhancer activity at e11.5 and e13.5 (fig. 6), there are also changes in other parts of the skull. These correlated patterns of change are consistent with numerous studies demonstrating that cranium development is a highly integrated process, and that variation of the skull is structured by complex interactions between the growing chondrocranium, neurocranium and other nearby tissues (59, 60). Regardless of the precise molecular pathways and developmental mechanisms that underlie the morphological changes observed upon deletion of these enhancers, these results demonstrate a direct role of distant-acting enhancers in the development of craniofacial shape in mammals. The observation of significant, but non-pathological alterations of craniofacial morphology as a result of enhancer deletions supports the notion that enhancers contribute to normal variation in facial shape.
Conclusions
The general shape of the human face and skull, the differences in facial shape between individuals, and the high heritability of facial shape are subjects of broad interest, since they have far-reaching implications well beyond basic scientific and biomedical considerations. Despite rapid progress in the development of tools for correlating genetic and genomic information with phenotypic traits in human populations, the genetic drivers of variation in craniofacial features remain poorly explored. In this study, we examined the possible impact of distant-acting regulatory sequences on craniofacial morphology. Throughout the genome, we identified several thousand sequences that are likely to be distant-acting enhancers active in vivo during mammalian craniofacial development. While this epigenomic analysis was performed in the mouse, the vast majority of these enhancer candidate sequences are conserved between mouse and human. Large-scale characterization of more than 200 candidate sequences in transgenic mice showed the versatility of enhancers in orchestrating gene expression during craniofacial development. These observations are consistent with genome-wide analyses of enhancers active in human neural crest cells, as well as studies of regulatory sequences associated with individual members of the neural crest gene regulatory network (23–27). We also demonstrated that deletion of craniofacial enhancers results in non-pathological, but significant changes in craniofacial morphology in mice. Taken together, these data support that enhancers play a substantial role in determining craniofacial shape. Systematic genome-wide studies of normal morphological variation in human populations are beginning to emerge (15–17) and will offer the opportunity to intersect in vivo-derived genome-wide maps of craniofacial enhancers identified in this study with variation data, to gain further mechanistic insight into the molecular underpinnings of human facial shape and variation therein.
Beyond the spectrum of normal morphological variation in craniofacial shape, these results also provide a functional genomic framework for the analysis of craniofacial birth defects. We showed that deletion of craniofacial enhancers results in significant, but non-pathological changes in morphology. Even for Δhs1431, the enhancer deletion resulting in the most severe reduction in craniofacial gene expression, the morphological phenotype was overall much less severe than the pathological changes observed upon deletion of the Snai2 gene itself (61). This milder phenotype is not surprising, considering that remaining baseline activity of the gene was observed in all craniofacial structures examined (fig. 6A and fig. S4C). These observations highlight the potential of enhancers to modulate craniofacial morphology in quantitatively subtle ways, without the pathological consequences potentially associated with deleterious protein-coding mutations. These results raise the possibility that sequence or copy number variation affecting more than one enhancer of the same gene may cumulatively result in more severe and potentially pathological phenotypes. Isolated examples of sequence variants in distant-acting enhancers associated with malformations such as clefts of the lip or palate have been described (e.g., (56)) and there is circumstantial evidence that non-coding sequences, including enhancers, play a significant role in these processes (e.g., (35)). There is partial overlap between loci involved in normal facial shape variation and in craniofacial birth defects, supporting the possibility that some dysmorphologies represent the extreme ends of the normal spectrum of variation (15, 16). The improved genome-wide functional annotation of craniofacial in vivo enhancers obtained through this study is expected to aid not only in the functional exploration of isolated studies of craniofacial dysmorphologies, but may also facilitate an understanding of the links between normal and pathological variation in craniofacial shape.
Supplementary Material
Acknowledgements
The authors thank Jan Harkes and Mahadev Satyanarayanan for development of the OPT viewer, Shiyi Shen and Harry Hochheiser for integration of the OPT viewer and data sets into FaceBase, Jeff Murray, Mary Marazita, John Manak, Brian Schutte and all FaceBase members for help in the selection of relevant craniofacial intervals and comments on results. A.V. and L.A.P. were supported by NIDCR FaceBase grant U01DE020060 and by NHGRI grants R01HG003988, and U54HG006997. C.A. was supported by a SNSF advanced researcher fellowship. A.S.N. was supported by a F32 NIH/NIGMS NRSA fellowship GM105202. B.H. was supported by NIH R01DE021708, NIH 1U01DE020054 and NSERC #238992-12 grants. D.R.F. and H.M. were supported by a UK Medical Research Council (MRC) core program grant. B.R. was supported by the Ludwig Institute for Cancer Research and NIH grants U54HG006997 and R01HG003991. Research was conducted at the E.O. Lawrence Berkeley National Laboratory and performed under Department of Energy Contract DE-AC02-05CH11231, University of California. ChIP-seq data is available through GEO (accession number GSE49413) and FaceBase.org. In vivo reporter data is available through the Vista Enhancer Browser (http://enhancer.lbl.gov) and FaceBase.org. OPT data, including raw images and interactive three-dimensional viewing option is available through FaceBase.org. All enhancer reporter vectors, as well as archived surplus LacZ-stained embryos for selected enhancers, are available from the authors. Craniofacial enhancer knockout lines are available through the Mutant Mouse Regional Resource Centers (Δhs1431, MMRRC 03895, Δhs746 MMRRC 03888, Δhs586 MMRRCC 03894).
Footnotes
Supplementary Materials:
Material and methods
Supplementary online text
Figs. S1–S6
Tables S1–S6
Movies S1–S20
References (62–91)
References and Notes
- 1.Christensen K, Juel K, Herskind AM, Murray JC. Bmj. 2004 Jun 12;328:1405. doi: 10.1136/bmj.38106.559120.7C. [DOI] [PMC free article] [PubMed] [Google Scholar]
- 2.Wehby GL, Cassell CH. Oral Dis. 2010 Jan;16:3. doi: 10.1111/j.1601-0825.2009.01588.x. [DOI] [PMC free article] [PubMed] [Google Scholar]
- 3.Kayser M, Schneider PM. Forensic Sci Int Genet. 2009 Jun;3:154. doi: 10.1016/j.fsigen.2009.01.012. [DOI] [PubMed] [Google Scholar]
- 4.Kohn LAP. Annu. Rev. Anthropol. 1991;20:261. doi: 10.1146/annurev.an.20.100191.001523. [DOI] [PubMed] [Google Scholar]
- 5.Manfredi C, Martina R, Grossi GB, Giuliani M. Am J Orthod Dentofacial Orthop. 1997 Jan;111:44. doi: 10.1016/s0889-5406(97)70301-9. [DOI] [PubMed] [Google Scholar]
- 6.Johannsdottir B, Thorarinsson F, Thordarson A, Magnusson TE. Am J Orthod Dentofacial Orthop. 2005 Feb;127:200. doi: 10.1016/j.ajodo.2004.07.033. [DOI] [PubMed] [Google Scholar]
- 7.Satokata I, Maas R. Nat Genet. 1994 Apr;6:348. doi: 10.1038/ng0494-348. [DOI] [PubMed] [Google Scholar]
- 8.van den Boogaard MJ, Dorland M, Beemer FA, van Amstel HK. Nat Genet. 2000 Apr;24:342. doi: 10.1038/74155. [DOI] [PubMed] [Google Scholar]
- 9.Kondo S, et al. Nat Genet. 2002 Oct;32:285. doi: 10.1038/ng985. [DOI] [PMC free article] [PubMed] [Google Scholar]
- 10.Suzuki S, et al. Am J Hum Genet. 2009 Mar;84:406. doi: 10.1016/j.ajhg.2009.02.002. [DOI] [PMC free article] [PubMed] [Google Scholar]
- 11.Dixon MJ. Hum Mol Genet. 1996;5 Spec No:1391. doi: 10.1093/hmg/5.supplement_1.1391. [DOI] [PubMed] [Google Scholar]
- 12.Ng SB, et al. Nat Genet. 2010 Sep;42:790. doi: 10.1038/ng.646. [DOI] [PMC free article] [PubMed] [Google Scholar]
- 13.Ng SB, et al. Nat Genet. 2009 Jan;42:30. [Google Scholar]
- 14.Dixon MJ, Marazita ML, Beaty TH, Murray JC. Nat Rev Genet. 2011 Mar;12:167. doi: 10.1038/nrg2933. [DOI] [PMC free article] [PubMed] [Google Scholar]
- 15.Boehringer S, et al. Eur J Hum Genet. 2011 Nov;19:1192. doi: 10.1038/ejhg.2011.110. [DOI] [PMC free article] [PubMed] [Google Scholar]
- 16.Liu F, et al. PLoS Genet. 2012 Sep;8:e1002932. doi: 10.1371/journal.pgen.1002932. [DOI] [PMC free article] [PubMed] [Google Scholar]
- 17.Paternoster L, et al. Am J Hum Genet. 2012 Mar 9;90:478. doi: 10.1016/j.ajhg.2011.12.021. [DOI] [PMC free article] [PubMed] [Google Scholar]
- 18.Stern DL. Evolution. 2000 Aug;54:1079. doi: 10.1111/j.0014-3820.2000.tb00544.x. [DOI] [PubMed] [Google Scholar]
- 19.Shen Y, et al. Nature. 2012 Aug 2;488:116. [Google Scholar]
- 20.Zhu J, et al. Cell. 2013 Jan 31;152:642. [Google Scholar]
- 21.Visel A, et al. Nature. 2009 Feb 12;457:854. doi: 10.1038/nature07730. [DOI] [PMC free article] [PubMed] [Google Scholar]
- 22.Young NM, Chong HJ, Hu D, Hallgrimsson B, Marcucio RS. Development. 2010 Oct;137:3405. doi: 10.1242/dev.052340. [DOI] [PMC free article] [PubMed] [Google Scholar]
- 23.Simoes-Costa M, Bronner ME. Genome Res. 2013 Jul;23:1069. doi: 10.1101/gr.157586.113. [DOI] [PMC free article] [PubMed] [Google Scholar]
- 24.Bagheri-Fam S, et al. Dev Biol. 2006 Mar 15;291:382. doi: 10.1016/j.ydbio.2005.11.013. [DOI] [PubMed] [Google Scholar]
- 25.Betancur P, Bronner-Fraser M, Sauka-Spengler T. Proc Natl Acad Sci U S A. 2010 Feb 23;107:3570. doi: 10.1073/pnas.0906596107. [DOI] [PMC free article] [PubMed] [Google Scholar]
- 26.Simoes-Costa MS, McKeown SJ, Tan-Cabugao J, Sauka-Spengler T, Bronner ME. PLoS Genet. 2012;8:e1003142. doi: 10.1371/journal.pgen.1003142. [DOI] [PMC free article] [PubMed] [Google Scholar]
- 27.Rada-Iglesias A, et al. Cell Stem Cell. 2012 Nov 2;11:633. doi: 10.1016/j.stem.2012.07.006. [DOI] [PMC free article] [PubMed] [Google Scholar]
- 28.Kaufman MH. London: Academic Press; 1992. [Google Scholar]
- 29.Feng W, et al. PLoS One. 2009;4:e8066. doi: 10.1371/journal.pone.0008066. [DOI] [PMC free article] [PubMed] [Google Scholar]
- 30.Materials and methods are available as supplementary material on Science Online.
- 31.Blow MJ, et al. Nat Genet. 2010 Sep;42:806. doi: 10.1038/ng.650. [DOI] [PMC free article] [PubMed] [Google Scholar]
- 32.Visel A, et al. Cell. 2013 Feb 14;152:895. [Google Scholar]
- 33.McLean CY, et al. Nat Biotechnol. 2010 May;28:495. doi: 10.1038/nbt.1630. [DOI] [PMC free article] [PubMed] [Google Scholar]
- 34.Mangold E, Ludwig KU, Nothen MM. Trends Mol Med. 2011 Dec;17:725. doi: 10.1016/j.molmed.2011.07.007. [DOI] [PubMed] [Google Scholar]
- 35.Birnbaum S, et al. Nat Genet. 2009 Apr;41:473. doi: 10.1038/ng.333. [DOI] [PubMed] [Google Scholar]
- 36.Beaty TH, et al. Nat Genet. 2010 Jun;42:525. doi: 10.1038/ng.580. [DOI] [PMC free article] [PubMed] [Google Scholar]
- 37.Balczerski B, et al. Dev Biol. 2012 Nov 15;371:203. doi: 10.1016/j.ydbio.2012.08.011. [DOI] [PMC free article] [PubMed] [Google Scholar]
- 38.Vaahtokari A, Aberg T, Jernvall J, Keranen S, Thesleff I. Mech Dev. 1996 Jan;54:39. doi: 10.1016/0925-4773(95)00459-9. [DOI] [PubMed] [Google Scholar]
- 39.Koyama E, et al. Dev Dyn. 1996 May;206:59. doi: 10.1002/(SICI)1097-0177(199605)206:1<59::AID-AJA6>3.0.CO;2-#. [DOI] [PubMed] [Google Scholar]
- 40.Tucker AS, et al. Development. 1999 Jan;126:221. doi: 10.1242/dev.126.2.221. [DOI] [PubMed] [Google Scholar]
- 41.Pennacchio LA, et al. Nature. 2006 Nov 23;444:499. doi: 10.1038/nature05295. [DOI] [PubMed] [Google Scholar]
- 42.Sharpe J, et al. Science. 2002 Apr 19;296:541. doi: 10.1126/science.1068206. [DOI] [PubMed] [Google Scholar]
- 43.Heintzman ND, et al. Nature. 2009 May 7;459:108. [Google Scholar]
- 44.Holland LZ, et al. Genome Res. 2008 Jul;18:1100. doi: 10.1101/gr.073676.107. [DOI] [PMC free article] [PubMed] [Google Scholar]
- 45.May D, et al. Nat Genet. 2011 Jan;44:89. doi: 10.1038/ng.1006. [DOI] [PMC free article] [PubMed] [Google Scholar]
- 46.Visel A, et al. Nat Genet. 2008 Feb;40:158. doi: 10.1038/ng.2007.55. [DOI] [PMC free article] [PubMed] [Google Scholar]
- 47.Hochheiser H, et al. Dev Biol. 2011 Jul 15;355:175. doi: 10.1016/j.ydbio.2011.02.033. [DOI] [PMC free article] [PubMed] [Google Scholar]
- 48.Alappat S, Zhang ZY, Chen YP. Cell Res. 2003 Dec;13:429. doi: 10.1038/sj.cr.7290185. [DOI] [PubMed] [Google Scholar]
- 49.Visel A, Rubin EM, Pennacchio LA. Nature. 2009 Sep 10;461:199. doi: 10.1038/nature08451. [DOI] [PMC free article] [PubMed] [Google Scholar]
- 50.MacKenzie A, Purdie L, Davidson D, Collinson M, Hill RE. Mech Dev. 1997 Feb;62:29. doi: 10.1016/s0925-4773(96)00646-6. [DOI] [PubMed] [Google Scholar]
- 51.Yokoyama S, et al. Dev Cell. 2009 Dec;17:836. doi: 10.1016/j.devcel.2009.10.011. [DOI] [PMC free article] [PubMed] [Google Scholar]
- 52.Mangold E, et al. Am J Med Genet A. 2009 Dec;149A:2680. doi: 10.1002/ajmg.a.33136. [DOI] [PubMed] [Google Scholar]
- 53.Nikopensius T, et al. Am J Med Genet A. 2009 Nov;149A:2551. doi: 10.1002/ajmg.a.33024. [DOI] [PubMed] [Google Scholar]
- 54.Yuan Q, Blanton SH, Hecht JT. Am J Med Genet A. 2011 Jun;155A:1469. doi: 10.1002/ajmg.a.33940. [DOI] [PMC free article] [PubMed] [Google Scholar]
- 55.Leslie EJ, et al. Birth Defects Res A Clin Mol Teratol. 2012 Nov;94:934. doi: 10.1002/bdra.23076. [DOI] [PMC free article] [PubMed] [Google Scholar]
- 56.Rahimov F, et al. Nat Genet. 2008 Nov;40:1341. doi: 10.1038/ng.242. [DOI] [PMC free article] [PubMed] [Google Scholar]
- 57.Oram KF, Carver EA, Gridley T. Anat Rec A Discov Mol Cell Evol Biol. 2003 Mar;271:189. doi: 10.1002/ar.a.10027. [DOI] [PubMed] [Google Scholar]
- 58.Mitsiadis TA, Angeli I, James C, Lendahl U, Sharpe PT. Development. 2003 Sep;130:4451. doi: 10.1242/dev.00631. [DOI] [PubMed] [Google Scholar]
- 59.Lieberman DE, Hallgrimsson B, Liu W, Parsons TE, Jamniczky HA. J Anat. 2008 Jun;212:720. doi: 10.1111/j.1469-7580.2008.00900.x. [DOI] [PMC free article] [PubMed] [Google Scholar]
- 60.Hallgrimsson B, Lieberman DE, Liu W, Ford-Hutchinson AF, Jirik FR. Evol Dev. 2007 Jan-Feb;9:76. doi: 10.1111/j.1525-142X.2006.00139.x. [DOI] [PubMed] [Google Scholar]
- 61.Murray SA, Oram KF, Gridley T. Development. 2007 May;134:1789. doi: 10.1242/dev.02837. [DOI] [PubMed] [Google Scholar]
- 62.Li H, Durbin R. Bioinformatics. 2009 Jul 15;25:1754. doi: 10.1093/bioinformatics/btp324. [DOI] [PMC free article] [PubMed] [Google Scholar]
- 63.Zhang Y, et al. Genome Biol. 2008;9:R137. doi: 10.1186/gb-2008-9-9-r137. [DOI] [PMC free article] [PubMed] [Google Scholar]
- 64.Feng J, Liu T, Zhang Y. Chapter 2. Curr Protoc Bioinformatics. 2011 Jun;Unit 2:14. doi: 10.1002/0471250953.bi0214s34. [DOI] [PMC free article] [PubMed] [Google Scholar]
- 65.Siepel A, et al. Genome Res. 2005 Aug;15:1034. doi: 10.1101/gr.3715005. [DOI] [PMC free article] [PubMed] [Google Scholar]
- 66.Kothary R, et al. Nature. 1988 Sep 29;335:435. doi: 10.1038/335435a0. [DOI] [PubMed] [Google Scholar]
- 67.Ahituv N, et al. PLoS Biol. 2007 Sep;5:e234. doi: 10.1371/journal.pbio.0050234. [DOI] [PMC free article] [PubMed] [Google Scholar]
- 68.Livak KJ, Schmittgen TD. Methods. 2001 Dec;25:402. doi: 10.1006/meth.2001.1262. [DOI] [PubMed] [Google Scholar]
- 69.Martinez-Abadias N, et al. Evol Biol. 2012 Dec;39:554. doi: 10.1007/s11692-012-9210-7. [DOI] [PMC free article] [PubMed] [Google Scholar]
- 70.Hallgrimsson B, et al. Evol Biol. 2009 Dec;36:355. doi: 10.1007/s11692-009-9076-5. [DOI] [PMC free article] [PubMed] [Google Scholar]
- 71.Klingenberg CP. Mol Ecol Resour. 2011 Mar;11:353. doi: 10.1111/j.1755-0998.2010.02924.x. [DOI] [PubMed] [Google Scholar]
- 72.Aybar MJ, Nieto MA, Mayor R. Development. 2003 Feb;130:483. doi: 10.1242/dev.00238. [DOI] [PubMed] [Google Scholar]
- 73.Nieto MA. Mech Dev. 2001 Jul;105:27. doi: 10.1016/s0925-4773(01)00394-x. [DOI] [PubMed] [Google Scholar]
- 74.Jiang R, Lan Y, Norton CR, Sundberg JP, Gridley T. Dev Biol. 1998 Jun 15;198:277. [PubMed] [Google Scholar]
- 75.Cobaleda C, Perez-Caro M, Vicente-Duenas C, Sanchez-Garcia I. Annu Rev Genet. 2007;41:41. doi: 10.1146/annurev.genet.41.110306.130146. [DOI] [PubMed] [Google Scholar]
- 76.Sanchez-Martin M, et al. Hum Mol Genet. 2002 Dec 1;11:3231. doi: 10.1093/hmg/11.25.3231. [DOI] [PubMed] [Google Scholar]
- 77.Hill RE, et al. Genes Dev. 1989 Jan;3:26. doi: 10.1101/gad.3.1.26. [DOI] [PubMed] [Google Scholar]
- 78.Robert B, Sassoon D, Jacq B, Gehring W, Buckingham M. Embo J. 1989 Jan;8:91. doi: 10.1002/j.1460-2075.1989.tb03352.x. [DOI] [PMC free article] [PubMed] [Google Scholar]
- 79.Catron KM, et al. Mol Cell Biol. 1995 Feb;15:861. doi: 10.1128/mcb.15.2.861. [DOI] [PMC free article] [PubMed] [Google Scholar]
- 80.Blin-Wakkach C, et al. Proc Natl Acad Sci U S A. 2001 Jun 19;98:7336. doi: 10.1073/pnas.131497098. [DOI] [PMC free article] [PubMed] [Google Scholar]
- 81.Mackenzie A, Leeming GL, Jowett AK, Ferguson MW, Sharpe PT. Development. 1991 Feb;111:269. doi: 10.1242/dev.111.2.269. [DOI] [PubMed] [Google Scholar]
- 82.Houzelstein D, Cohen A, Buckingham ME, Robert B. Mech Dev. 1997 Jul;65:123. doi: 10.1016/s0925-4773(97)00065-8. [DOI] [PubMed] [Google Scholar]
- 83.Vastardis H, Karimbux N, Guthua SW, Seidman JG, Seidman CE. Nat Genet. 1996 Aug;13:417. doi: 10.1038/ng0896-417. [DOI] [PubMed] [Google Scholar]
- 84.Jumlongras D, et al. Am J Hum Genet. 2001 Jul;69:67. doi: 10.1086/321271. [DOI] [PMC free article] [PubMed] [Google Scholar]
- 85.Jezewski PA, et al. J Med Genet. 2003 Jun;40:399. doi: 10.1136/jmg.40.6.399. [DOI] [PMC free article] [PubMed] [Google Scholar]
- 86.Tsuchida T, et al. Cell. 1994 Dec 16;79:957. doi: 10.1016/0092-8674(94)90027-2. [DOI] [PubMed] [Google Scholar]
- 87.Laugwitz KL, et al. Nature. 2005 Feb 10;433:647. doi: 10.1038/nature03215. [DOI] [PMC free article] [PubMed] [Google Scholar]
- 88.Ahlgren U, Pfaff SL, Jessell TM, Edlund T, Edlund H. Nature. 1997 Jan 16;385:257. doi: 10.1038/385257a0. [DOI] [PubMed] [Google Scholar]
- 89.Sheng HZ, et al. Science. 1997 Dec 5;278:1809. doi: 10.1126/science.278.5344.1809. [DOI] [PubMed] [Google Scholar]
- 90.Pfaff SL, Mendelsohn M, Stewart CL, Edlund T, Jessell TM. Cell. 1996 Jan 26;84:309. doi: 10.1016/s0092-8674(00)80985-x. [DOI] [PubMed] [Google Scholar]
- 91.Hindorff LA, et al. Proc Natl Acad Sci U S A. 2009 Jun 9;106:9362. doi: 10.1073/pnas.0903103106. [DOI] [PMC free article] [PubMed] [Google Scholar]
Associated Data
This section collects any data citations, data availability statements, or supplementary materials included in this article.


