Abstract
Background
Heart failure survival models are typically constructed using Cox-proportional hazards regression. Regression modeling suffers from a number of limitations, including bias introduced by commonly used variable selection methods. We illustrate the value of an intuitive, robust approach to variable selection, random survival forests (RSF), in a large clinical cohort. RSF is a potentially powerful extension of Classification and Regression Trees (CART), with lower variance and bias.
Methods and Results
We studied 2231 adult systolic heart failure patients who underwent cardiopulmonary stress testing. During a mean follow-up of 5 years, 742 patients died. Thirty-nine demographic, cardiac and noncardiac co-morbidity, and stress testing variables were analyzed as potential predictors of all-cause mortality. A RSF of 2000 trees was constructed, with each tree constructed on a bootstrap sample from the original cohort. The most predictive variables were defined as those near the tree trunks (averaged over the forest). The RSF identified peak VO2, serum BUN, and treadmill exercise time as the three most important predictors of survival. The RSF predicted survival similarly to a conventional Cox-proportional hazards model (out-of-bag C-index of 0.705 for RSF vs 0.698 for Cox-proportional hazards model).
Conclusions
A random survival forests model in a cohort of heart failure patients performed as well as a traditional Cox-proportional hazard model, and may serve as a more intuitive approach for clinicians to identify important risk factors for all-cause mortality.
Keywords: Heart failure, prognosis, statistical modeling, survival analyses
Most heart failure survival models are based on multivariable Cox proportional hazard regression1–6. To prevent overfitting and achieve parsimony, analysts often identify statistically significant variables by methods such as stepwise regression or χ2 statistical score ranking1, 3, 7, 8. These methods yield variable results and have been criticized for creating bias9. In addition, from the point of view of clinicians, regression modeling and variable selection appear to occur within a computer’s “black box.”
Statistical methods like classification and regression trees (CART) may be intuitive for clinicians since they illustrate the importance and relationship of variables with a single young tree that has few branches10. However, CART suffers from high variance and poor performance11–13 which leads to instability. Random survival forests (RSF) is a new statistical method that grows numerous mature trees with many branches.14 RSF reduces variance and bias by using all variables collected and by automatically assessing for nonlinear effects and complex interactions. It is a direct extension of the random forest which has been successfully used in clinical studies15–18 and in some cases shown to outperform classical statistical methods18, 19
We use random survival forests to illustrate an intuitive and powerful approach for identifying important risk factors for survival in 2231 systolic heart failure patients who underwent cardiopulmonary stress testing at the Cleveland Clinic. Variables with relatively high importance are near the tree trunks20. We also compare the results of random survival forest to our previously published Cox proportional hazard model for predictive accuracy of the model and for selection of important risk factors for all-cause mortality21.
Methods
Data Source
The design of this observational prospective study has been previously published21. The cohort consisted of all adult patients at the Cleveland Clinic with left ventricular ejection fraction < 40% who underwent cardiopulmonary stress testing between August 1997 to April 2007 using a modified Naughton protocol, the most common protocol used in our laboratory for heart transplant evaluation. Patients were excluded if they were under 18 years of age or had no United States Social Security number. Left ventricular ejection fraction was assessed by echocardiogram, left ventriculography, or ECG-gated SPECT imaging. If more than one stress test was performed on an individual, only the first stress test was used in this analysis. Demographic information, height and weight directly measured, medications, and stress test results were entered into our electronic database at the time of stress testing.
The results of exercise stress testing were recorded on a MedGraphic cardiopulmonary system (St. Paul, Minnessota). Heart rate, blood pressure, respiratory rate, oxygen consumption (VO2), carbon dioxide production, minute ventilation, and tidal volume were obtained every 30 seconds at rest, during exercise, and during recovery. Exercise stress testing was symptom limited and total duration of exercise was measured to the nearest second. Serum laboratory tests within 3 months were included and only the tests closest in time to the stress test were considered. As we discussed previously21, laboratory tests prior to October 1999 were systematically missing from our electronic database; therefore, we used informed imputation to fill in 10% of serum glucose, BUN, creatinine, and sodium and 15% of hemoglobin values. No other data were missing either systematically or at random, precluding any need for multiple imputation.22 Glomerular Filtration Rate (GFR) was estimated using the Cockcroft-Gault equation23. The study was approved by the Institutional Review Board at the Cleveland Clinic, and informed consent was waived because all data were collected and recorded as part of routine clinical care.
Study Variables
The following variables were assessed for prognostic value: sex, age, body mass index (kg/m2), current tobacco usage, insulin treated diabetes, non-insulin treated diabetes, coronary artery disease, previous myocardial infarction, previous coronary artery bypass graft surgery, previous percutaneous coronary intervention, implantable cardioverter-defibrillator, pacemaker, β-blocker, ace inhibitor, angiotensin receptor blocker, potassium sparing diuretics, antiarrythmics, anticoagulation, aspirin, digoxin, nitrates, vasodilators, loop diuretics, thiazide diuretics, statins, non-dihydropyridine calcium channel blocker, dihydropyridine calcium channel blocker, resting heart rate (beats/min), resting systolic blood pressure (mmHg), left ventricular ejection fraction, peak oxygen consumption (mL• kg−1• min−1) peak respiratory exchange ratio, treadmill exercise time, serum sodium (mmol/L), creatinine clearance (mL/min), serum BUN (mg/dL), serum hemoglobin (g/dL), and serum glucose (mg/dL).
Endpoints
The primary endpoint was all cause death. Mortality data were obtained by linking our database with the United States Social Security Administration Death Index which we previously reported to have a sensitivity of 97 %24.
Statistical Analysis
Sex-specific baseline characteristics were reported with continuous variables expressed as means with SDs, and categorical variables expressed as frequencies.
Random survival analysis was employed using all-cause mortality for the outcome24. Thirty-nine variables in 2231 patients were used for the analysis. A survival forest of 2000 survival trees was constructed.
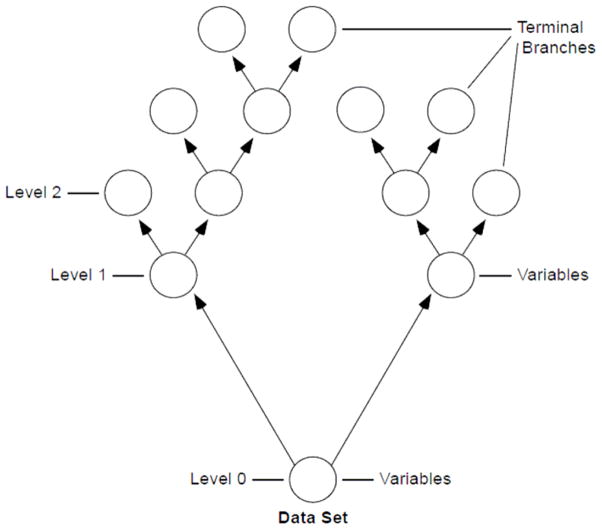
Figure 1 demonstrates how we build a single random tree. We start by choosing a bootstrap sample of patients from the original cohort. At each branch, a random set of variables are chosen as candidates to split the branch into two other branches, and the variable maximizing the log-rank statistic25 using 3 randomly selected split points was used for splitting. The number of variables assessed at each branch was the square root of the total number of variables. Branch levels are numbered based on their relative distance from the tree trunk (i.e. 0, 1, 2) Splitting of branches to create the tree continues as long as possible until terminal branches have no fewer than 3 deaths.
Figure 1.
Example of a random tree. A bootstrap sample of patients from the original data set is used to create a random tree. At the tree top (or root node), a random set of variables are chosen to be candidates and the most predictive variable for survival among those is identified. Node levels are numbered based on their relative distance to the top of the tree (i.e. 0, 1, 2) Splitting of nodes to create the tree continues until terminal nodes have few distinct deaths.
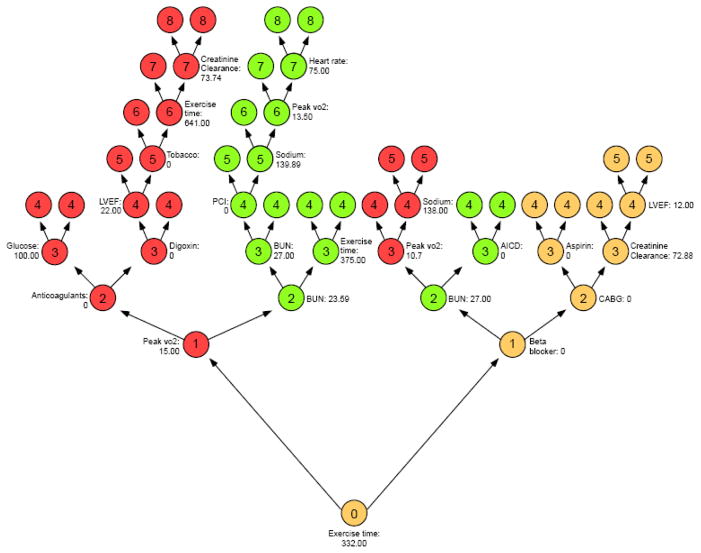
A random survival forest is generated by creating 2000 trees. The most important variables are identified as those that most frequently split the branches near the tree trunks. There are no pre-specified assumptions regarding variables and randomization is introduced into this model by both random bootstrap sampling of patients from the original cohort and random sampling of variables for each tree branch. Importance of a variable is assessed by minimal depth from the tree trunk14. To illustrate this concept, we show in Figure 2 a random tree with color coding of “maximal subtrees.” A maximal subtree for a variable v is the largest subtree whose lowest branch is split using v. The shortest distance from the tree trunk to the branch level of the closest maximal subtree of v is the minimal depth of v. For example in Figure 2, exercise time splits the tree trunk and has a minimal depth of zero, while BUN are the two green subtrees with a minimal depth of 2. The most predictive variables for the cohort are defined as those whose minimal depth (averaged over the forest) is smaller than the mean minimal depth determined under the null hypothesis of no effect20
Figure 2.
Illustration of minimal depth of a variable in a random tree from our 2000-tree forest. Highlighted are the three top variables: peak VO2 (red), BUN (green) and exercise time (yellow). Depth of a node is indicated by numbers 0,1, 2, 3–8. The minimal depths are 0,1, 2 for exercise time, peak VO2, and BUN respectively.
Prediction accuracy for random survival forests was assessed by Harrell’s C-index using out-of-bag (OOB) data. The out-of-bag (OOB) method involves obtaining bootstrap samples from the original cohort and using each sample to compute a prediction model. Each bootstrap sample left out about one-third of the data, which was referred to as the OOB data. The C-index was calculated using an OOB ensemble constructed with the 2000 OOB datasets produced by the 2000 bootstrap samples used in deriving the forest. A nonparsimonious Cox proportional hazards model was constructed as previously described21 and compared to the random survival forest model for predictive accuracy of the model and for selection of important risk factors for all-cause mortality. Briefly, the proportional hazards assumption was tested by scaled Schoenfeld residuals and inspection of hazard ratio plots. Possible nonlinear associations for the Cox proportional hazards model were tested with restricted cubic splines and possible interactions were also tested. Prediction accuracy for Cox proportional hazards model was assessed by Harrell’s C-index using out-of-bag (OOB) data.21
All analyses were performed with SAS version 9.1.3 (SAS Institute Inc, Cary, NC) and R version 2.6.2 (www.R-project.org). Random survival forests were implemented using the “RandomSurvivalForest” R-package, freely available through the CRAN distribution system at http://cran.r-project.org/web/packages/randomSurvivalForest/index.html.
This work was supported in part by the Health Resources and Services Administration contract 234-2005-370011C, by American Heart Association Scientist Development Grant 0730307N, and by the National Heart, Lung, and Blood InstituteCAN #8324207 and contract HHSN268200800026C. The content is the responsibility of the authors alone and does not necessarily reflect the views or policies of the AHA or NHLBI or Department of Health and Human Services, nor does mention of trade names, commercial products, or organizations imply endorsement by the U.S. Government.
Results
Our cohort consisted of 2231 patients including 602 (27%) women and 1629 (73%) men. There were 155 women (26% of female cohort) and 587 (36% of male cohort) men who died during a mean follow up of 5 years (maximum for survivors, 11 years).
Table 1 shows the baseline characteristics of the cohort according to sex. Our patients had advanced disease with low systolic blood pressure, low peak VO2, and low left ventricular ejection fraction. Most patients received angiotensin converting enzyme inhibitors or angiotensin receptor blockers, and over 60% received beta-blockers.
Table I.
Sex-Specific Baseline Characteristics
| Variables | All (N=2231) | Females (N=602) | Males (N=1629) |
|---|---|---|---|
| Age, (yrs) | 54 +/− 11 | 52 +/− 11 | 55 +/− 11 |
| Body mass index, (kg/m2) | 28 +/− 6 | 28 +/− 6 | 29 +/− 5 |
| Current smokers, n (%) | 459 (21) | 117 (19) | 342 (21) |
| Diabetes:insulin treated, n (%) | 215 (10) | 53 (9) | 162 (10) |
| Diabetes: not insulin treated, n (%) | 350 (16) | 92 (15) | 258 (16) |
| Coronary artery disease, n (%) | 906 (41) | 127 (21) | 779 (48) |
| Previous MI, n (%) | 279 (13) | 43 (7) | 236 (14) |
| Previous CABG, n (%) | 594 (27) | 64 (11) | 530 (33) |
| Previous PCI, n (%) | 476 (21) | 75 (12) | 401 (25) |
| Implantable cardioverter-defibrillator, n (%) | 647 (29) | 147 (24) | 500 (31) |
| Pacemaker, n (%) | 502 (23) | 113 (19) | 389 (24) |
| Medication use, n (%) | |||
| β-Blocker | 1429 (64) | 387 (64) | 1042 (64) |
| ACE inhibitor | 1711 (77) | 431 (72) | 1280 (79) |
| Angiotensin receptor blocker | 290 (13) | 99 (16) | 191 (12) |
| Potassium sparing diuretics | 649 (29) | 203 (34) | 446 (27) |
| Antiarrythmic | 509 (23) | 90 (15) | 419 (26) |
| Anticoagulation | 899 (40) | 210 (35) | 689 (42) |
| Aspirin | 1038 (47) | 230 (38) | 808 (50) |
| Digoxin | 1570 (70) | 424 (70) | 1146 (70) |
| Nitrates | 739 (33) | 153 (25) | 586 (36) |
| Vasodilators | 136 (6) | 27 (4) | 109 (7) |
| Loop diuretics | 1880 (84) | 498 (83) | 1382 (85) |
| Thiazide diuretics | 279 (13) | 77 (13) | 202 (12) |
| Statin | 850 (38) | 172 (29) | 678 (42) |
| Calcium channel blocker: not dihydropyridine | 16 (1) | 4 (1) | 12 (1) |
| Calcium channel blocker: dihydropyridine | 99 (4) | 15 (2) | 84 (5) |
| Resting heart rate, (beats/min) | 76 +/− 14 | 78 +/− 14 | 76 +/− 14 |
| Resting systolic blood pressure, (mm Hg) | 111 +/− 18 | 110 +/− 18 | 111 +/− 18 |
| Left ventricular ejection fraction, (%) | 20 +/− 7 | 21 +/− 7 | 20 +/− 7 |
| Peak oxygen consumption, (ml/kg/min) | 16 +/− 5 | 16 +/− 4 | 17 +/− 5 |
| Peak respiratory exchange ratio | 1.08 +/− 0.12 | 1.05 +/− 0.13 | 1.09 +/− 0.11 |
| Treadmill exercise time (sec) | 503 +/− 221 | 476 +/− 204 | 513 +/− 226 |
| Serum sodium (mmol/L) | 139 +/− 3 | 140+/− 3 | 139 +/− 3 |
| Creatinine clearance (mg/min) | 91+/− 43 | 85 +/− 44 | 93+/− 43 |
| Serum BUN (mg/dL) | 25 +/− 13 | 23 +/− 12 | 26+/− 13 |
| Serum hemoglobin (g/dL) | 14 +/− 1 | 13 +/− 1 | 14 +/− 1 |
| Serum glucose (mg/dL) | 109 +/− 43 | 105+/− 40 | 111 +/− 43 |
Treadmill Exercise Time =maximal interval for Phase 2 (seconds) +/− Std dev (seconds)
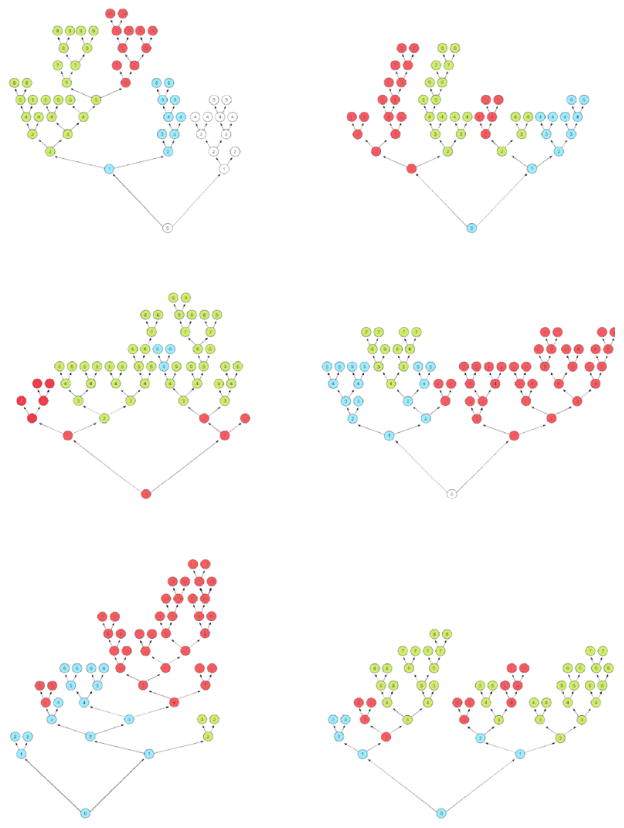
Figure 3 shows six randomly chosen trees from the 2000-tree forest. The three most important variables amongst these trees are color coded blue for treadmill exercise time, red for peak VO2, and green for serum BUN. These colors appear on almost every tree and are found near the tree trunks demonstrating their relative importance.
Figure 3.
Illustration of 6 random tree from our 2000-tree forest. The three most important variables amongst these trees are color coded blue for treadmill exercise time, red for peak VO2, and green for serum BUN.
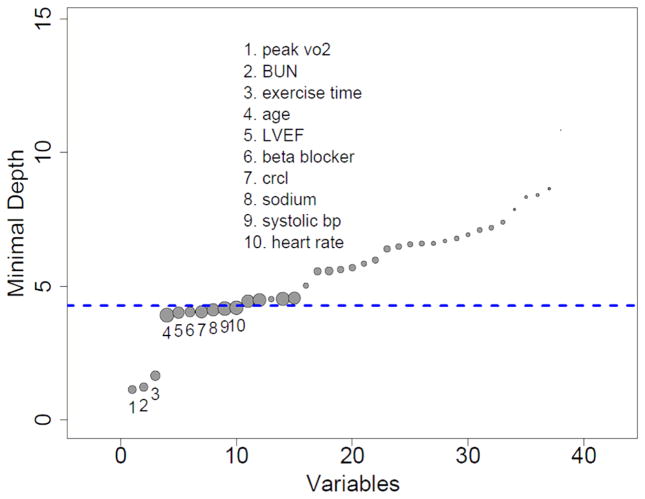
Figure 4 shows all 39 variables and plots their minimal depth. The thick dashed blue horizontal line separates the 10 predictive variables from the remaining non-predictive variables. The three variables on the extreme left are peak VO2, serum BUN and treadmill exercise time, and are easily seen to be the most predictive variables. These variables are similar to what was found in our previously published Cox-proportional hazard model analysis but in a different relative order (i.e. peak VO2, treadmill exercise time, and serum BUN) must reference
Figure 4.
Minimal depth (variable importance) from random survival forest analysis. Dashed blue line is threshold for filtering variables: all variables below the line are predictive. The diameter of each circle in the plot is proportional to the forest-averaged number of maximal subtrees for that variable.
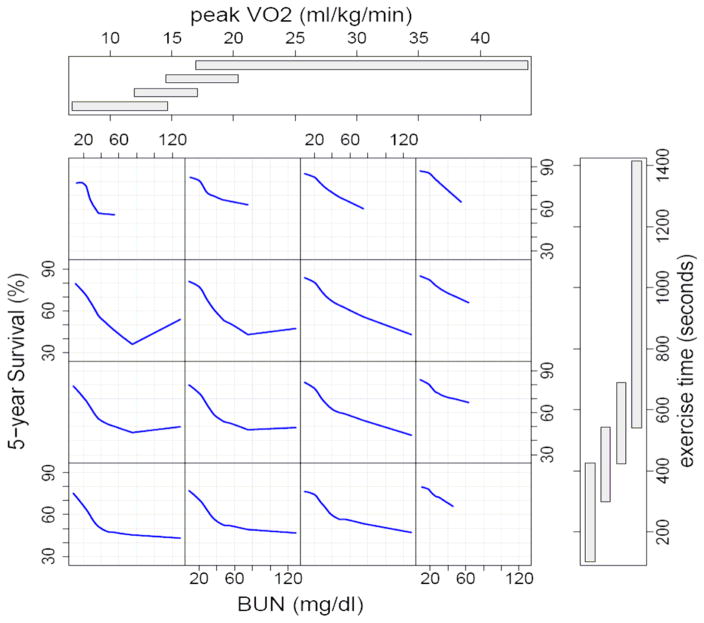
Figure 5 displays how the random survival forest model shows interaction between these three most important variables and 5 year predicted survival. Patients with the highest peak VO2 and longest treadmill exercise time have the best survival (see first row, last column) and most had low serum BUN. Survival was worst for patients with the lowest peak VO2 and shortest treadmill time(see last row, first column) and further dependent on small changes in serum BUN between 20–40 mg/dl. In this group 5 year predicted survival was about 70% for those with a BUN of 20 mg/dl, but only about 50% for those with BUN of 40 mg/dl. Survival did not change much for those with serum BUN > 40 mg/dl. Amongst those with the lowest peak VO2 (first column) survival was more dependenton serum BUN than on treadmill time. For those with shortest exercise time (last row) survival was also very dependent on serum BUN. It is important to note that these interactions and non-linear relationships were identified by the forest, and not prespecified by the analyst.
Figure 5.
Random survival forest estimated five-year survival as a function of BUN, exercise time, and peak VO2. Smoothed curves are loess curves of the estimated survival for each individual
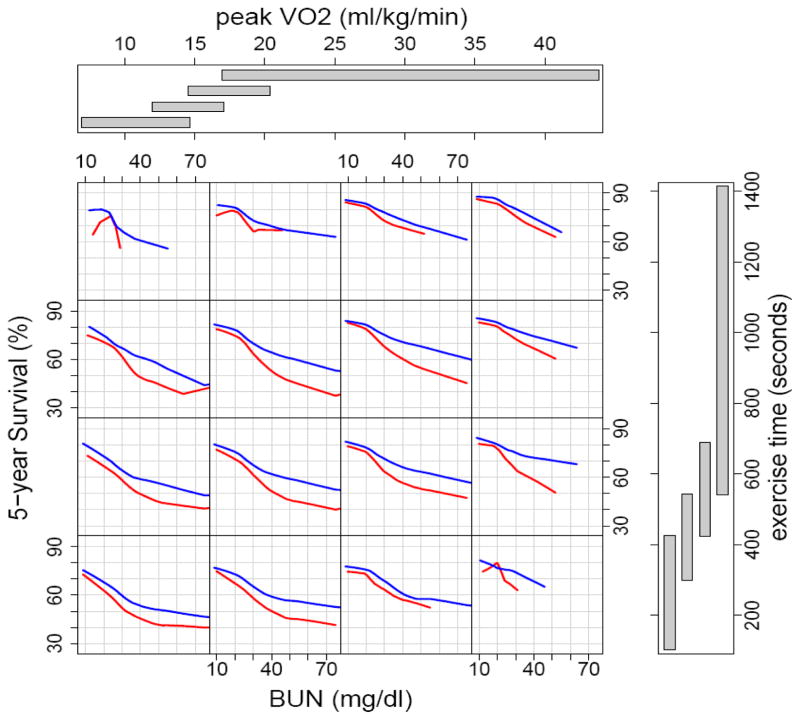
Figure 6 is similar to figure 5 but provides the added dimension of β-blockers. Five year predicted survival was worse for all groups not taking β-blockers at the time of the cardiopulmonary stress testing. The greatest differences in survival were among patients with a serum BUN > 40 mg/dl.
Figure 6.
Random survival forest estimated five-year survival as a function of BUN, exercise time, and peak VO2 for patients taking and not taking β-blockers at time of first cardiopulmonary stress test at the Cleveland Clinic. Blue curves identify those taking β-blockers and red curves identify those without β-blockers. Smoothed curves are loess curves of the estimated survival for each individual
We compared the random survival forest model to a Cox proportional hazard model. Model discrimination was similar using random survival forest analysis with an out-of-bag C-index of 0.705 compared to our previously published nonparsimonious Cox-proportional hazard model with a C-index of 0.69821. Using the 10 most important variables selected by random survival forest model to create another Cox-proportional hazard model, the C-index for this simplified Cox-proportional hazard model was comparable to the nonparsimonious Cox-proportional hazard model which included over 30 variables (C-index 0.699 vs 0.698).
Discussion
Random survival forest identified peak VO2, serum BUN, and treadmill exercise time as the top three most important predictors of survival in our cohort of 2231 ambulatory systolic heart failure patients who underwent cardiopulmonary stress testing at the Cleveland Clinic. These variables are similar to what was found in our previously published Cox-proportional hazard model analysis but in a different relative order21 The method used to determine the most important predictors for RSF is easy for clinicians to understand and visualize because important predictor variables are located at the tree trunks of the forest which can be color-coded for easy identification. In addition, RSF predicted survival as well as the conventional Cox-proportional hazard model (OOB C-index for random survival forest was 0.705 compared to C-index for a nonparsimonious Cox-proportional hazard model of 0.698). Variable selection by RSF was also used to create a simplified Cox-proportional hazard model that performed like a nonparsimonious Cox-proportional hazard model constructed with more than 3 times the number of variables21.
There are four advantages to using random survival forests. 1) RSF is an intuitive method because important variables to predict survival can be identified by inspecting the tree trunks and simplified in a figure plotting the minimal depth of a variable from the tree trunk. 2) RSF does not require analysts to know in advance the relationship (i.e. linear, nonlinear) of a variable over time or to choose the best equation to transform nonlinear covariates. 3) The complex interactions between multiple variables can be easily understood with RSF using figures such as figure 5 and 6. 4) Finally, the overall accuracy of a RSF model is at least comparable to standard methodologies14
RSF is a new, robust, extension of random forest, a well known and highly used machine learning method, and has been utilized successfully in several applied settings, including staging esophageal cancer26, 27 and genomics28. Machine learning involves use of computers to generate “automatic techniques for learning to make accurate predictions based on past observations.”29 All variables collected can be used for the survival analysis and the method for variable selection is intuitive and has been shown to outperform parametric methods as well as other state of the art machine learning methodologies20. RSF does not rely on “P” values and analysts do not need to select important variables in advance with methods like stepwise regression, inspect for residuals or include interactions. Several large studies (using simulations and real data) have now compared RSF to other methods, including Cox regression, and these have shown RSF to be consistently better than, or at least as good as, competing methods14, 18 Since the introduction of random forest to the machine learning community almost 10 years ago30, there have been efforts to document its empirical performance. Our results confirm what has generally been found: random forest produces accurate prediction14, 18. Ours study using a large cohort of consecutive heart failure patients with very few loss of follow-up showed that RSF was at least as good as Cox regression with respect to survival prediction. More studies are needed to compare RSF to Cox regression to further document its performance in clinical settings.
The major limitation of our study is that we have not validated either RSF or our Cox-proportional hazard model with an external cohort from another advanced heart failure center. Although random survival forest does effectively validate the model by creating trees with a random group of patients and variables, it is still deriving these trees from the original dataset and performance with an external cohort will need to be assessed. Other limitations include the fact that more variables could be included and that variables commonly accepted as predictors of survival like serum B-type natriuretic peptides were not routinely obtained at our center between 1997 and 2007. Biventricular pacemakers were also not reported separately during database entry but most were identified in the ICD category since at our institution biventricular pacemakers were almost always implanted with an ICD. We cannot account for variables that change with time that may impact on death, and we plan further work on developing capabilities to analyze time-dependent covariates.. However, the majority of the limitations described above with the exception of the need to externally validate are what limit our survival model from possibly being better than other survival models but do not prevent a fair comparison of random survival forest to a Cox-proportional hazard model.
In summary, we found in a large single center cohort of severe systolic heart failure patients that random survival forest identified similar risk factors to predictors all-cause mortality and that a RSF model performed as well as the traditional Cox-proportional hazard model. The Random survival forest method holds promise as an intuitive approach for variable selection and as a way to eliminate the mistrust in the “black box” approach to statistical analysis.
What is known
Classic regression models have serious limitations, including “black box” methods for determining which variables of most strongly predict outcome
The technique of “Random Survival Forests” is a robust, computer-based algorithm that yields unbiased assessments of variable importance
Random survival forests and related techniques have been primarily used in fields outside of clinical medicine
What this article adds
We have shown that random survival forests can be used to select the most important variables predictive of mortality in patients with severe heart failure.
Acknowledgments
Funding Sources: Supported by American Heart Association Scientist Development Grant 0730307N and National Heart, Lung, and Blood Institute CAN #8324207
Footnotes
Conflict of Interest Disclosures: None
References
- 1.Aaronson KD, Schwartz JS, Chen TM, Wong KL, Goin JE, Mancini DM. Development and prospective validation of a clinical index to predict survival in ambulatory patients referred for cardiac transplant evaluation. Circulation. 1997;95:2660–2667. doi: 10.1161/01.cir.95.12.2660. [DOI] [PubMed] [Google Scholar]
- 2.Brophy JM, Dagenais GR, McSherry F, Williford W, Yusuf S. A multivariate model for predicting mortality in patients with heart failure and systolic dysfunction. Am J Med. 2004;116:300–304. doi: 10.1016/j.amjmed.2003.09.035. [DOI] [PubMed] [Google Scholar]
- 3.Levy WC, Mozaffarian D, Linker DT, Sutradhar SC, Anker SD, Cropp AB, Anand I, Maggioni A, Burton P, Sullivan MD, Pitt B, Poole-Wilson PA, Mann DL, Packer M. The Seattle Heart Failure Model: prediction of survival in heart failure. Circulation. 2006;113:1424–1433. doi: 10.1161/CIRCULATIONAHA.105.584102. [DOI] [PubMed] [Google Scholar]
- 4.Mullens W, Abrahams Z, Skouri HN, Taylor DO, Starling RC, Francis GS, Young JB, Tang WH. Prognostic evaluation of ambulatory patients with advanced heart failure. Am J Cardiol. 2008;101:1297–1302. doi: 10.1016/j.amjcard.2007.12.031. [DOI] [PubMed] [Google Scholar]
- 5.Stempfle HU, Alt A, Stief J, Siebert U. The Munich score: a clinical index to predict survival in ambulatory patients with chronic heart failure in the era of new medical therapies. J Heart Lung Transplant. 2008;27:222–228. doi: 10.1016/j.healun.2007.10.016. [DOI] [PubMed] [Google Scholar]
- 6.Zugck C, Kruger C, Kell R, Korber S, Schellberg D, Kubler W, Haass M. Risk stratification in middle-aged patients with congestive heart failure: prospective comparison of the Heart Failure Survival Score (HFSS) and a simplified two-variable model. Eur J Heart Fail. 2001;3:577–585. doi: 10.1016/s1388-9842(01)00167-2. [DOI] [PubMed] [Google Scholar]
- 7.Wang TJ, Gona P, Larson MG, Tofler GH, Levy D, Newton-Cheh C, Jacques PF, Rifai N, Selhub J, Robins SJ, Benjamin EJ, D’Agostino RB, Vasan RS. Multiple biomarkers for the prediction of first major cardiovascular events and death. N Engl J Med. 2006;355:2631–2639. doi: 10.1056/NEJMoa055373. [DOI] [PubMed] [Google Scholar]
- 8.Rautaharju PM, Kooperberg C, Larson JC, LaCroix A. Electrocardiographic abnormalities that predict coronary heart disease events and mortality in postmenopausal women: the Women’s Health Initiative. Circulation. 2006;113:473–480. doi: 10.1161/CIRCULATIONAHA.104.496091. [DOI] [PubMed] [Google Scholar]
- 9.Snedecor GW, Cochran WG. Statistical methods. 8. Ames: Iowa State University Press; 1989. [Google Scholar]
- 10.Breiman LJHF, Olsthen RA, Stone J. Classification and Regression Trees. Monterey, CA: Wadsworth International; 1984. [Google Scholar]
- 11.Austin PC, Tu JV, Lee DS. Logistic regression had superior performance compared with regression trees for predicting in-hospital mortality in patients hospitalized with heart failure. J Clin Epidemiol. doi: 10.1016/j.jclinepi.2009.12.004. [DOI] [PubMed] [Google Scholar]
- 12.Breiman L. Bagging predictors. Machine Learning. 1996;24:123–140. [Google Scholar]
- 13.Breiman L. Heuristics of instability and stabilization in model selection. Annals of Statistics. 1996;24:2350–2383. [Google Scholar]
- 14.Ishwaran H, Kogalur UB, Blackstone EH, Lauer MS. Random Survival Forests. Annals of Applied Statistics. 2008;2:841–860. [Google Scholar]
- 15.Ward MM, Pajevic S, Dreyfuss J, Malley JD. Short-term prediction of mortality in patients with systemic lupus erythematosus: classification of outcomes using random forests. Arthritis Rheum. 2006;55:74–80. doi: 10.1002/art.21695. [DOI] [PubMed] [Google Scholar]
- 16.Heidema AG, Feskens EJ, Doevendans PA, Ruven HJ, van Houwelingen HC, Mariman EC, Boer JM. Analysis of multiple SNPs in genetic association studies: comparison of three multi-locus methods to prioritize and select SNPs. Genet Epidemiol. 2007;31:910–921. doi: 10.1002/gepi.20251. [DOI] [PubMed] [Google Scholar]
- 17.Mamyrova G, O’Hanlon TP, Monroe JB, Carrick DM, Malley JD, Adams S, Reed AM, Shamim EA, James-Newton L, Miller FW, Rider LG. Immunogenetic risk and protective factors for juvenile dermatomyositis in Caucasians. Arthritis Rheum. 2006;54:3979–3987. doi: 10.1002/art.22216. [DOI] [PMC free article] [PubMed] [Google Scholar]
- 18.Lunetta KL, Hayward LB, Segal J, Van Eerdewegh P. Screening large-scale association study data: exploiting interactions using random forests. BMC Genet. 2004;5:32. doi: 10.1186/1471-2156-5-32. [DOI] [PMC free article] [PubMed] [Google Scholar]
- 19.Qi Y, Bar-Joseph Z, Klein-Seetharaman J. Evaluation of different biological data and computational classification methods for use in protein interaction prediction. Proteins. 2006;63:490–500. doi: 10.1002/prot.20865. [DOI] [PMC free article] [PubMed] [Google Scholar]
- 20.Ishwaran H, Kogalur UB, Gorodeski EZ, Minn AJ, Lauer MS. High dimensional variable selection for survival data. Journal of the American Statististical Association. 2010;105:205–217. [Google Scholar]
- 21.Hsich E, Gorodeski EZ, Starling RC, Blackstone EH, Ishwaran H, Lauer MS. Importance of treadmill exercise time as an initial prognostic screening tool in patients with systolic left ventricular dysfunction. Circulation. 2009;119:3189–3197. doi: 10.1161/CIRCULATIONAHA.109.848382. [DOI] [PMC free article] [PubMed] [Google Scholar]
- 22.Harrell FE. Regression modeling strategies: with applications to linear models, logistic regression, and survival analysis. Vol. 49. New York: Springer; 2001. [Google Scholar]
- 23.Cockcroft DW, Gault MH. Prediction of creatinine clearance from serum creatinine. Nephron. 1976;16:31–41. doi: 10.1159/000180580. [DOI] [PubMed] [Google Scholar]
- 24.Nishime EO, Cole CR, Blackstone EH, Pashkow FJ, Lauer MS. Heart rate recovery and treadmill exercise score as predictors of mortality in patients referred for exercise ECG. Jama. 2000;284:1392–1398. doi: 10.1001/jama.284.11.1392. [DOI] [PubMed] [Google Scholar]
- 25.Segal MR. Regression Trees for Censored-Data. Biometrics. 1988;44:35–47. [Google Scholar]
- 26.Ishwaran H, Blackstone EH, Apperson-Hansen C, Rice TW. A novel approach to cancer staging: application to esophageal cancer. Biostatistics. 2009;10:603–620. doi: 10.1093/biostatistics/kxp016. [DOI] [PMC free article] [PubMed] [Google Scholar]
- 27.Rizk NP, Ishwaran H, Rice TW, Chen LQ, Schipper PH, Kesler KA, Law S, Lerut TEMR, Reed CE, Salo JA, Scott WJ, Hofstetter WL, Watson TJ, Allen MS, Rusch VW, Blackstone EH. Optimum Lymphadenectomy for Esophageal Cancer. Annals of Surgery. 2010;251:46–50. doi: 10.1097/SLA.0b013e3181b2f6ee. [DOI] [PubMed] [Google Scholar]
- 28.Weichselbaum RR, Ishwaran H, Yoon T, Nuyten DS, Baker SW, Khodarev N, Su AW, Shaikh AY, Roach P, Kreike B, Roizman B, Bergh J, Pawitan Y, van de Vijver MJ, Minn AJ. An interferon-related gene signature for DNA damage resistance is a predictive marker for chemotherapy and radiation for breast cancer. Proc Natl Acad Sci U S A. 2008;105:18490–18495. doi: 10.1073/pnas.0809242105. [DOI] [PMC free article] [PubMed] [Google Scholar]
- 29.Schapire RE. [Accessed August 24, 2010.];The boosting approach to machine learning: an overview. Available at: http://74.125.155.132/scholar?q=cache:YirIIUAAd_kJ:scholar.google.com/+definition+machine+learning+method&hl=en&as_sdt=20000000&as_vis=1.
- 30.Breiman L. Random forests. Machine Learning. 2001;45:5–32. [Google Scholar]


