
Figure 1. Kir4.1 protein undergoes robust developmental upregulation, with region-specific levels of expression.
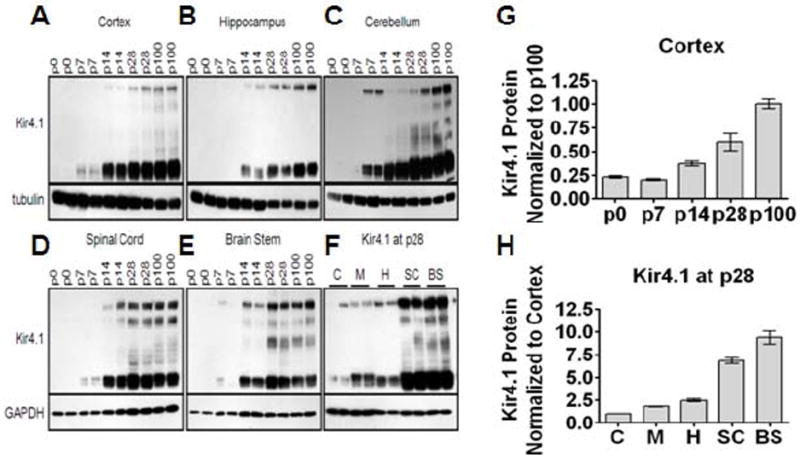
(A-E) Western blotting shows that Kir4.1 protein increases with increasing age from p0 to p100 in various brain regions. Kir4.1 appears as a monomer and tetramer at approximately 50 kDa and 200 kDa, respectively. Tubulin or gapdh were used as loading controls. (G) Densitometric analysis of cortical western blot provides representative quantification of developmental upregulation of Kir4.1. (F) Protein analysis of various brain regions at one age, p28, reveals region-specific expression levels of Kir4.1. Cortex (C), hippocampus (H), and cerebellum (M) possess lower levels of Kir4.1 protein compared to spinal cord (SC) and brain stem (BS) which demonstrate highest levels of Kir4.1 protein. (H) Densitometric analysis quantifies region-specific levels of Kir4.1 expression in the CNS.