
Figure 2. KCNJ10 mRNA levels parallel developmental increases in Kir4.1 protein.
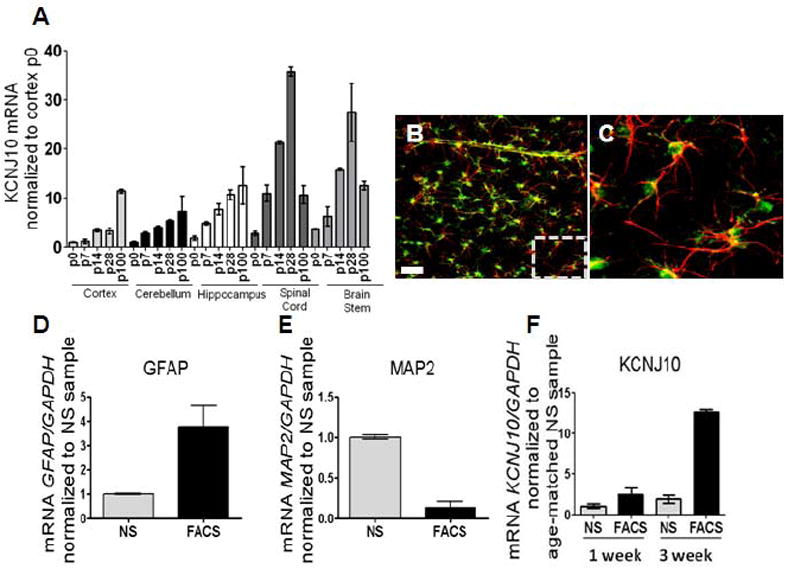
(A) qPCR analysis shows increases in KCNJ10 transcript from p0 to p100 in cortex, cerebellum, and hippocampus. A 25- and 15-fold decrease of KCNJ10 transcript is observed in spinal cord and brain stem, respectively at p100. For qPCR analysis, fold expression is relative to gapdh and normalized to p0 of the cortex (n=3 for all brain regions and ages). (B and C) Representative image of cortical brain slice from transgenic eGFP-S100β animals used in FACS sorting experiments are shown. GFAP (red) staining demonstrates co-localization of eGFP expression with GFAP positive astrocytes. Dashed box denotes zoomed region displayed in Fig. 2C. Scale bar is 50μm. (D and E) qPCR analysis of GFAP and MAP2 was utilized as a control for FACS; simultaneous increases in GFAP with reductions in MAP2 are observed in FACS cells compared to not sorted (NS). (F) Compared to not sorted (NS) samples, FACS of eGFP+ astrocytes (FACS) demonstrate a 2.5- and 12.6-fold enrichment of KCNJ10 transcript at one week (p5-7) and three week (p20-21) aged animals, respectively. Error bars represent s.e.m.