

Abstract
Heart valve defects are the most common cardiac defects. Therefore, defining the mechanisms of cardiac valve development is critical to our understanding and treatment of these disorders. At early stages of embryonic cardiac development, the heart begins as a simple tube that then becomes constricted into separate atrial and ventricular regions by the formation of small, mound-like structures, called atrioventricular (AV) cushions. As valve development continues, these mounds fuse and then elongate into valve leaflets. A longstanding hypothesis proposes that blood flow-generated shear stress and pressure are critical in shaping the cushions into leaflets. Here we show results from a two-dimensional mathematical model that simulates the forces created by blood flow present in a developing chick heart and in our in vitro, tubular model system. The model was then used to predict flow patterns and the resulting forces in the in vitro system. The model indicated that forces associated with shear stress and pressure have comparable orders of magnitude and collectively produce a rotational profile around the cushion in the direction of flow and leaflet growth. Further, it was concluded that the replication of these forces on a cushion implanted in our tubular in vitro system is possible. Overall, the two-dimensional, mathematical model provides insight into the forces that occur during early cardiac valve elongation.
Keywords: Heart development, Shear stress, Atrioventricular valve
INTRODUCTION
Developmental heart defects are the most common birth defects and heart valve defects are the most common cardiac defect.1 Therefore, defining the mechanisms of cardiac valve development is critical to our understanding and treatment of these debilitating disorders. During the course of vertebrate cardiac development, a simple but functional two-cell-layered heart tube is transformed into a multi-chambered organ composed of a number of specialized tissues. The outside layer of the early heart tube is composed of cardiac myocytes, which are the contractile (myocardial) cells of the heart. The cells of the inner layer are endocardial cells and line the lumen of the adult heart.7 One of the first morphological changes that occur during cardiac morphogenesis is the separation of the atrial and ventricular chambers. During the initial phase of this process, swellings develop in the atrioventricular (AV) canal, the area separating these chambers (Fig. 1). These swellings, referred to as the AV cushions, are composed of a gelatinous tissue matrix that is secreted by cells of the myocardium. Endocardial cells of the AV cushions undergo a phenotypical change in which they leave the epithelium and move into the cushions and become mesenchyme via a process called epithelial-to-mesenchymal transformation. During further development, the AV cushions elongate, fuse and thin into fibrous leaflets, which function to prevent regurgitation of blood from the ventricular chamber back into the atrial chamber.5 Many studies have been conducted to characterize the development of the cardiac canal in vivo14,23 and more specifically identify complexities in heart contraction and wall motion.
FIGURE 1.
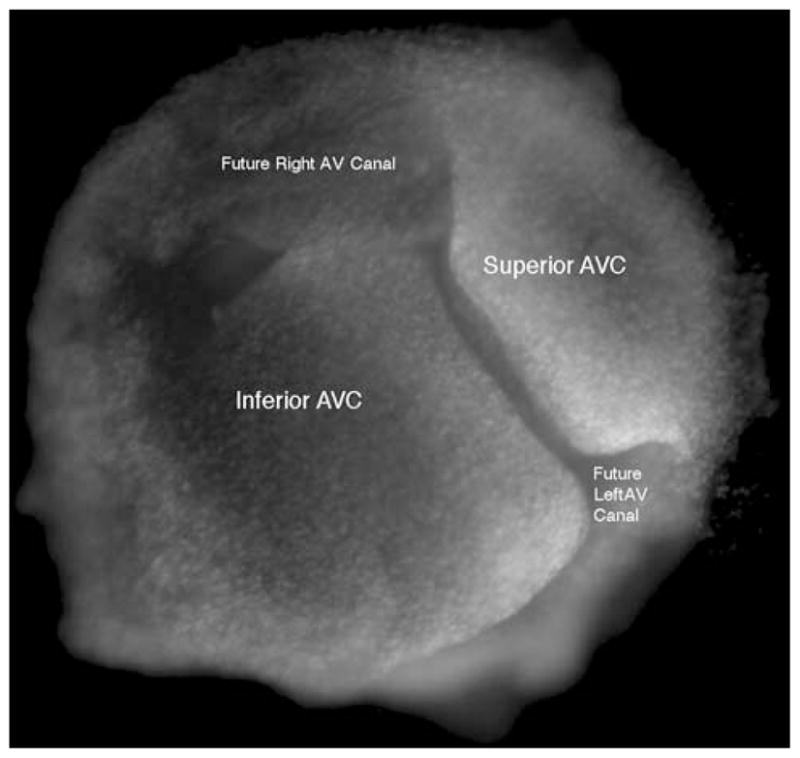
The actual geometry of two chick HH 25 atrioventricular cushions (AVC) which have been fixed and do not represent a particular point during the cardiac cycle. The direction of flow is into the paper.
Cardiac valve development is dependent upon many different factors. Both genetic and mechanical factors contribute to the proper formation of cardiac valves.3 While genetic factors have received the majority of investigators’ attention, progress has been made in delineating the effect of mechanical forces. These mechanical forces are pressure and fluid shear stress, which are both generated by blood flowing through the heart.24
In an artificial model of fluid flow in the cardiovascular system, Rodbard generated cushion and valve-like structures by altering fluid flow in silicone gel-lined tubes.17 This suggests that fluid flow alone is capable of shaping malleable substances into valve-like structures. More recent investigations have provided evidence that fluid flow is critical in shaping the developing cardiovascular system.2,9,11,16,21,22 Experiments in which hemodynamic load within the heart was altered determined that cardiac growth and development were affected.20 Generally, in these studies, a component of the circulatory system was restricted, resulting in an increase or decrease in hemodynamic pressure in the heart depending on the location of the restriction. These investigations provided data that strongly indicate normal cardiovascular development is dependent on fluid flow.
Much is known about the initial AV cushion formation due in large part to an in vitro system that models in vivo cushion formation.15,18 In contrast, little is known about how the cushions elongate into leaflets. Characterization of factors involved in this developmental process could provide further insight to the treatment of congenital valve disorders. Our group has developed an in vitro, tubular system that models leaflet formation. We have reported that valve leaflet formation was dependent on the presence of spontaneously contracting cardiac myocytes.8 Cushions cultured in these collagen tubes without myocytes failed to promote the maturation of valve cushions. We propose to use our tubular culturing system to test if fluid flow-induced forces are sufficient to drive leaflet formation. In these experiments we will apply a steady-state flow to test the effect of flow-generated shear stress and pressure on leaflet formation (Figs. 2a and 2b). However, before these experiments can be conducted such that the results are interoperable, accurate mathematical models need to be developed which accurately represent the in vitro model system and relate it to the in vivo avian heart. It is simulating the forces present in our in vitro tubular culturing system that is of primary interest in the current study. Currently the system is run at steady state and cannot mimic the more complex aspects of asymmetric heart contraction present in vivo that have been described in other studies.14,23
FIGURE 2.
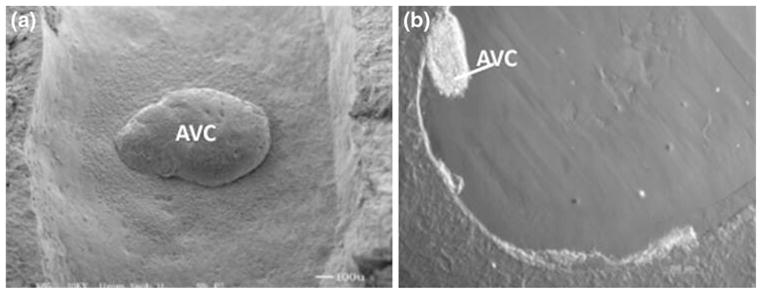
The geometry of a single AV cushion implanted in the lumen of an in vitro collagen tube.8 (a) Top view of the cushion (flow is from bottom to top). (b) Side view of the cushion (direction of flow is into the paper).
The objective of the present work is to use a simple mathematical model to simulate flow patterns and estimate pressure and shear stresses in developing cardiac valve tissue at flows consistent with published in vivo estimates. The final goal is to use the model to estimate flow parameters predicted for the aforementioned in vitro tubular culturing system in order to obtain similar shear stress values at the midpoint surface of a single, implanted cushion. Because the tubular culturing system operates under steady state flow, the model developed for in vivo estimates is representative of pseudo steady state flow and represents two different snapshots in time during the in vivo cardiac cycle of a chick embryo. These studies provide the foundation for defining the flow conditions necessary for cardiac valves to develop.
THEORETICAL BASIS
The mathematical model developed here simulates flow patterns and estimates flow-induced forces values for incompressible, Newtonian flow through two infinite slits containing idealized AV cushions. It has already been shown that for low Reynolds numbers, a two-dimensional model can accurately predict flow characteristics such as velocity and pressure.4,6 The simplified symmetrical flow through two infinite slits is used to represent flow along the centerline of a three-dimensional tube. The AV cushion is idealized as a mound extending infinitely in the z-direction.
All flow characteristics were specified in the Incompressible, Navier–Stokes, Steady-State Analysis module of COMSOL Multiphysics 3.4. In the two-dimensional system, flow does not vary in the z-direction; therefore, only x and y components of the Navier–Stokes equations (Eqs. 1 and 2) and continuity equation (Eq. 3) were used. For the coordinate system used here, the x direction is set as the horizontal axis aligned with flow while the y axis extends in vertically in the radial direction. Further, the origin of the coordinate system is set at the centerline of the tube entrance.
| (1) |
| (2) |
| (3) |
where ux and uy are the velocities in the x and y direction respectively, p is the pressure, ρ is the fluid density, and μ is the fluid viscosity.
Boundary conditions were specified in the module along each border of the slit. First, the entrance velocity distribution was established. Equation (4) shows the parabolic velocity profile between a slit, which was specified at inflow. A parabolic inflow profile was selected to maintain continuity with the assumption of fully developed, steady state flow. The fully developed flow assumption was used to connect the model to our tubular in vitro system which is characterized by a recycled, steady-state flow. This condition can be considered if compliance mismatch does not occur in our tubular in vitro system. Because the material properties of our collagen tubes are comparably similar to the polymer tubing used in our recycle, we have negated any effects due to compliance mismatch. Next, no-slip conditions were specified along the entire arc length of the outer surface (Eq. 5). Finally, an outlet pressure of 0 dyne cm−2 was specified (Eq. 6) so that pressure could be gauged (ambient pressure). The length of the tube was specified to have a negligible effect on the results presented here.
| (4) |
| (5) |
| (6) |
where uxave and uxmax are the average fluid velocity in the x direction and the maximum fluid velocity in the x direction, h is half of the slit separation (equivalent to tube radius), and L is the total tube length.
The COMSOL module utilized the three primary equations in conjunction with these three boundary conditions to simulate velocity profiles and streamline plots. Once these profiles are created, shear stress and pressure forces present along the arc length of the outer surface are calculated. For laminar flow of a Newtonian fluid, the stress tensor, , has three non-zero terms. These terms are shown in Cartesian Coordinates in Eqs. (7)–(9) where μ is the viscosity of the fluid (i.e., blood).
| (7) |
| (8) |
| (9) |
On a surface oriented such that its unit outer normal is n⃗ the force per unit area that is due to stress components is given by Eq. (10).
| (10) |
This force acts tangential to the inner tube surface as depicted in Fig. 3. In addition, the pressure force acts perpendicular to the surface and is directed toward the surface when it is positive (Fig. 3).
FIGURE 3.
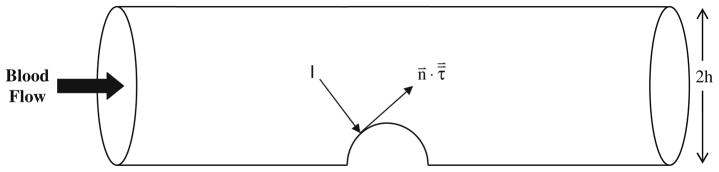
A schematic of the in vitro tubular system used to study valve leaflet formation.8 The flow-induced shear stress and pressure force on the cushion act tangential and normal to the cushion respectively. The two-dimensional mathematical model idealizes this three-dimensional tubular geometry as a two-dimensional slit with a gap separation of 2 h.
RESULTS AND DISCUSSION
The first objective of the study was to simulate flow in a chick heart containing two transverse cushions. At Hamburger and Hamilton10 stage 25 of chick development the AV cushions are fully developed although not yet fused (Fig. 1); therefore, this is the stage in development that was represented by the simulation shown here. The simulation for flow in a stage 25 developing chick heart will be referred to as the in vivo system. Prior experimental quantification of flow velocities have already been made for stage 25 of a developing chick heart.3 Flow parameters used were for a stage 25 chick heart during the open (diastole) and closed (systole) states of cardiac contraction. These two stages were treated mathematically as pseudo steady state snapshots in time. An estimated maximum entrance velocity of 0.2 m s−1 was published for the maximum rapid filling point in time of diastole and cushion thickness was estimated to be 250 μm.3 The slit diameter was estimated to be 1 mm and the total tube length was estimated to be 4 mm. Assuming a blood density of 1060 kg/m3 and a viscosity of 0.003 Pa·s,12 the Reynolds number for fully developed flow in the entrance region of the slit was 71, which is considered laminar. The geometry of the slit was identified in the simulation along with the fluid properties.
Figure 4a shows the geometry of two identical 250 μm AV cushions across from one another in the 1 mm slit. Therefore, the total obstruction of flow at the center of the tube is 0.5 mm. Under these flow conditions, two small eddies appear just after the cushions. The formation of eddies has also been shown in both the three-dimensional modeling and the two-dimensional modeling of laminar flow through two fixed mechanical heart valve leaflets.6 The eddies shown here could provide a short backflow on the downstream side of the cushions. Figure 4b shows the shear stress profile along the normalized arc length of the outer surface. This profile was generated by finding the magnitude of the shear stress along the arc length, as defined in Eq. (10). The peak shear stress value occurs at the cushion’s midpoint surface and is equal to 277 dyne cm−2. This force associated with shear stress acts tangent to the cushion surface and acts in the direction of flow.
FIGURE 4.

Numerical results for flow in a slit containing idealized stage 25 chick cushions with a thickness of 250 μm during diastole. The centerline entrance velocity is 0.2 m s−1 corresponding a Reynolds number of 71. Small eddies are present on the outflow side of each cushion. (a) Streamlines resulting in a maximum velocity of 0.39 m s−1 over the cushions; (b) shear stress profile over the heart tube’s bottom arc length with a maximum shear stress on the cushion surface of 277 dyne cm−2; (c) ambient pressure profile with maximum and minimum pressure occurring at the front and back face of the cushion.
Figure 4c shows the force associated with pressure per unit length profile along the normalized arc length of the outer surface. The pressure profile was generated by calculating the magnitude of the normally acting force per unit length along the arc length. Pressure initially has a linear trend along the arc length but peaks to 552 dyne cm−2 upon contact with the cushion. Pressure force is normal to the cushion and creates a direct pushing force on the entrance side of the cushion. On the opposite side of the cushion, pressure drops drastically to −235 dyne cm−2 causing a normal force which acts in the opposite direction as flow. Pressure then rises to yield an outlet pressure of 0 dyne cm−2. Because pressure in the figure is gauged relative to the outlet pressure, the negative pressure on the far side of the cushion indicates a pressure smaller than the outlet pressure. Flow into a spherical obstruction will always yield a peak in pressure upon contact followed by a drop in pressure in the far side. As shown in Fig. 4, the pressure increase and decrease are of the same order of magnitude as the shear stress values indicating that both values are important to the morphogenesis of the cushion. The combination of both shear force and pressure force is expected to cause eddies in the flow patterns. Additionally, the profile of net force along the cushion surface indicates a potential rotation of cushion in the direction of flow. Toward the bottom of the inflow side of the cushion, the net force occurs upwards and away from the cushion in the direction of flow. However; toward the bottom of the outflow side of the cushion the net force pushes into the cushion. This overall profile could account for the rotation of a cushion in the direction of flow to form a leaflet.
Next, systolic flow in a chick heart containing two transverse cushions was characterized. The flow through a stage 25 chick heart during the maximum time point of rapid ejection in systole has recently been estimated.3 This point in time was modeled with a pseudo steady state snapshot in time. At this point in development, the flow restriction was reported to be 900 μm. This was represented in the simulation by a coupling of smaller tube diameter (800 μm) and larger cushion thickness (350 μm each). The centerline entrance velocity was estimated to be 0.015 m s−1.3 The Reynolds number at this stage is 4, a drastic decrease from diastole. Figure 5a shows the two-dimensional slit geometry with added cushion thickness and decreased tube diameter. The streamlines in the figure indicate that at the reduced velocity, eddy formation is slight and minimal stress is expected to be placed on the cushions. Figure 5b shows the shear stress profile along the normalized bottom arc length. The maximum shear stress on the lower cushion is 110 dyne cm−2, approximately half of the diastolic shear stress. Figure 5c shows the pressure profile along the normalized arc length of the outer surface. As expected, the pressure along the bottom arc length initially drops linearly and then peaks to 605 dyne cm−2 at contact with the cushion. The pressure then drops to 8.3 dyne cm−2 on the latter side of the cushion. At the midpoint surface of the cushions, the pressure is approximately 210 dyne cm−2, the same order of magnitude as the shear stress at this locus.
FIGURE 5.

Numerical results for flow in a slit containing idealized stage 25 chick cushions with a thickness of 350 μm during systole. The centerline entrance velocity is 0.015 m s−1 corresponding to a Reynolds number of 4.2. (a) Streamlines resulting in a maximum velocity of 0.1 m s−1 over the cushions; (b) shear stress profile over the heart tube’s bottom arc length with a maximum shear stress on the cushion surface of 110 dyne cm−2; (c) ambient pressure profile with maximum and minimum pressure occurring at the front and back face of the cushion.
The next objective of this study was to define flow conditions that would be necessary in the simulated in vitro tubular system8 that would result in similar shear values to the estimates described above for the in vivo stages of diastole and systole in the developing chick heart. The enriched media solution used in the tubular culturing system has a density of 1000 kg/m3 and a viscosity of 0.005 Pa·s. These characteristics were used in modeling flow in the in vitro simulation. The geometry of the in vitro tubular culturing system is composed of a 2 mm in diameter and 8 mm in length tube with only one cushion, approximately 500 μm in thickness, implanted on the inner lumen. During development, this cushion becomes elongated and forms a valve leaflet. Therefore, diastolic and systolic flow was simulated in the in vitro tubular culturing system for a cushion geometry as well as a leaflet geometry (mound shape and fin shape). The numerical, two-dimensional model was used to estimate entrance velocities that would be required in the in vitro tubular system to obtain similar shear stresses to those recovered in vivo for stage 25 chick embryos.
First, the simulation was used for shear stresses identical to those isolated in vivo for diastole in stage 25 embryos. The maximum shear stress, as shown in Fig. 4b, is 277 dyne cm−2. Figure 6a shows the streamlines for the in vitro tubular system with similar stresses applied to the cushion. It was found that an entrance maximum velocity of 0.84 m s−1 is required to create a shear stress of 277 dyne cm−2 at the midpoint surface of the mound. As shown, there is a large eddy on the backside of the cushion. Figure 6b shows the shear stress profile along the normalized bottom arc length. Figure 6c shows the pressure force along the bottom arc length. With such a high level of flow, pressure peaks at 995 dyne cm−2 and drops to a negative value of −440 dyne cm−2. The pressure force and shear stress are still of the same order of magnitude.
FIGURE 6.

Numerical results for flow in a slit representative of an idealized in vitro tube containing a single AV cushion undergoing sheer conditions equivalent to those in an idealized stage 25 chick heart during diastole. The centerline entrance velocity is 0.72 m s−1 corresponding to a Reynolds number of 1440. A large eddy is present on the outflow side of the cushion. (a) Streamlines resulting in a maximum velocity of 0.84 m s−1 over the cushions; (b) shear stress profile over the heart tube’s bottom arc length with a maximum shear stress on the cushion surface of 277 dyne cm−2; (c) ambient pressure profile with maximum and minimum pressure occurring at the front and back face of the cushion.
During diastole, shear stresses were also simulated for the tubular system containing a more developed cushion, or valve leaflet. As the cushion thins and elongates into a leaflet, a shark fin-like-geometry is generated. For a shear stress of 277 dyne cm−2 to be applied to the leaflet, an entrance maximum velocity of 1.2 m s−1 is needed. Figure 7a shows the streamlines for the leaflet model with diastolic flow conditions. There is a much larger eddy present on the backside of the leaflet due to the geometric change of the cushion. Figure 7b shows the shear stress profile along the normalized bottom arc length. Due to the asymmetric fin shape of the leaflet, the shear stress profile is no longer symmetric over the valve. The peak shear stress of 277 dyne cm−2 occurs at the central arc length; however, another peak in shear stress occurs at the very tip of the fin. This second spike provides insight to how shear stress may shape the eventual thin, fibrous geometry of the valve leaflets. Figure 7c shows the pressure force along the normalized bottom arc length. The pressure peaks at 2200 dyne cm−2 upon contact with the fin and drops to −355 dyne cm−2 on the exit side of the fin.
FIGURE 7.

Numerical results for flow in a slit representative of an idealized in vitro tube containing a single AV leaflet undergoing sheer conditions equivalent to those in an idealized stage 25 chick heart during diastole. There is a centerline entrance velocity of 1.02 m s−1 corresponding to a Reynolds number of 2040. An extremely large eddy is present on the outflow side of the leaflet. (a) Streamlines resulting in a maximum velocity of 1.2 m s−1 over the leaflet; (b) shear stress profile over the heart tube’s bottom arc length with a maximum shear stress on the leaflet surface of 277 dyne cm−2; (c) ambient pressure profile with maximum and minimum pressure occurring at the front and back face of the leaflet.
Next, the mathematical model was used on the in vitro cushion for applied shear stresses similar to the systolic contraction in stage 25 chick embryos (110 dyne cm−2 as shown in Fig. 5b). Figure 8a shows the streamline profile for the single-cushion tubular model. An entrance velocity of 0.44 m s−1 is needed to create the maximum shear stress of 110 dyne cm−2 over the cushion. A smaller eddy is present in this figure. Figure 8b shows the shear stress profile along the normalized bottom arc length. Figure 8c shows the pressure force along the normalized bottom arc length and cushion. The pressure peaks at 260 dyne cm−2 upon contact with the cushion and drops to −200 dyne cm−2 on the exit side of the cushion.
FIGURE 8.

Numerical results for flow in a slit representative of an idealized in vitro tube containing a single AV cushion undergoing sheer conditions equivalent to those in an idealized stage 25 chick heart during systole. There is a centerline entrance velocity of 0.36 m s−1 corresponding to a Reynolds number of 760. An eddy is present on the outflow side of the cushion. (a) Streamlines resulting in a maximum velocity of 0.44 m s−1 over the cushions; (b) shear stress profile over the heart tube’s bottom arc length with a maximum shear stress on the cushion surface of 110 dyne cm−2; (c) ambient pressure profile with maximum and minimum pressure occurring at the front and back face of the cushion.
Finally the shear stress of 100 dyne cm−2 was simulated for the in vitro leaflet tubular system. Figure 9a shows the streamlines of the single fin in vitro system undergoing shear stresses equal to those present in an HH-stage 25 chick heart during systole. A centerline entrance velocity of 0.64 m s−1 is needed to create a shear stress of 110 dyne cm−2 over the mound. As shown, the switch from cushion to leaflet yielded a drastic change in the streamline layout. In Fig. 9a, a large eddy is shown just following the fin. Figure 9c shows the pressure force along the normalized bottom arc length. The pressure peaks at 650 dyne cm−2 upon contact with the fin and drops to −165 dyne cm−2 on the exit side of the fin.
FIGURE 9.

Numerical results for flow in a slit representative of an idealized in vitro tube containing a single AV leaflet undergoing sheer conditions equivalent to those in an idealized stage 25 chick heart during systole. There is a centerline entrance velocity of 0.54 m s−1 corresponding to a Reynolds number of 1080. An eddy is present on the outflow side of the leaflet. (a) Streamlines resulting in a maximum velocity of 0.64 m s−1 over the leaflet; (b) shear stress profile over the heart tube’s bottom arc length with a maximum shear stress on the leaflet surface of 110 dyne cm−2; (c) ambient pressure profile with maximum and minimum pressure occurring at the front and back face of the leaflet.
CONCLUSION
In the present study, a two-dimensional, mathematical model was developed to simulate flow through the developing heart. The effectiveness of the model’s ability to describe flow-generated forces was assessed. The mathematical model was found to be a capable means to estimate key forces in the heart such as pressure and shear stress. A maximum shear stress of 277 dyne cm−2 was estimated to occur in the direction of flow and tangent to developing valve cushions during the peak of diastole, while a maximum shear stress of 110 dyne cm−2 was estimated to occur during the peak of systole. Pressure was of the same order of magnitude as shear stress and was found to act in the direction of flow on the entrance side of the heart, but, interestingly, in the opposite direction of flow on the downstream side of the cushion. This net force profile on the cushion surface could be related to the leafing of the cushion in the direction of flow and eventual cushion morphogenesis could be driven by a response to these mechanical forces. Further, vortices were shown to appear on the downstream side of the cushions tissue for Reynolds numbers which were larger than approximately 4. The in vivo simulations showed large vortex formation during the diastolic snapshot and minimal formation during the systolic snapshot. These results are comparable to previous work which included modeling of flow patterns in the embryonic heart.13,19 In each study, the transition to downstream vortex formation was shown to occur at Reynolds numbers ranging from 1 to 10. The mathematical modeling in this work will be used in future experiments to predict the flow needed in the in vitro tubular system to generate similar flow-induced forces as those experienced in vivo and ultimately optimally shape implanted cushions into valve leaflets.
Acknowledgments
The authors would like to acknowledge The University of South Carolina Magellan Scholars Program for providing funding of the research project. Further gratitude is extended toward The National Institute of Health, Department of Health and Human Services for providing funding under grant number R01HL086856. Finally, the authors thank Dr. Francis Gadala-Maria and Dr. Arash Kheradvar for their helpful comments.
References
- 1.Armstrong EJ, Bischoff J. Heart valve development: endothelial cell signaling and differentiation. Circ Res. 2004;95:459–470. doi: 10.1161/01.RES.0000141146.95728.da. [DOI] [PMC free article] [PubMed] [Google Scholar]
- 2.Bartman T, Hove J. Mechanics and function in heart morphogenesis. Dev Dyn. 2005;233:373–381. doi: 10.1002/dvdy.20367. [DOI] [PubMed] [Google Scholar]
- 3.Butcher JT, McQuinn TC, Sedmera D, Turner D, Markwald RR. Transitions in early embryonic atrioventricular valvular function correspond with changes in cushion biomechanics that are predictable by tissue composition. Circ Res. 2007;100:1503–1511. doi: 10.1161/CIRCRESAHA.107.148684. [DOI] [PubMed] [Google Scholar]
- 4.Cheng R, Lai YG, Chandran KB. Three-dimensional fluid-structure interaction simulation of bileaflet mechanical heart valve flow dynamics. Ann Biomed Eng. 2004;32(11):1471–1483. doi: 10.1114/b:abme.0000049032.51742.10. [DOI] [PMC free article] [PubMed] [Google Scholar]
- 5.De Lange FJ, Moorman AF, Anderson RH, Manner J, Soufan AT, De Gier-De Vries C, Schneider MD, Webb S, Van Den Hoff MJ, Christoffels VM. Lineage and morphogenetic analysis of the cardiac valves. Circ Res. 2004;95:645–654. doi: 10.1161/01.RES.0000141429.13560.cb. [DOI] [PubMed] [Google Scholar]
- 6.Ge L, Jones CS, Stiropoulos F, Healy TM, Yoganathan AP. Numerical simulation of flow in mechanical heart valves: grid resolution and the assumption of flow symmetry. J Biomech Eng. 2003;125:709–718. doi: 10.1115/1.1614817. [DOI] [PubMed] [Google Scholar]
- 7.Gonzalez-Sanchez A, Bader D. In vitro analysis of cardiac progenitor cell differentiation. Dev Biol. 1990;139:197–209. doi: 10.1016/0012-1606(90)90288-t. [DOI] [PubMed] [Google Scholar]
- 8.Goodwin RL, Nesbitt T, Price RL, Wells JC, Yost MJ, Potts PD. Three-dimensional model system of valvulogenesis. Dev Dyn. 2005;233:122–129. doi: 10.1002/dvdy.20326. [DOI] [PubMed] [Google Scholar]
- 9.Hall CE, Hurtado R, Hewett KW, Shulimovich M, Poma CP, Reckova M, Justus C, Pennisi DJ, Tobita K, Sedmera D, Gourdie RG, Miwawa T. Hemodynamic-dependent patterning of endothelin converting enzyme 1 expression and differentiation of impulse-conducting Purkinje fibers in the embryonic heart. Development. 2004;131:581–592. doi: 10.1242/dev.00947. [DOI] [PubMed] [Google Scholar]
- 10.Hamburger V, Hamilton HL. A series of normal stages in the development of the chick embryo. Dev Dyn. 1951;195:231–272. doi: 10.1002/aja.1001950404. [DOI] [PubMed] [Google Scholar]
- 11.Hove JR, Koster RW, Forouhar AS, Acevedo-Bolton G, Fraser SE, Gharib M. Intracardiac fluid forces are an essential epigenetic factor for embryonic cardiogenesis. Nature. 2003;421:172–177. doi: 10.1038/nature01282. [DOI] [PubMed] [Google Scholar]
- 12.Hsia TY, Migliavacca F, Pittaccio S, Radaelli A, Dubini G, Pennati G, De Leval M. Computational fluid dynamic study of flow optimization in realistic models of the total cavopulmonary connections. J Surg Res. 2004;116:305–313. doi: 10.1016/j.jss.2003.08.004. [DOI] [PubMed] [Google Scholar]
- 13.Liu A, Rugonyi S, Pentecost JO, Thornburg KL. Finite element modeling of blood flow-induced mechanical forces in the outflow tract of chick embryonic hearts. Comput Struct. 2007;85:727–738. [Google Scholar]
- 14.McQuinn TC, Bratoeva M, deAlmeida A, Remond M, Thompson RP, Sedmera D. High-frequency ultrasonographic imaging of avian cardiovascular development. Dev Dyn. 2007;236:3503–3513. doi: 10.1002/dvdy.21357. [DOI] [PubMed] [Google Scholar]
- 15.Potts JD, Vincent EB, Runyan RB, Weeks DL. Sense and antisense TGF beta 3 mRNA levels correlate with cardiac valve induction. Dev Dyn. 1992;193:340–345. doi: 10.1002/aja.1001930407. [DOI] [PubMed] [Google Scholar]
- 16.Rechova M, Rosengarten C, deAlmedia A, Stanley CP, Wessels A, Gourdie RG, Thompson RP, Sedmera D. Hemodynamics is a key epigenetic factor in development of the cardiac conduction system. Circ Res. 2003;93(1):77–85. doi: 10.1161/01.RES.0000079488.91342.B7. [DOI] [PubMed] [Google Scholar]
- 17.Rodbard S. Vascular modifications induced by flow. Am Heart J. 1956;51(6):926–942. doi: 10.1016/0002-8703(56)90236-8. [DOI] [PubMed] [Google Scholar]
- 18.Runyan RB, Markwald RR. Invasion of mesenchyme into three-dimensional collagen gels: a regional and temporal analysis of interaction in embryonic heart tissue. Dev Biol. 1983;95(1):108–114. doi: 10.1016/0012-1606(83)90010-6. [DOI] [PubMed] [Google Scholar]
- 19.Santhanakrishnan A, Nguyen N, Cox JG, Miller LA. Flow within models of the vertebrate embryonic heart. J Theor Biol. 2009;259:449–461. doi: 10.1016/j.jtbi.2009.04.020. [DOI] [PubMed] [Google Scholar]
- 20.Schroeder JA, Jackson LF, Lee DC, Camenisch TD. Form and function of developing heart valves: coordination by extracellular matrix and growth factor signaling. J Mol Med. 2003;81:392–403. doi: 10.1007/s00109-003-0456-5. [DOI] [PubMed] [Google Scholar]
- 21.Stekelenburg De Vos S, Ursem NT, Hop WC, Wladimiroff JW, Gittenberger De Groot AC, Poelmann RE. Acutely altered hemodynamics following venous obstruction in the early chick embryo. J Exp Biol. 2003;206:1051–1057. doi: 10.1242/jeb.00216. [DOI] [PubMed] [Google Scholar]
- 22.Taber LA. A model for aortic growth based on fluid shear and fiber stresses. J Biomech Eng. 1998;120(3):348–354. doi: 10.1115/1.2798001. [DOI] [PubMed] [Google Scholar]
- 23.Taber LA, Zhang J, Perucchio R. Computational model for the transition from peristaltic to pulsatile flow in the embryonic heart tube. J Biomech Eng. 2007;129:441–449. doi: 10.1115/1.2721076. [DOI] [PubMed] [Google Scholar]
- 24.Van der Heiden K, Groenendijk BCW, Hierck BP, Hogers B, Koerten HK, Mommaas AM, Gittenberger-de Groot AC, Poelmann RE. Monocilia on chicken embryonic endocardium in low shear stress areas. Dev Dyn. 2006;235:19–28. doi: 10.1002/dvdy.20557. [DOI] [PubMed] [Google Scholar]