

Abstract
Diffuse correlation spectroscopy (DCS) uses the temporal fluctuations of near-infrared (NIR) light to measure cerebral blood flow (CBF) non-invasively. Here, we provide a brief history of DCS applications in brain with an emphasis on the underlying physical ideas, common instrumentation and validation. Then we describe recent clinical research that employs DCS-measured CBF as a biomarker of patient well-being, and as an indicator of hemodynamic and metabolic response to functional stimuli.
Keywords: diffuse correlation spectroscopy, cerebral blood flow, functional neuroimaging, diffuse optics, near-infrared spectroscopy, cerebral metabolic rate of oxygen extraction, ischemic stroke, neurocritical care, neonatalogy
1. Introduction
Cerebral well-being depends on adequate cerebral blood flow (CBF) for oxygen delivery and clearance of the byproducts of metabolism. Cerebral tissues receive about 20% of the body’s oxygen, and the majority of this oxygen is consumed in the process of metabolism via aerobic mechanisms (Siesjo, 1978; Zauner et al., 2002). Thus, CBF is an important biomarker of brain health and function. It is a critical physiological parameter linking metabolic demand to oxygen supply, oxygen supply to metabolic consumption, and metabolic consumption to byproduct clearance. Furthermore, CBF impairment is a direct cause of dangerous clinical conditions such as ischemic stroke, and its dynamic alteration is integral to brain auto-regulation.
This review focuses on a relatively new optical technique for non-invasive measurement of this critical biomarker through intact skull. In situ monitoring of cerebral blood flow and its surrogates is not a new goal (Zauner and Muizelaar, 1997). Neuro-vascular (or activation-flow) coupling (Devor et al., 2012; Lou et al., 1987; Mosso, 1881; Roy and Sherrington, 1890; Stanimirovic and Friedman, 2012; Villringer and Dirnagl, 1995) connects CBF to neural response, and, is known, even in normal conditions, to produce measurable blood oxygen level dependent (BOLD) signals accessible to functional magnetic resonance imaging (fMRI). In a similar vein, the effects of neurovascular coupling on cerebral blood oxygen saturation and blood volume are known to perturb functional near infrared spectroscopy (fNIRS) signals. Indeed, accurate monitoring of CBF has important implications in fundamental neuroscience, clinical modeling, rehabilitation, and for patient management and treatment in the hospital (Stanimirovic and Friedman, 2012).
In order to maintain constant blood perfusion in the midst of local variations of pressure and other factors, cerebral auto-regulation (CAR) tightly controls CBF by modulating processes such as vascular resistance (Paulson et al., 1990). Indeed, a common way to assess CAR is to examine the strength of the correlation between cerebral perfusion pressure (CPP) and CBF; here CPP is defined as the difference between the mean-arterial pressure (MAP) and the intracranial pressure (ICP).
Clearly, CAR disturbances are important to assess and control, especially in clinical settings. Since CAR is dynamic, in general it is desirable to carry out CAR assessment continuously or at least semi-continuously. To this end, for critically ill patients with brain injuries, invasive measurements of ICP are often used to estimate cerebral perfusion pressure CPP (Smith, 2008), and decreased CPP is viewed as a surrogate for decreased blood perfusion and potentially impaired CAR. In these situations, elevated ICP is managed directly by the clinicians, but additional knowledge about local CBF is valuable for more accurate assessment of CAR.
CBF has value in other contexts. For example, measurements of CBF enable clinicians to distinguish between conditions such as hypoxia and ischemia, to avoid hyperperfusion injury, and to classify different types of hypoxia. In fact, sometimes local microvascular CBF is assessed concurrently using invasive thermal diffusion devices, though for many populations clinicians prefer not to accept the risks of invasive probes (Kofke, 2012).
Clearly, an independent, versatile and non-invasive bedside monitor of local, microvascular CBF is desirable, and it should be apparent to the reader that a potential niche exits for near-infrared optics and, particularly, diffuse correlation spectroscopy (DCS) in the clinic (Boas and Dunn, 2010; Daly and Leahy, 2012; Devor et al., 2012; Durduran et al., 2010a). Diffuse near-infrared light can penetrate non-invasively and deeply into brain to access cerebral tissues; its spectroscopic and transport properties can be used for low resolution monitoring and imaging of the concentrations of tissue chromophores such as oxy- and deoxy-hemoglobin; and, as we will show, its temporal intensity fluctuations can be used to access information about CBF. To date, the bulk of the functional cerebral measurements with diffuse optics for fundamental research and in the clinic have utilized near-infrared spectroscopy (NIRS) or diffuse optical spectroscopy (DOS) (Ferrari and Quaresima, 2012a,b; Ghosh et al., 2012; Wolf et al., 2007). 1 The NIRS/DOS methods are largely employed to measure oxy- and deoxy-hemoglobin tissue concentration dynamics. Access to CBF (and even oxygen metabolism) is possible with NIRS/DOS, but only if some form of flow tracer is utilized, e.g., a short breath of 100% oxygen or an injection of a contrast agent such as indocyanine green (ICG, Section 4.2.4). These more perturbative approaches sometimes introduce ambiguities, and they can be invasive and are difficult to employ continuously.
Diffuse correlation spectroscopy (DCS) is an optical technique that utilizes near-infrared light to directly and non-invasively measure local, microvascular CBF (Durduran et al., 2010a). DCS is based on physical principles similar to those underlying NIRS/DOS, especially concerning light transport, and it shares advantages with NIRS/DOS such as non-invasiveness, deep tissue penetration (~1 cm), excellent time-resolution, and potential for continuous bedside monitoring. In contrast to NIRS/DOS, however, DCS provides a distinct and direct measure of CBF based on the statistical properties of the emerging light (Durduran et al., 2010a; Mesquita et al., 2011). Additionally, as we shall show, incorporation of traditional NIRS/DOS and DCS into the same instrumentation creates a new opportunity to make comprehensive all-optical measurements of cerebral hemodynamics and cerebral oxygen metabolism. Herein we will refer to these combination instruments as “hybrid diffuse optical technologies”. Hybrid DCS- NIRS/DOS technology was first introduced for cerebral monitoring in rats in 2001 (Cheung et al., 2001) and in adult brain in 2004 (Durduran, 2004; Durduran et al., 2004).
Compared to NIRS/DOS, DCS is a new methodology. DCS has been described in recent reviews which we encourage the reader to peruse (Choe and Durduran, 2012; Durduran et al., 2010a; Mesquita et al., 2011; Yu, 2012a,b; Yu et al., 2011), and it has been employed in a variety of clinical contexts besides brain, including cancer and peripheral arterial disease. In a relatively short time, DCS has been extensively validated in vivo (Mesquita et al., 2011). This validation research includes comparisons with laser Doppler flowmetry (LDF) in rat brain and muscle tissues (Durduran, 2004; Mesquita et al., 2010), with color Doppler ultrasound (CDU) and transcranial Doppler ultrasound (TCD) in mouse tumors and in infant and adult brain tissues (Buckley et al., 2009, 2008; Durduran, 2004; Menon et al., 2003; Roche-Labarbe et al., 2009; Yu et al., 2005; Zirak et al., 2010), with phase-encoded velocity mapping MRI in neonatal brain tissue (Buckley et al., 2012), with arterial-spin labeled MRI (ASL-MRI) in human muscle tissue during ischemia and in rat, neonatal and adult brain tissues (Carp et al., 2010; Durduran, 2004; Durduran et al., 2009a, 2004, 2010b, 2008b, 2007; Yu et al., 2007), with Xenon-CT in injured adult brain (Kim et al., 2008, 2010), with indocyanine green (ICG) tracers (Diop et al., 2011), and fluorescent microsphere CBF tracers (Durduran et al., 2008a; Zhou et al., 2009) in piglet brain tissue, and against clinical and pre-clinical expectations based on previous work with other technological measures of tissue physiology (Durduran et al., 2010a; Mesquita et al., 2011). Overall, these studies suggest that DCS quantitatively determines relative changes of tissue blood flow quite well with respect to a baseline. Furthermore, as noted above, hybrid instrumentation combining DCS with NIRS/DOS offers the possibility for continuous non-invasive estimation of cerebral metabolic rate of oxygen extraction (CMRO2) (Boas et al., 2011; Durduran et al., 2010a). Initial studies along these lines have been carried out in animal models and humans, again yielding changes in metabolic rate consistent with clinical expectations based on other measurement paradigms and clinical logic (Buckley, 2011; Buckley et al., 2013a; Durduran et al., 2004, 2010b; Lin et al., 2013; Roche-Labarbe et al., 2009; Roche-Labarbe et al., 2012, 2013; Verdecchia et al., 2013; Zirak et al., 2010).
Although it has been used primarily in the “monitoring” mode, three-dimensional image construction analogous to diffuse optical tomography (DOT) (Arridge and Schotland, 2009; Dehghani et al., 2009) is possible with DCS. In fact, diffuse correlation tomography (DCT) has been demonstrated experimentally in limited contexts, e.g., in tissue flow phantoms (Boas, 1996), in rat brain during spreading depression, and in ischemic stroke models (Culver et al., 2003; Zhou et al., 2006); in other investigations DCT theoretical formalism has been studied (Hyvönen et al., 2012; Nandakumaran et al., 2012; Varma et al., 2010, 2009; Zhou et al., 2006). Of course, the analogies to NIRS/DOS also extend to the limitations of NIRS/DOS; i.e., many of the algorithmic and instrumental issues, and the partial volume related systematic errors/corrections (Boas et al., 2001; Dehaes et al., 2011; Okada and Delpy, 2003a,b; Saager and Berger, 2005; Strangman et al., 2003; Tamura et al., 1997) endemic to NIRS/DOS also arise in DCS and DCT and must be carefully considered (Boas, 1996; Durduran, 2004; Gagnon et al., 2008; Irwin et al., 2011; Zhou, 2007).
Before concluding this overview section, we speculate about potential roles for DCS within the realm of current clinical medical diagnostics used to non-invasively access information about CBF in humans. Table 1, which we have adapted from a review by Wintermark et al (Wintermark et al., 2005), shows some of these techniques and their properties, along with those of DCS. Current imaging methods include 15O-H2O-PET scanning, SPECT (e.g. 99mTc-HMPAO), Xenon- and dynamic-CT, and arterial spin labeled (ASL) or dynamic contrast (DSC) bolus tracking perfusion MRI (Kofke, 2012; Wintermark et al., 2005; Zauner and Muizelaar, 1997). Each method has limitations and advantages. From the point of view of optics, perhaps the most relevant limitations associated with the “other” methods in Table 1 concern their potential for routine use at the bed-side, for use in emergency and ambulatory settings, and for use in large scale screening applications such as risk assessment for future strokes. In a different vein, PET, SPECT, and, the CT methods require exposure to ionizing radiation, and PET and SPECT require arterial blood sampling for quantification of CBF. These limitations, for example, can prevent application in populations such as newborn babies. The MRI methods have drawbacks as well; they cannot be used, for example, in patients with pacemakers, metal implants, or claustrophobia. Furthermore, generally all of the “other” diagnostics listed above are costly (approximately $1000 per measurement) and utilize major instrumentation that is rarely available continuously and often requires difficult patient transport. These issues limit their large scale uses; serial/longitudinal measurement with most of these techniques is difficult, and therefore they tend to be used once, or at most a few times, during patient’s hospitalization.
Table 1.
Table adapted from Wintermark et al (Wintermark et al., 2005) outlining the salient features of various mainstream non-invasive CBF measurement modalities. The final column is added to to the Table in order to place DCS in perspective.
| O15 PET | SPECT | XeCT | CT-P | DSC-MRI | ASL-MRI | Doppler Ultrasound | DCS | |
|---|---|---|---|---|---|---|---|---|
|
| ||||||||
| Age Range | A, C* | A, C | A, C | A, C | A, C | A, C, N† | A, C, N | A, C, N |
| Bedside | No | Sometimes | No | No | No | No | Yes | Yes |
| Contrast Agent | Yes | Yes | Yes | Yes | Yes | No | No | No |
| Radiation | Yes | Yes | Yes | Yes | No | No | No | No |
| Acq. Time | 5-9 min | 10-15 min | 10 min | 40 sec | 1 min | 5-10 min | 10-20 min | 0.5-6 sec |
| Parameters | CBF | CBF | CBF | MTT | MTT | CBF | BFV | CBF |
| Large Vessels | Ok | Ok | Ok | Problem | Problem | Ok | ONLY | microvascular |
| Quantitative | Yes | Sometimes | Yes | Yes | N/A | Yes‡ | N/A | relative * |
| Brain Coverage | Whole | Whole | 6cm thick | 5cm thick | Whole | Whole | ~ 3/hemisphere | ~ few/hemisphere |
| Spatial Resolution | ~ 5mm | ~ 5mm | ~ 5mm | ~ 1.5mm | ~ 2mm | ~ 2mm | N/A | ~ 10mm |
| Intrascan time | 10 min | 10 min | 20 min | 10 min | 25 min | 0 min | 0 min | 0 min |
| Emergency Setting | No | Sometimes | Yes | Yes | Yes | Yes | Yes | Yes |
| Instrument Cost | High | High | Moderate | Moderate | High | High | Low | Low |
The superscript
indicates problems when perfusion is low,
indicate measurement limitations when CBF < 10 ml/min/100g,
indicates that absolute measurements may be possible (see Section 4.2.4 of this review). The acronym MTT stands for mean-transit time, BFV for BF velocity, DSC-MRI for Dynamic Susceptibility weighed MRI, CT-P for Perfusion CT, A for adult, C for child and N for neonate.
Of the diagnostic modalities in Table 1, only one non-optical method is available for routine, non-invasive monitoring of cerebral hemodynamics at the bedside. This method is transcranial Doppler (TCD) ultrasound. TCD ultrasonography non-invasively measures blood flow velocities in major arteries supplying the brain and the circle of Willis. Measurements are made through bone “windows” in the temporal and sub-occipital regions so that identification of the specific artery to be insonated is critical. More recently transcranial color-coded duplex (TCCS) ultrasonography has enabled direct visualization of the basal cerebral arteries, which provide improved localization compared to the conventional “blind” technique which relied on estimates of the depth and location of the artery. Unfortunately, in some patients many arteries cannot be insonated, and, generally, only proximal portions of intracranial arteries can be insonated. Thus these measurements do not reflect local, micro-vascular CBF. Finally, TCD “macro-vasculature” estimates of perfusion from velocity measurements in the cerebral arteries can be problematic, e.g., if the diameter of the artery is not measured precisely.
Thus, a niche exists for the CBF measurement capabilities offered by DCS. In the remainder of this paper, we review DCS applications in brain with an emphasis on underlying physical ideas, common instrumentation and recent validation studies. Then we describe representative, recent clinical research that employs DCS-measured cerebral blood flow as a biomarker of patient well-being, and as an indicator of hemodynamic and metabolic response to functional stimuli. We conclude with a brief discussion about the future for the technology.
2. The physical basis of diffuse correlation spectroscopy
The diffuse correlation spectroscopy technique is a variant of a traditional correlation method called dynamic light scattering (DLS) (Berne and Pecora, 1990; Brown, 1993; Chu, 1991) applied to multiple-scattering media such as tissues. In practice, the temporal fluctuations of the speckle or light electric field, E(r, t), emerging from tissue, at time t and position r, are recorded in order to learn about the motions of sample constituents such as red blood cells (Figure 1). Usually the electric field temporal autocorrelation function is measured and analyzed to derive information about particle motion. In the “single-scattering” version of the measurement (DLS), the autocorrelation function will decay by a factor of 1/e when the scattering particles have moved, on average, by a distance of the order of the wavelength of light (λ). In the multiple-scattering experiment (i.e., DCS), the collected light field is composed of waves which have traveled along a variety of trajectories through the sample as a result of many single-scattering events; if these single-scattering events are independent and their number large, then the DCS autocorrelation function will decay by a factor of 1/e when the typical scattering particle has moved, on average, by a distance of order the wavelength of light divided by the square-root of the number of single-scattering events in the typical photon trajectory. Thus both methods are sensitive to the average motions of scattering particles in the sample, though the decay time-scales and the motional length-scales probed are much smaller in the turbid samples which multiply scatter light. The interested reader should consult more quantitative reviews and papers (Boas et al., 1995; Boas and Yodh, 1997; Durduran et al., 2010a; Mesquita et al., 2011) for more details about DCS, and, its precursor, diffusing wave spectroscopy (DWS) (Maret and Wolf, 1987; Pine et al., 1988; Stephen, 1988).
Figure 1.
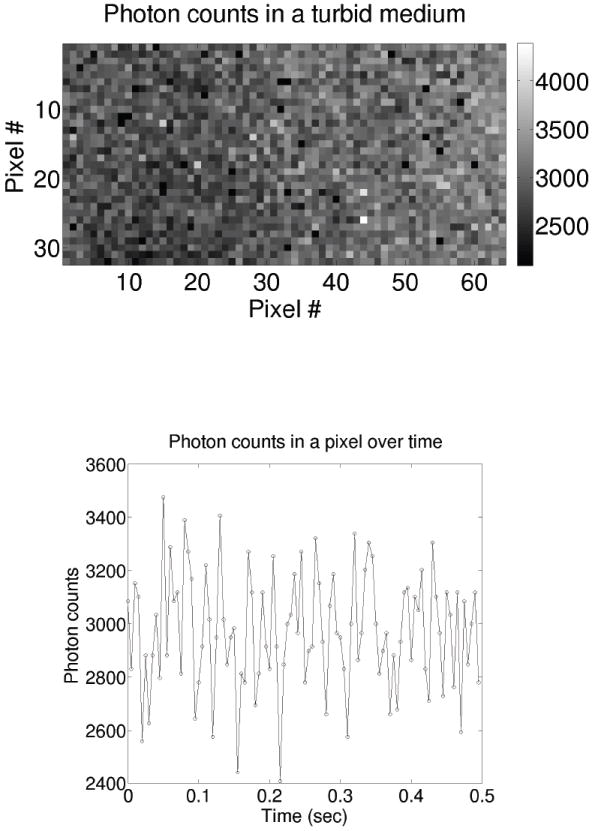
(Top) A 2D photon-counting camera image showing the spatial variation of the speckles formed due to light emerging from a turbid fluid of “randomly moving” particle-like scatterers. Note, to obtain this image, a point source was placed to the left of the image (outside of the field-of-view), and the speckles are visible despite the apparent decreasing intensity across the image. (Bottom) The time evolution (~ 500μsec exposure/step) of a single pixel (e.g., single speckle) showing the temporal fluctuations of the speckle intensity due to the motion of scatterers in the fluid. The 2D photon-counting camera used here was kindly provided by Alberto Tosi and Franco Zappa of Politecnico di Milano (POLIMI), Italy.
Arguably the most important enabling physical effect that makes cerebral blood flow measurement possible is the fact that the temporal electric field autocorrelation function, 〈E*(r, t) · E(t+τ)〉, diffuses through tissue in a manner that is similar to light fluence rate, i.e., transport of 〈E*(r, t) · E(r, t+τ)〉 is governed by a diffusion equation. Thus, many tissue optical properties that affect transport of NIR light fluence rate (or diffusive waves), such as tissue absorption (μa) and tissue reduced scattering coefficient ( ), are the same for “diffusing” temporal autocorrelation. In fact, the primary difference between the spatio-temporal evolution of temporal correlation compared to fluence rate is an additional absorption term that is dependent on the dynamics of the scatterers in the so-called correlation diffusion equation (Ackerson et al., 1992; Boas et al., 1995; Boas and Yodh, 1997; Dougherty et al., 1994) that governs correlation transport, i.e.,
| (1) |
Here τ is the correlation time, ko is the wave-number of the light in the sample, α is the ratio of moving scatterers to the total number of scatterers in the sample, or, equivalently, the fraction of photon scattering events from moving scatterers such as red blood cells in the tissue, is the photon diffusion coefficient. G1(r, τ) = 〈E*(r, t) · E(r, t+τ)〉/〈|E(r, t)|2〉 is the temporal field auto-correlation function. 〈Δr2(τ)〉 is the mean-square displacement of these moving red blood cells in time τ. The brackets 〈〉 denote time averages (for experiments) or ensemble averages (for calculations). The solutions of this equation for correlation transport are formally identical to those for the light fluence rate (Durduran et al., 2010a). The solutions can be simply obtained in standard geometries (e.g., infinite, semi-infinite, layered etc.), and the formulation of the inverse problem for diffusing correlation is quite similar to that of the diffusing light fluence rate.
In most DCS experiments in living tissues, the mean-square particle displacement has been found to be reasonably well approximated as an “effective” Brownian motion, i.e., 〈Δr2(τ)〉 = 6DBτ where DB represents the effective diffusion coefficient of the moving scatterers (which is much larger than the equilibrium Einstein result for particles of the same size) (Durduran et al., 2010a). In order to estimate relative blood flow from DCS data, we fit the measured intensity autocorrelation functions to solutions of Equation 1. The best-fit defines a tissue blood flow index (BFI) from the data. Relative changes in BFI (i.e., rBFI) at time t are defined as rBFI(t) = BFI(t)/BFI(to), where t0 denotes a time during the baseline period. Percent changes in BFI (i.e., ΔBFI) are sometimes defined with respect to zero, i.e., ΔBFI(%) = (rBFI − 1)×100. Importantly, this information about tissue blood flow is derived in a qualitatively different way than NIRS/DOS, i.e., compared to the approximate schemes for flow determination used in NIRS/DOS. The detected and processed signal has a component that is directly related to the motion of the scatterers at spatial and temporal scales corresponding to that of the red-blood cells.
In practice, light intensity is easier to measure than light electric field. The measured normalized intensity auto-correlation function, g2(τ) ≡ 〈I(t)I(t+τ)〉/〈I(t)〉2, is related to the normalized electric field correlation function, g1(τ) = 〈E*(t) · E(t + τ)〉/〈|E(t)|2〉, by the Siegert relation (g2(τ) = 1 + β|g1(τ)|2) (Lemieux and Durian, 1999). (Note, herein we will omit the spatial parameter, r, in the arguments of the field and intensity variables.) The intensity, I(t) ~ |E(t)|2 and β is a constant determined primarily by the collection optics of the experiment, and is equal to one for an ideal experiment setup 2. Furthermore, unlike “traditional” NIRS/DOS, since the normalized intensity auto-correlation function is utilized, it is not necessary to calibrate for differences in the light injection and collection efficiency at different positions on the tissue. However, the statistical properties of the laser itself are important, i.e., they can alter the measured auto-correlations when/if the laser coherence length is too short.
Best-fit DCS data is obtained by comparing the so-determined field autocorrelation function to analytical or numerical solutions of Equation 1. Since the photon diffusion model for correlation transport in DCS depends on the tissue absorption coefficient, μa, and reduced scattering coefficient, , DCS analysis (in practice) either assumes the tissue medium to be homogeneous with optical properties taken from the literature, or it derives these optical properties from concurrent NIRS/DOS measurements (Irwin et al., 2011). A few publications, which are cited in the references of recent review papers (Durduran et al., 2010a; Mesquita et al., 2011), employ hybrid instrumentation that combine DCS with NIRS/DOS. The concurrent use of NIRS/DOS, in particular, introduces the capability to improve DCS data fidelity via measurement and incorporation of more accurate (and possibly changing) tissue scattering and absorption coefficients. Of course, more complex models (e.g., multi-layer, tomographic, etc.) can also be usefully employed to analyze DCS (and NIRS/DOS) data (Durduran, 2004; Durduran et al., 2004; Gagnon et al., 2008; Jaillon et al., 2006; Li et al., 2005).
In brain studies, the combination of NIRS/DOS and DCS permits estimation of cerebral blood flow (CBF=BFI), oxygen extraction fraction (OEF), and the cerebral metabolic rate of oxygen extraction (CMRO2) based on combined data from NIRS/DOS and DCS (Durduran et al., 2010a). This novel capability is important because it enables researchers to link the supply side of the metabolic problem, i.e., blood flow and hemoglobin oxygenation, with oxygen extraction fraction and demand. Later in this review we will give examples of such CMRO2 measurements. Briefly, the CMRO2 calculation depends on oxygen extraction fraction, which can be estimated from the difference in oxygen saturation between arterial and venous components of the vasculature, and cerebral blood flow, which can be estimated from DCS data. A fairly reasonable set of assumptions about compartmentalization of blood, the relative contributions of each compartment to the NIRS/DOS signal, and compartmentalization constancy over time yield the following equation for the change in cerebral metabolic rate of oxygen from a baseline condition:
| (2) |
Here StO2 = HbO2/(THC) is the microvascular tissue blood oxygen saturation, HbO2 is the tissue oxy-hemoglobin concentration, THC is the total hemoglobin concentration in the tissue (i.e., THC =HbO2 +Hb, where Hb is the deoxy-hemoglobin concentration); all of these parameters are measurable by NIRS/DOS. SaO2 is the arterial blood oxygen saturation which can be estimated by pulse-oximetry or by blood gas sampling. The sub-script “bl” (bl) is used to indicate baseline values of a parameter. Baseline StO2 (StO2bl) is ideally measured, but it can be and is often estimated from the literature values. γ is an empirical parameter that denotes the percentage of blood in the venous compartment; as noted above we assume it remains constant over time and, therefore, it divides out of our measures of the relative change in OEF (rOEF). Thus, relative changes in CMRO2 (rCMRO2) can be directly calculated from optical measurements of rOEF (i.e., StO2 and SaO2) and rCBF.
Note that under certain assumptions, γ can be estimated by optical methods such as spiroximety wherein the venous oxygen saturation and blood volume can LAO be derived (Brown et al., 2006). If this scheme is further combined with NIRS/DOS, providing absolute measurements of blood oxygenation, and with calibrated DCS measurements of CBF (e.g., see Section 4.2.4, then absolute measurements of CMRO2 may be possible in the future.
3. Instrumentation
Modern DCS instrumentation shares the basic components of early, benchtop DWS systems (Kaplan, 1993; Pine et al., 1990; Weitz and Pine, 1993). The primary focus of current experimenters working in the clinic is on instrumental miniaturization, portability, parallelization, robustness/ruggedness, and low cost. Herein a representative system is described; it shares many common components with most of the instruments employed to date in published work.
Figure 2 shows a clinical system recently constructed at the ICFO-Institute of Photonic Sciences in Barcelona, Spain. The system employs continuous-wave (CW) lasers in the NIR. Like most current instrumentation, the ICFO device utilizes narrow-bandwidth lasers operating at ~785nm, due to their widespread availability. One important criteria for laser choice is that its coherence length should be longer than the spread of the pathlength distribution of the photon trajectories through tissue. The pathlength distribution varies with source-detector separation and tissue optical properties, but a very safe choice for most tissue experiments would utilize lasers with a coherence length of approximately ten meters.
Figure 2.
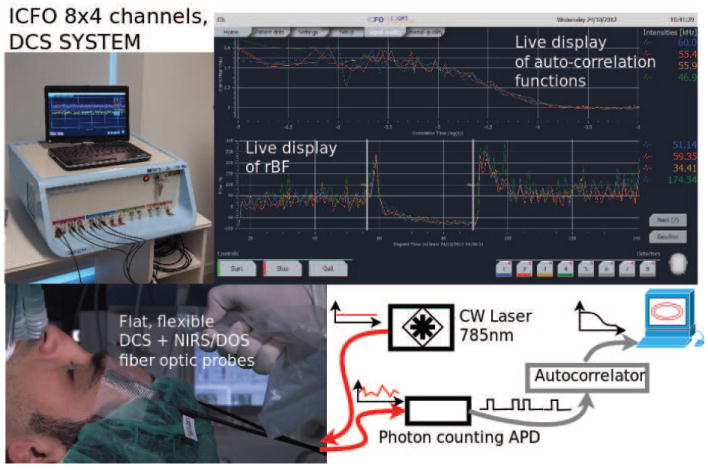
Top left) A modern, portable, clinical DCS system built at the ICFO-Institute of Photonic Sciences in Barcelona, Spain. The light sources and detectors are interfaced to the probes via fiber-optics. (Top right) The graphical user-interface is on a touch screen. Important features in most DCS systems ensure that the autocorrelation functions can be displayed in real-time, and the resultant blood flow index (BFI) is derived and plotted in real-time. (Bottom left) illustrates the elements of a measurement in the surgical unit. Thin probes using 45° cut fiber tips to allow side-firing/collection of the fibers are placed into a probe-pad on the subject’s forehead. Note, here we describe only the DCS component, but in practice the fiber probes also contain fiber optics for NIRS/DOS. (Bottom right) shows a block diagram of the representative instrument. “Red” curves illustrate CW light injection and detection of the intensity fluctuations. “Black” curves indicate digital signals.
Light is typically delivered to tissue via a multi-mode fiber; in this case a small amount of dispersion is traded off with increased light transmission. Also, for the sake of keeping the light levels at the illumination spot below the maximum permissible exposures (MPE), source fibers with diameters of ~1 mm are often utilized.
The detected light on the surface of the head might be located as far as ~2.5-3 cm away from the source, i.e., as measured along the tissue surface. Detected light is quite often collected by a single-mode fiber (i.e., a single speckle is collected) in order to optimize signal-to-noise ratio (SNR). For unpolarized detected light, the β in Siegert relation is ~0.5 (see Section 2 above). Some experimenters have chosen, on the other hand, to utilize fewmode fibers for detection (He et al., 2013; Li et al., 2005). In this case, more light is collected at the expense of reduced β; this approach reduces the effects of non-optical noise, but the signal-to-background is reduced in a proportional manner. Finally, some experimenters are using multiple single-mode fibers (bundled) at a single detector position in order to collect more data channels in parallel; this detection approach trades off improved signal-to-noise with instrument cost (Dietsche et al., 2007). We will provide an illustrative example of the utility of this latter detection approach in a later section.
Light detection is done by fast photon counting detectors. Photomultipliers can be used for this purpose, but more often single-photon counting avalanche photo-diodes (SPADs) are employed (e.g., SPCM-AQR(H) series, Excelitas, Canada). The electrical output of the detector is converted into a TTL pulse for each detected photon. These TTL pulses that mark photon arrival times are fed to a digital autocorrelator board (e.g., Flex series, correlator.com, Bridgewater, NJ). The autocorrelator board is a piece of hardware that keeps track of the temporal separation between all pairs of photons and uses this information to calculate the light intensity temporal autocorrelation functions. The data storage and calculation is typically accomplished entirely with digital electronic circuits (i.e., in hardware). For most purposes a so-called “multi-tau” delay-time scheme is employed for the temporal autocorrelation function; this scheme enables the DCS data to span many decades of delay times, while keeping an optimal signal-to-noise ratio in each bin (Schätzel, 1987; Zhou et al., 2006).
The output of the autocorrelator board is the desired DCS intensity autocorrelation function. This intensity autocorrelation function is converted to an electric field correlation function using the Siegert relation (typically with β as a fitting parameter). The resulting field correlation function is then fit to a blood cell motion model, based on the correlation diffusion equation, in order to derive the blood flow index as described in Section 2 above.
DCS probes are similar, in many respects, to those employed in NIRS/DOS instruments. They consist of straight or 90° bent fibers or side-firing fibers that are placed into flexible, light-sealed pads attached to the head by straps and/or using various medical adhesives. A current limitation of DCS is its need for single-mode or few-mode fibers; in this case the light detectors are relatively small, e.g., 6.5 μm diameter detection areas. In addition, light collection via the fibers is sensitive to the presence of hair. Currently, the demonstrated ways to tackle the hair problem are either via use of many fibers in a single spot (Dietsche et al., 2007) or via tedious one-by-one placement of fibers on the head. Clearly, resolution of this issue represents an important future research arena. However, as our examples below will suggest, even probes placed on the forehead provide promising clinical information.
In practice, hybrid DCS-NIRS/DOS instrumentation is relatively common; in general the two technologies are time- and/or space-multiplexed. The most common schemes utilize different sets of sources and detectors, and also turn the light sources on/off in sequence so that tissue is illuminated for either DCS or NIRS/DOS at any given time. The detection can be done in parallel from all sites, but care must be taken to ensure that the photons from the light source of one modality do not saturate the detectors of the other modality. In addition, simultaneous acquisition of continuous-wave (CW) NIRS/DOS data has been demonstrated using the DCS laser (with additional CW wavelengths as needed) and detectors (Shang et al., 2009; Yodh et al., 2011). This latter method enables the experimenter to employ more compact instrumentation, but the NIRS/DOS data suffers to some degree from the low light levels detected by the single-mode DCS fibers. All of these approaches enable researchers to co-register the two methods without cross-talk.
4. Cerebral blood flow measurements: selected examples
4.1. Functional diffuse correlation spectroscopy (fDCS)
The first DCS measurements of cerebral blood flow in human brain (i.e., non-invasively, through intact skull) observed focal variations of CBF during motor stimuli (Durduran, 2004; Durduran et al., 2004; Li et al., 2005). In essence, these experiments were the first examples of functional diffuse correlation spectroscopy or fDCS. Herein we follow notational conventions from the MRI literature which employ the lower case “f” to indicate hemodynamic response to neuronal stimuli, i.e., measurable signals due to the neuro-vascular coupling.
Figure 3 shows a collage of four different fDCS results from early studies at the University of Pennsylvania (UPENN). The optical probe was placed at different locations on the head for each study. All results shown represent averages of multiple trials of repeated stimuli. We encourage interested readers to check the original papers for details about error bars, etc.
Figure 3.
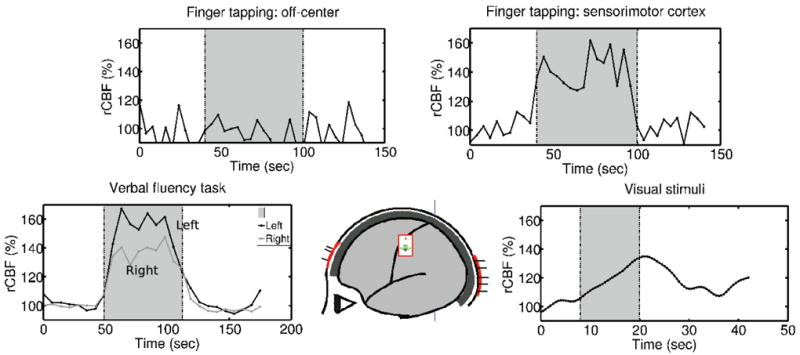
Collection of fDCS results from UPENN showing rCBF in response to; (top, left) contralateral finger tapping when the probe is placed away from the sensorimotor cortex, (top right) contralateral finger tapping with the probe placed on the sensorimotor cortex, (bottom left) verbal fluency tasks (bi-lateral), (bottom right) visual stimuli (alternating checkerboard pattern). The shaded area indicates the stimulation period.
For the sensorimotor stimuli due to finger-tapping (Durduran et al., 2004), the probe is placed on the side of the head over the sensorimotor cortex; in this case, robust CBF changes are observed in response to the stimuli. Notice, for the same finger tapping stimuli, but with the probe placed approximately 1 cm away from its optimal position over the sensorimotor cortex, the CBF signals did not correlate with the stimuli. This observation confirms the local and cerebral nature of the observed response.
For visual stimuli that consisted of alternating checkerboard patterns, the probe is placed at the back of the head over the visual cortex; in this case, a robust CBF response was again observed 3.
For the verbal fluence stimulation tasks (i.e., word generation based on a letter shown on the screen), two probes are placed over the frontal poles of each hemisphere and a robust bilateral CBF variation was found (Durduran et al., 2006). In all cases, CBF, as measured by the DCS blood flow index is found to increase in response to stimulation.
In a recent study (Tellis et al., 2011), fDCS was utilized to assess the differences in hemodynamics in brain areas associated with speech production in persons who stutter versus persons who are normally fluent speakers. The subject responses were investigated during different tasks such as singing and counting. The initial results suggest that fDCS may indeed have potential applications for this type of clinical (and fundamental) neuroscience application.
The fDCS results outlined in Figure 3, and others that we will not describe (Dietsche et al., 2007; Jaillon et al., 2007; Li et al., 2008), suggest that fDCS can be developed for neuroscience in a fashion analogous to fNIRS. In fact, since both techniques rely on transport of NIR light through the scalp and skull, many of the uncertainties that arise in fNIRS must also be dealt with in fDCS. For example, both methods must account for partial volume contributions to the signal that arise because of the layered structure of the head, and both methods must ferret out extra-cerebral vasculature signals from “deep” brain cerebral signals (Durduran, 2004; Gagnon et al., 2008; Jaillon et al., 2006), albeit in some what different ways. More research is necessary to clarify these effects and develop solutions, but, looking forward, fDCS will definitely benefit from the vast experience of the fNIRS community.
Before turning to discuss clinical work and metabolic studies, we highlight some recent technical progress (Dietsche et al., 2007) that addresses a key measurement issue that differentiates fDCS from fNIRS. Measurement signal-to-noise and depth of penetration are two interrelated and important experimental parameters that affect the utility of both fDCS and fNIRS. Generally, the depth of penetration of the NIR light is set by the source-detector separation on the tissue surface. Thus, if one wants to bias fNIRS and fDCS signals to cerebral tissues, then the source and detector positions on the head surface should be set far apart (i.e., >2-5 cm). On the other hand, as the source-detector separation gets larger, the detected light signals get smaller. Thus the size of the signal depends on the fractional change in CBF or HbO2/Hb concentration to neuronal stimuli, as well as on the relative size of the cerebral and extra-cerebral signals. For typical functional events, the fractional change in CBF is larger than HbO2/Hb concentration; e.g., Durduran et al (Durduran et al., 2004) observed ~ 2% changes in hemoglobin concentration and ~ 40% changes in CBF during the same stimulation.
Unfortunately, the requirement of single-speckle detection in DCS costs photons and hence depth of penetration. To date, with a single-mode detection fiber and a single multi-mode source fiber on the adult human head, the largest source-detector separation that has been employed for DCS is ~3 cm; on the other hand the largest separations employed by NIRS has extended to >5 cm, because large area detection fibers or fiber bundles can be employed in NIRS/DOS. To address this issue, Dietsche et al have recently (Dietsche et al., 2007) proposed and implemented a multi-speckle scheme for DCS detection which substantially improved DCS signal-to-noise. In their set-up they employed parallelized detection, i.e., utilizing up to N = 28 singlemode fibers and corresponding detection channels. Thus, DCS measurement signal-to-noise increased by ~ . The resulting improvements in SNR are illustrated in Figure 4. In subsequent work these authors demonstrated measurement of < 2% changes in CBF due to functional stimuli (Jaillon et al., 2007). In the future, we anticipate that this type of parallelization approach will increasingly be used, and as fDCS capabilities become more apparent, we also anticipate that the community will benefit from manufacturing economies of scale for single-photon counting detector arrays and other technical advances.
Figure 4.
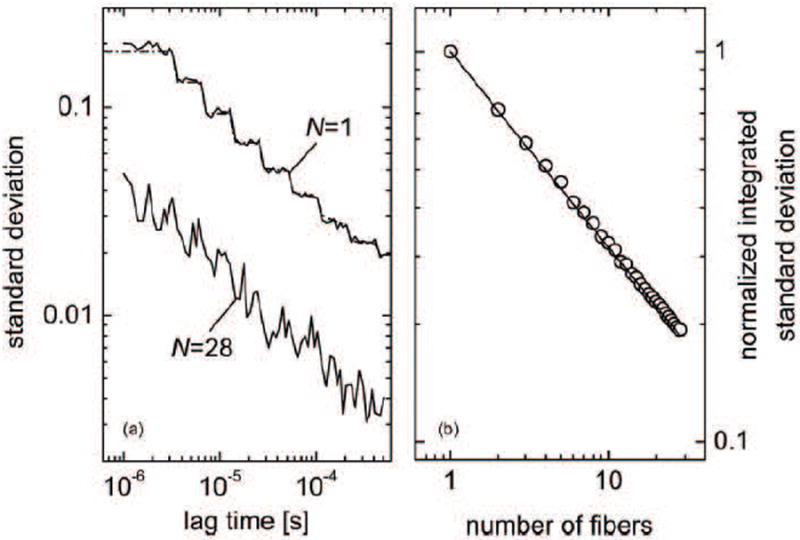
The effect of averaging N independent speckles by using N single-mode fibers and N detectors. (Left) The noise predictions from the theory and the experimental results for a single detector compared to N = 28 detectors. (Right) The scaling of the normalized integrated standard deviation as . (Dietsche et al., 2007)
To conclude this sub-section we note that, presently, functional studies with DCS in human brain have begun, but progress can best be described as in the early part of the exponential growth curve. Herein, we comprehensively review all published (and some unpublished) results in the fDCS subfield. More progress can be expected as various technical problems are ameliorated or solved, for example, issues ranging from improvements in signal-to-noise, concomitant gains in temporal resolution and depth penetration, absolute calibration, improvements per the probe-scalp interface, identification of socalled killer applications, etc. Work along these lines is underway in several laboratories worldwide.
4.2. Diffuse correlation spectroscopy as a neuro-monitor of the cerebral well-being
In Section 1, we argued that cerebral blood flow is an important biomarker of cerebral pathophysiology. Indeed, since the initial demonstrations of its capability for measuring human CBF in vivo, DCS has been employed in a wide variety of clinical contexts for CBF monitoring, for example: to measure the impairment of cerebrovascular reactivity and autoregulation in ischemic stroke (adult) patients (Durduran et al., 2009b); to estimate autoregulation and CBF responses in adult patients with traumatic brain injury and sub-arachnoid hemorrhage (Kim et al., 2010); to assess microvascular CBF (Buckley et al., 2009; Roche-Labarbe et al., 2009), the development of CMRO2 (Lin et al., 2013; Roche-Labarbe et al., 2009; Roche-Labarbe et al., 2012) and somatosensory evoked changes in CMRO2 (Roche-Labarbe et al., 2013) in premature born infants; to assess cerebrovascular reactivity (Durduran et al., 2010b), the response to sodium bicarbonate treatment (Buckley et al., 2013b), and early postoperative changes after cardiac surgery (Buckley et al., 2013a) in neonates and children born with severe congenital heart defects (CHD); to assess cerebrovascular reactivity in response to pharmacologically-induced vasodilation in healthy adults (Zirak et al., 2010) and in patients suffering from carotid artery stenosis and/or occlusion (Zirak et al., 2013); to monitor adult patients undergoing carotidendarterectomy (CEA) (Shang et al., 2011b); to assess hemodynamic responses of adults to low-frequency repetitive transcranial magnetic stimulation (Mesquita et al., 2013); to determine healthy hemodynamic responses to orthostatic challenges and study response variation with age (Edlow et al., 2010). Overall these studies have shown the technique’s versatility, and they have demonstrated that the method provides new and complementary information about the patient pathophysiology in a non-invasive fashion. Though not explicitly noted, many of the studies described above also validated DCS in the same patient populations against other medical diagnostic techniques(Mesquita et al., 2011).
In addition to investigation of human brain, extensive studies in animal models have been carried out with DCS in mice (Shang et al., 2011a), rats (Carp et al., 2010; Cheung et al., 2001; Culver et al., 2003; Durduran, 2004; Zhou et al., 2006), piglets (Diop et al., 2011; Durduran et al., 2008a; Verdecchia et al., 2013; Zhou et al., 2009) and pigs (Baker et al., 2013). Overall, these animal studies have derived fundamental knowledge about the DCS technique and its practice, have added to the list of in vivo brain validation examples of DCS, have demonstrated three-dimensional tomographic flow imaging (i.e., DCT), and have developed and tested compound indices such as CMRO2 derived from DCS and NIRS/DOS hybrid instrument measurements of animal brain. We leave further discussion of the animal studies to a future review.
The remainder of this section will present representative in vivo examples of clinical brain research with DCS in humans. The work of multiple groups helps highlight the latest advances with an emphasis on recent results. We invite readers to study primary papers for more detail and to study recent reviews for details about earlier work that is cited but not discussed (Durduran et al., 2010a; Mesquita et al., 2011).
4.2.1. Risk assessment in patients with steno-occlusive lesions of the internal carotid artery
Severe stenosis or occlusion of the internal-carotid-artery (ICA) is known to increase the risk of ischemic stroke (IS) (Barnett et al., 1998). As such, several physiological parameters have been investigated as predictors of this risk, e.g., degree of ICA stenosis and compromised hemodynamic behavior (Caplan and Hennerici, 1998; Gibbs et al., 1984; Kistler et al., 1984; Webster et al., 1995). Hemodynamic compromise can be identified from the local OEF or impaired cerebrovascular reactivity (CVR) of at-risk brain tissues (Derdeyn et al., 1999). Ideally, one would like to measure these parameters non-invasively, in large populations (for screening), and in at-risk patients who are otherwise leading normal lives. If a high risk patient is identified, then it may be possible to carry out additional (potentially life-saving) interventions such as a surgical operation to remove the stenosis.
Two recent studies on healthy (Zirak et al., 2010) and compromised (Zirak et al., 2013) subjects have begun to address these questions by measuring local tissue hemodynamics with DCS and NIRS/DOS. In these investigations, acetazolamide (ACZ) is introduced transiently to probe tissue cerebrovascular reactivity (CVR). CVR is determined at the macrovascular level by measuring blood flow velocity in the middle cerebral artery by transcranial Doppler Ultrasound (TCD) in two hemispheres; herein, we will refer to this resulting TCD-measured macroscopic index as cerebral blood flow velocity (CBFV). Concurrently, local micro-vascular CBF is probed by DCS and the hemoglobin concentrations by NIRS/DOS. In healthy subjects, macro-and micro-vascular ACZ-induced responses are global, i.e., the responses are the same in both hemispheres and are expected to be equal in amplitude (Zirak et al., 2010). By contrast, in patients with different levels of stenosis or occlusion, the ACZ-induced tissue CVR responses are highly heterogeneous (Zirak et al., 2013). Thus macro-and micro-vascular responses can be different and can depend on the hemisphere probed.
Figure 5 illustrates some initial results from these studies. The top panel shows results from a healthy control population. The averaged (i.e., over subjects and hemispheres) ACZ-induced macro-vascular CBFV, measured in middle-cerebral arteries by TCD, and micro-vascular CBF, measured in the frontal poles by DCS, demonstrate that typical CVR does not depend on the hemisphere probed; further, relatively low intra-subject differences are exhibited by the macro/micro signal amplitudes (i.e., as indicated by the error-bars). We note, however, that significant absolute variation of CBF in response to ACZ were found across the subject pool (Zirak et al., 2010).
Figure 5.
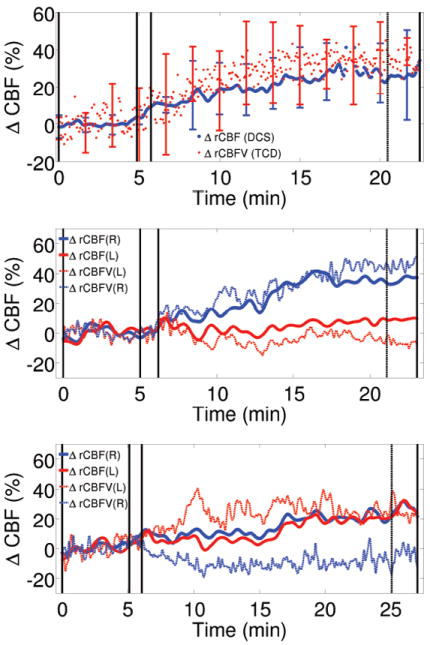
DCS vs TCD measures of cerebrovascular reactivity (CVR) using acetazolamide (ACZ). (Top) The averaged (over subjects and hemispheres) ACZ-induced macro-vascular CBFV (measured in middle-cerebral arteries by TCD) and micro-vascular CBF (measured in frontal poles by DCS) in the healthy control subject population. (Center) Signals from a 58 year old patient with occlusion of the left internal carotid artery (ICA) who had a transient ischemic attack of the left ICA two years prior to the measurement. Monitoring shows impairment of CVR in the left hemisphere. Both TCD and DCS exhibit similar results. (Bottom) Signals from a 63 year old patient with left ICA occlusion and who had a right MCA stroke 6 months prior to the measurement. Despite the occlusion, the micro-vascular CVR (i.e., measured by DCS) is preserved, while the macro-vascular CVR is impaired on the right hemisphere. In all panels, the first set of solid vertical bars indicate the time period within which ACZ was injected. The last two vertical bars indicate the time period used for CVR quantification.
The middle and bottom panels show two different kinds of responses that were observed in the patient population. The middle panel is derived from measurements on a 58 year old patient who presented with an occlusion of the left internal carotid artery (ICA). Two years prior to the measurement, this patient had a transient ischemic attack via the left ICA. The flow traces exhibit an impairment of CVR in the left hemisphere, an effect which is found by both TCD and DCS. This patient is, presumably, at a high risk for further tissue damage due to the impairment. The bottom panel shows the results of a 63 year old patient with left ICA occlusion. Six months prior to the measurement, this patient had a right MCA stroke. Interestingly, despite the occlusion and by contrast to the patient response shown in the middle panel, the micro-vascular CVR measured by DCS is preserved with both hemispheres responding similarly; by contrast macro-vascular CVR measured by TCD is impaired in the right hemisphere. These differences in macro/micro CVR are suggestive of a functioning collateral circulation; collateral circulation is known to show adaptive changes in patients with these conditions. Thus, the 63 year old patient may actually be at relatively low risk for further tissue damage than would be suggested by TCD. The two patient results are representative of the whole cohort wherein different categories of response are clearly identified. Collectively, the work demonstrates feasibility and potential of the hybrid diffuse optical techniques for screening and/or risk assessment of subjects who could be referred for further diagnostic tests or surgery. The results also suggest the value of measuring both micro- and macro-vascular responses.
4.2.2. On-line monitoring of cerebral ischemia during carotid endarterectomy
Another potential application area for non-invasive optical CBF measurements is during surgery wherein cerebral tissue may be at the risk of ischemia (Ghosh et al., 2012). For example, carotid endarterectomy (CEA), which may be performed as a preventative measure on patients with carotid stenosis or occlusion (see Section 4.2.1), is known to lead to an increased risk of stroke because of possible surgery related complications. One such complication is ischemia due to the clamping of the artery. In principle, some surgical strategies such as induced hypertension can be utilized to minimize cerebral ischemia, but typically all of these strategies hold some significant risk. Therefore, it is desirable to monitor brain health during surgery, and quite often electroencephalography (EEG) and/or TCD and/or somatosensory evoked potentials are utilized for this purpose.
Since the clinicians in this context are interested in online monitoring of cerebral ischemia (and hypoxia), DCS and NIRS/DOS are attractive tools because they offer direct access to CBF variation and possible tissue injury. To this end, researchers at the University of Kentucky recently carried out an investigation with a long-range hypothesis that DCS can provide useful information for early and accurate detection of cerebral ischemia during surgery, and their initial feasibility studies indeed suggest the tools hold potential to improve acute interventions during carotid endarterectomy.
Figure 6 (Shang et al., 2011b) shows a measurement from one subject from the study undergoing CEA. The subject is probed on the frontal lobes of the ipsilateral and contralateral hemispheres during the surgery (Shang et al., 2011b). Cerebral hemodynamics were thus monitored and were compared with EEG findings during internal carotid artery (ICA) clamping. When the ICA was clamped, rCBF on the ipsilateral side decreased rapidly, and, not surprisingly, total hemoglobin concentration exhibited a related decrease. After a few minutes, the local ipsilateral hemodynamic parameters began to recover, though they did not reach baseline levels. Interestingly, the contralateral side showed an initial increase in CBF followed by a sustained and significant decrease. This latter effect was suggested in the paper to be to a compensatory mechanism wherein blood was redirected (“steal”) to the ipsilateral side of the brain to compensate for the ischemic condition. Upon release of the clamp, a reactive hyperaemia was observed. Overall, the research demonstrated that ICA clamping induced significant decreases in CBF and an increased deoxygenation of the cerebral tissue. Taken together these effects are suggestive of ischemia.
Figure 6.
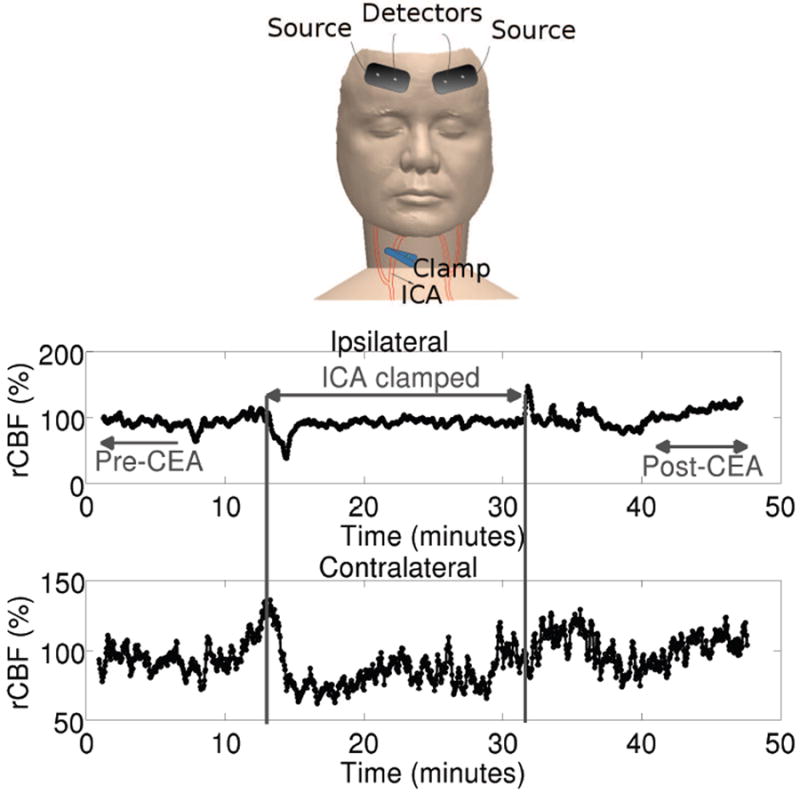
Cerebral hemodynamic changes during carotid endarterectomy (CEA) measured by DCS and NIRS/DOS were measured using bilateral probes as shown in the Tio panel. EEG probes (not shown) were placed in standard locations. (Middle) rCBF derived from the cerebral hemisphere ipsilateral to the clamped artery (ICA). (Bottom) rCBF derived from the cerebral hemisphere contralateral to the clamped artery. Courtesy of Guoqiang Yu, U. Kentucky.
For comparison, the reduction in EEG alpha-band (~8-15 Hz) power spectra was used to quantify cerebral hypoperfusion during clamping in the same patient group. According to the EEG criterion, only five out of twelve patients demonstrated hypoperfusion during the first 30-second of clamping. Compared to EEG responses, rCBF signals measured by DCS were faster (Figure 6a in Ref (Shang et al., 2011b)), showed larger decreases in amplitude(Figure 6b in Ref (Shang et al., 2011b)) and were able to detect cerebral hypoperfusion earlier than EEG, i.e. they reached their minimal values earlier (Figure 6c in Ref (Shang et al., 2011b)). Clearly, the study suggests that further work with the optical method is warranted.
It is also worth pointing out that the EEG changes (which are the current standard of care) were identified in off-line data analysis. The technician sitting in the surgical room could not discern any significant changes in EEG in any of the patients during clamping 4. Therefore, no interventions were made for any of these patients. By contrast, the cerebral hypoperfusion detected by rCBF (e.g., negative CBF versus time slopes) were observed in all twelve patients in real-time.
4.2.3. Orthostatic stress and acute ischemic stroke
As we have argued earlier, diffuse optics holds promise for longitudinal, bed-side monitoring of cerebral hemodynamics. A pioneering study along these lines (Durduran et al., 2009b) applied hybrid NIRS/DOS and DCS instrumentation in measurements of critically-ill acute ischemic stroke patients. In order to demonstrate sensitivity to patient condition, orthostatic stress was induced by changing the head-of-bed (HOB) positioning of the patient. It was hypothesized that this challenge would induce differential changes in the infarcted hemisphere (“peri-infarct”) as compared to the presumably healthy (“contralateral”) hemisphere.
A control population with vascular risk factors, and of matching age, was also studied; the results of this study of healthy subjects suggest that lowering of the HOB angle induced CBF to increase by a relatively small amount in a global manner, i.e., by the same in both hemispheres. In a follow-up study, we have further demonstrated that these findings hold over a wide-range of ages in subjects with no reported cardio-vascular or cerebral problems (Edlow et al., 2010). In all cases, maximal rCBF was observed at the lowest HOB position.
Figure 7 shows representative results from two acute ischemic stroke patients enrolled in the study. The probes were placed on the forehead in both hemispheres near the frontal poles, and measurements were acquired for 5 min each at HOB positions: 30, 15, 0, -5 and 0 degrees. The measurements were normalized to their values at 30 degrees. About four minutes of data at each position was averaged, excluding the transitional signals due to changing from one position to another. The typical finding is that of “Subject 1” shown by blacklines in the figure. In most subjects, the peri-infarct side (symbol “x”, continuous line) exhibited a significantly greater change in rCBF by comparison to the contralateral side (symbol “o”, dashed-line) in response to the lowering HOB angle. This observation confirms the existence of some type of auto-regulatory impairment in the infarcted hemisphere. However, interestingly, as illustrated by “Subject 2” (light gray lines), in ~25% of subjects, CBF was observed to decrease substantially in the peri-infarct side (symbol “x”, continuous line) in response to the lowering HOB angle. This paradoxical response was also observed in traumatic brain injury patients who had invasive intra-cranial pressure (ICP) monitors; in this case that other patient data revealed a significant increase in ICP leading to decreased cerebral perfusion pressure (Kim et al., 2009). Unfortunately, in the study of acute ischemic stroke patients, an invasive monitor was not employed so that one can only speculate that the paradoxical effect was likely a result of a substantial increase in intra-cranial pressure (a parameter that is not routinely monitored in ischemic stroke patients). Preliminary, unpublished, follow-up findings indicate that the increased asymmetry observed between the two hemispheres is closely related to the National Institutes of Health Stroke Scale (NIHSS) (Mesquita et al., 2012). Since higher NIHSS scores indicate worse neurological problems, and since higher asymmetry was observed in patients with higher NIHSS, we speculate that the measured asymmetry parameter is related to the cerebral well-being
Figure 7.
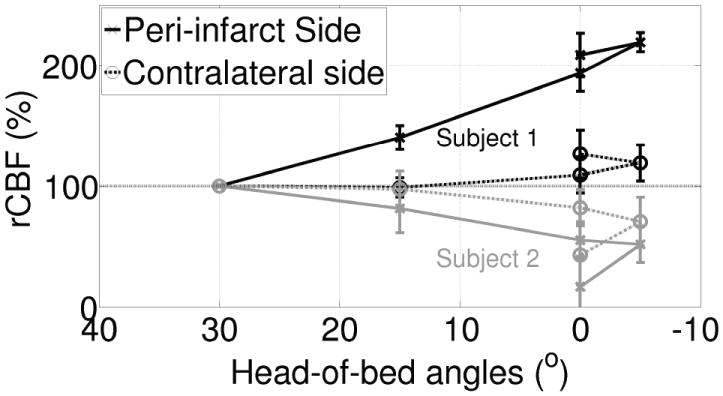
“Subject 1” shown by black lines is a typical subject. In these subjects, the peri-infarct side (“x”, continuous black line) has shown a significantly greater change in rCBF in comparison to the contralateral side (“o”, dashed black line) in response to the lowering of the HOB angle. “Subject 2” (light gray lines) represents about ~25% of the subjects, where we have observed that CBF decreased greatly in the peri-infarct side (“x”, continuous gray line) as opposed to the contralateral side (“o”, dashed gray line) in response to the lowering of the HOB position. Note that 0° was repeated twice.
4.2.4. Absolute calibration of diffuse correlation spectroscopy in piglets
Most research with DCS-determined blood flow reports on measurements of the variation in blood flow with respect to some baseline condition. In some cases these variations are due to a functional perturbation, in some cases the comparison is between normal and diseased tissue or between left and right hemispheres. Much of this research also performed validation measurements to compare DCS-determined relative changes with those measured by other diagnostic techniques (Mesquita et al., 2011), and a few studies have correlated baseline DCS-measured flow with absolute CBF measured by another technique (Buckley et al., 2009; Roche-Labarbe et al., 2009; Roche-Labarbe et al., 2012; Yu et al., 2007).
While this work is encouraging, a superficial issue that arises whenever one first encounters a DCS publication is that the blood flow index (BFI) measured by DCS has unusual units, i.e., the units of DB which are [cm2/sec], rather than blood flow ([ml/min/100g]) or velocity ([cm/sec]). A potential remedy for the absolute flow problem is to calibrate DCS against a gold-standard under baseline conditions. In principle, this approach is feasible with many of the methods that were utilized for the DCS validations, especially those that probe the exact same tissue volume.
Some recent studies have set out to accomplish this goal (Diop et al., 2011; Verdecchia et al., 2013). Their particular approach is attractive because it calibrates one optical method against another, i.e., DCS versus NIRS/DOS, in the same in vivo tissue sample volume (piglet brain). Thus both optical methods probe very similar tissue volumes and vascular compartments, and they share similar partial volume and physical model related systematic errors. Specifically, DCS-determined CBF in piglets was validated against time-domain NIRS/DOS utilizing an indocyanine green (ICG) tracer method. The absorption signal of ICG was employed for the NIRS/DOS analysis rather than fluorescence. Some of these results are shown in Figure 8 wherein absolute CBF measured by the ICG tracer method and baseline BFI (i.e., CBF) measured by DCS (using a semi-infinite mediummodel to fit the DCS data) correlated very well, e.g., with a correlation slope near unity (Left). As a further check, the authors compared DCS rCBF with NIRS/DOS rCBF by doing repeated tracer based measurements. The authors have thus explicitly shown how to convert BFI into absolute flow units; the ICG tracer method can be used in humans and a similar bolus/tracer protocol could be employed with other non-optical medical diagnostic techniques.
Figure 8.
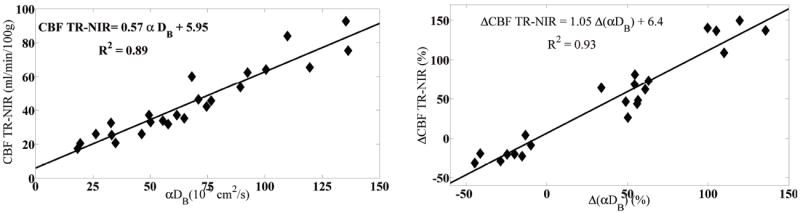
The comparison of absolute BFI (Left) and rCBF measured by DCS (Right) to that of time-domain NIRS/DOS using ICG as a flow tracer. Courtesy of Keith St Lawrence, U. Western Ontario
4.2.5. All optical measurements of cerebral oxygen metabolism
As was noted in Section 2 the measurement of changes in tissue oxy- and deoxy-hemoglobin concentration and tissue blood flow enables experimenters to compute changes in another fundamental physiological property: tissue oxygen metabolism or CMRO2. Not surprisingly, the community is interested in exploring tissue oxygen metabolism as a possible biomarker for tissue health, and the all-optical measurement of rCMRO2 has begun to garner attention for clinical brain monitoring studies of pediatric and adult populations. DCS measurements of CBF have had a major impact on the field in this context.
A collaboration between researchers at the University of Pennsylvania and the Children’s Hospital of Philadelphia, has been carrying out hybrid instrument (i.e., DCS and NIRS/DOS) optical measurements of cerebral hemodynamics and oxygen metabolism in neonates and children born with severe congenital heart defects for several years (Buckley, 2011; Buckley et al., 2012, 2013a,b; Durduran et al., 2010b; Goff et al., 2010). This effort, which has also been largely done hand-in-hand with advanced MRI methods in the same population (Goff et al., 2010), aims to improve understanding of the causes of periventricular leukomalacia (PVL). PVL appears to be the most prominent cerebral injury related to short- and long-term neurological problems experienced by the survivors. It is believed that a root cause of PVL is reduced cerebral blood perfusion and oxygen delivery, i.e., sustained ischemia. In this context, CBF measurements by DCS have been validated against arterial spin labeled MRI (ASL-MRI) (Durduran et al., 2010b) and phase-encoded velocity mapping MRI (Buckley et al., 2012). It appears that the optical techniques will enable the researchers to improve their understanding of the causes of the injuries and will ultimately help the clinicians to personalize the complex treatments these neonates and children receive upon birth, prior to the cardiac surgery, during the acute phase following the surgery, and in the long term.
In a recent study in this population (Buckley et al., 2013a), the changes in OEF, CMRO2 and CBF were quantified during the postoperative period following neonatal cardiac surgery to preoperative levels. The cohort consisted of patients with either single-ventricle or two-ventricle defects. Significant variations in OEF and CMRO2 were found between these two groups of patients, variations that could not be readily explained by the duration of the surgery that involved deep hypothermic circulatory arrest. In particular, it was observed that in single-ventricle defect neonates, CMRO2 and CBFdecreased relative to the preoperative values whereas in two-ventricle defect neonates CBF increased, OEF decreased without any net change in CMRO2. Thus, this study has nicely illustrated the potential relevance of more comprehensive assessment of cerebral hemodynamics and function offered by the hybrid technology, since none of the parameters alone was able to provide this picture/insight.
A few years ago, Franceschini and colleagues (Roche-Labarbe et al., 2009) reported successful investigation about how CMRO2 varies over time in newborn infants. Since this early work, the group has continued to utilize the hybrid optical methods to study the development of the premature and term brain (Lin et al., 2013; Roche-Labarbe et al., 2012, 2013). Their most recent results along these lines (Roche-Labarbe et al., 2013), suggest for the first time, that it is feasible to utilize the hybrid method to measure changes in the hemodynamics and in the oxygen metabolism in response to somatosensory functional stimuli in neonates. They also demonstrated that DCS can measure rCBF directly, and that rCBF derived from NIRS/DOS data (using CBV changes) via the so called “Grubb’s relationship” is not always accurate during the post-stimulus period. The latter deviations were attributed to differences in the origin of the signals in the vascular bed. Another significant methodological development from this study was that the rCMRO2 should be calculated with particular dynamical models in agreement with previous work in rat brain (Baker et al., 2012). Overall, the results suggest that fDCS is a valuable tool for assessing hemodynamics in infants, and the results confirm that functional rCMRO2 measurements are indeed possible.
We also highlight a very recent study (Verdecchia et al., 2013) whereby the previously mentioned group (see Section 4.2.4) have utilized their calibrated DCS measurements combined with the time-resolved NIRS/DOS measurements of hemoglobin concentrations in piglets to derive CMRO2 while it was manipulated by varying anesthetics and by injecting sodium cyanide. Their goal was to validate the all optical measurement of absolute CMRO2 by further measuring the venous blood oxygenation by sampling blood directly from the sagittal sinus. Their analyses have shown over a range of CMRO2 values that there were no systematic deviations between the non-invasive and invasive methods. The study takes an important step forward towards validating the CMRO2 potential of all-optical methodologies. We expect that future studies on humans will shed morelight on the accuracy of various assumptions related to these approximations.
5. Future outlook & conclusions
DCS application and technology has evolved significantly from its dynamic light scattering (DLS) and diffusing wave spectroscopy (DWS) roots in soft condensed matter physics. It has been adopted by several laboratories worldwide and it has been applied to a growing number and wide variety of biomedical and clinical problems. Here we have focused on CBF measurements for functional assessment of cerebral (patho-)physiology. The next in its evolution towards clinical adoption will involve the resolution of issues such as partial volume related systematic errors, development of robust instrumentation, implementation of large scale clinical trials in areas where DCS is deemed most suitable for medium-term success and, of course, in technological advances that improve the measurement quality, introduce more parallel data acquisition, improve tissue coupling, and reduce costs.
Highlights.
Diffuse correlation spectroscopy (DCS) is reviewed with clinical and functional examples.
A method to measure cerebral blood flow (CBF) with optics is presented.
Hybrid fNIRS and fDCS is presented as a method to measure cerebral metabolism.
Acknowledgments
AGY gratefully acknowledges partial support from the National Institute of through grants RR002305, EB015893, R01-NS060653 and HL077699.
TD gratefully acknowledged partial support by Fundació Cellex Barcelona, Marie Curie IRG (FP7, RPTAMON), Institute de Salud Carlos III (DOMMON, FIS), Ministerio de Ciencia e Innovación (MICINN), Ministerio de Economía y Comepetitividad, Institució CERCA (DOCNEURO, PROVAT-002-11), Generalitat de Catalunya, European Regional Development Fund (FEDER/ERDF) and LASERLAB (FP7) and Photonics4Life (FP7) consortia.
We acknowledge fruitful collaborations and discussions about optics and clinical opportunities for optics over many years with many outstanding scientists including, Britton Chance, John Detre, Joel Greenberg, Daniel Licht, Andrew Kofke, Mark Burnett, Joseph Culver, Cecil Cheung, David Boas, Guoqiang Yu, Chao Zhou, Regine Choe, Joan Marti Fabregas, Raquel Delgado, Udo Weigel, Peyman Zirak, Rickson Mesquita, Erin Buckley, Meeri Kim, Brian Edlow and others.
Footnotes
Herein, we will refer to this methodology collectively as NIRS/DOS.
Since unpolarized light is utilized in most experiments, β ~ 0.5.
In collaboration with Wabnitz & Liebert (Physikalisch-Technische Bundesanstalt) and Steinbrink & Koch (Charité - Universitätsmedizin).
Private communication with Guoqiang Yu
disclosures
The authors are co-inventors in patents about DCS/NIRS technologies, but they do not currently receive any royalties. There no other conflicting financial or ethical issues to disclose.
Publisher's Disclaimer: This is a PDF file of an unedited manuscript that has been accepted for publication. As a service to our customers we are providing this early version of the manuscript. The manuscript will undergo copyediting, typesetting, and review of the resulting proof before it is published in its final citable form. Please note that during the production process errors may be discovered which could affect the content, and all legal disclaimers that apply to the journal pertain.
References
- Ackerson BJ, Dougherty RL, Reguigui NM, Nobbman U. Correlation transfer: Application of radiative transfer solution methods to photon correlation problems. J Thermophys and Heat Trans. 1992;6:577–588. [Google Scholar]
- Arridge SR, Schotland JC. Optical tomography: forward and inverse problems. Inverse Problems. 2009;25(12):123010. [Google Scholar]
- Baker WB, Rodgers Z, Cai K, Buckley EM, Greenberg JH, Durduran T, Yodh AG, Reddy R. SPIE Photonics West. San Francisco, CA: 2013. Monitoring changes in the cerebral metabolic rate of oxygen consumption with diffuse optical and mri suspectometry techniques in a pig model; pp. 8578–115. [Google Scholar]
- Baker WB, Sun Z, Hiraki T, Putt ME, Durduran T, Reivich M, Yodh AG, Greenberg JH. Neurovascular coupling varies with level of global cerebral ischemia in a rat model. J Cereb Blood Flow Metab. 2012;33(1):97–105. doi: 10.1038/jcbfm.2012.137. [DOI] [PMC free article] [PubMed] [Google Scholar]
- Barnett H, Taylor D, Eliasziw M, Fox A, Ferguson G, Haynes R, Rankin R, Clagett G, Hachinski V, Sackett D, et al. Benefit of carotid endarterectomy in patients with symptomatic moderate or severe stenosis. New England Journal of Medicine. 1998;339(20):1415–1425. doi: 10.1056/NEJM199811123392002. [DOI] [PubMed] [Google Scholar]
- Berne BJ, Pecora R. Dynamic Light Scattering with Applications to Chemistry, Biology, and Physics. Krieger; Malabar, FL: 1990. [Google Scholar]
- Boas D, Franceschini M, Boas D, Franceschini M. Haemoglobin oxygen saturation as a biomarker: the problem and a solution. Philosophical Transactions of the Royal Society A: Mathematical, Physical and Engineering Sciences. 2011;369(1955):4407–4424. doi: 10.1098/rsta.2011.0250. [DOI] [PMC free article] [PubMed] [Google Scholar]
- Boas DA. Ph D Dissertation. University of Pennsylvania; 1996. Diffuse photon probes of structural and dynamical properties of turbid media: Theory and biomedical applications. [Google Scholar]
- Boas DA, Campbell LE, Yodh AG. Scattering and imaging with diffusing temporal field correlations. Phys Rev Lett. 1995;75(9):1855–1858. doi: 10.1103/PhysRevLett.75.1855. [DOI] [PubMed] [Google Scholar]
- Boas DA, Dunn AK. Laser speckle contrast imaging in biomedical optics. Journal of Biomedical Optics. 2010;15(1):011109. doi: 10.1117/1.3285504. [DOI] [PMC free article] [PubMed] [Google Scholar]
- Boas DA, Gaudette T, Strangman G, Cheng X, Marota JJA, Mandeville JB. The accuracy of near infrared spectroscopy and imaging during focal changes in cerebral hemodynamics. NeuroImage. 2001;13:76–90. doi: 10.1006/nimg.2000.0674. [DOI] [PubMed] [Google Scholar]
- Boas DA, Yodh AG. Spatially varying dynamical properties of turbid media probed with diffusing temporal light correlation. J Opt Soc Am A. 1997;14(1):192–215. [Google Scholar]
- Brown DW, Haensse D, Bauschatz A, Wolf M. Nirs measurement of venous oxygen saturation in the adult human head. In: Cicco G, Bruley D, Ferrari M, Harrison D, editors. Oxygen Transport to Tissue XXVII. Advances in Experimental Medicine and Biology. Vol. 578. Springer; US: 2006. pp. 251–256. [DOI] [PubMed] [Google Scholar]
- Brown W. Dynamic Light Scattering: The Method and Some Applications. Clarendon, New York: 1993. [Google Scholar]
- Buckley EM. Ph D Dissertation. University of Pennsylvania; 2011. Cerebral hemodynamics in high-risk neonates probed by diffuse optical spectroscopies. [Google Scholar]
- Buckley EM, Cook NM, Durduran T, Kim MN, Zhou C, Choe R, Yu G, Shultz S, Sehgal CM, Licht DJ, Arger PH, Putt ME, Hurt HH, Yodh AG. Cerebral hemodynamics in preterm infants during positional intervention measured with diffuse correlation spectroscopy and transcranial doppler ultrasound. Optics Express. 2009;17:12571–12581. doi: 10.1364/oe.17.012571. [DOI] [PMC free article] [PubMed] [Google Scholar]
- Buckley EM, Hance D, Pawlowski T, Lynch J, Wilson FB, Mesquita RC, Durduran T, Diaz LK, Putt ME, Licht DJ, Fogel MA, Yodh AG. Validation of diffuse correlation spectroscopic measurement of cerebral blood flow using phase-encoded velocity mapping MRI. Journal of Biomedical Optics. 2012;17(3):037007–1. doi: 10.1117/1.JBO.17.3.037007. [DOI] [PMC free article] [PubMed] [Google Scholar]
- Buckley EM, Kim MN, Durduran T, Yu G, Choe R, Zhou C, Shultz S, Sehgal CM, Licht DJ, Arger PH, Hurt HH, Cook NM, Yodh AG. OSA Biomedicals Topicals. St Petersburg, FL: Mar, 2008. Monitoring hemodynamic changes in preterm infants using optical spectroscopies and doppler ultrasound; p. CN279. [Google Scholar]
- Buckley EM, Lynch JM, Goff DA, Schwab PJ, Baker WB, Durduran T, Busch DR, Nicolson SC, Montenegro LM, Naim MY, Xiao R, Spray TL, Yodh A, Gaynor JW, Licht DJ. Early postoperative changes in cerebral oxygen metabolism following neonatal cardiac surgery: Effects of surgical duration. The Journal of Thoracic and Cardiovascular Surgery. 2013a;145:196–205. doi: 10.1016/j.jtcvs.2012.09.057. [DOI] [PMC free article] [PubMed] [Google Scholar]
- Buckley EM, Naim M, Lynch J, Goff D, Diaz L, Nicolson S, Montenegro L, Lavin N, Durduran T, Spray T, Gaynor J, Putt M, Yodh AG, Fogel M, Licht DJ. Sodium bicarbonate causes dose-dependent increases in cerebral blood flow in infants and children with single ventricle physiology. Pediatric Research. 2013b;73:668–73. doi: 10.1038/pr.2013.25. [DOI] [PMC free article] [PubMed] [Google Scholar]
- Caplan L, Hennerici M. Impaired clearance of emboli (washout) is an important link between hypoperfusion, embolism, and ischemic stroke. Archives of Neurology. 1998;55(11):1475. doi: 10.1001/archneur.55.11.1475. [DOI] [PubMed] [Google Scholar]
- Carp SA, Dai GP, Boas DA, Franceschini MA, Kim YR. Validation of diffuse correlation spectroscopy measurements of rodent cerebral blood flow with simultaneous arterial spin labeling mri; towards mri-optical continuous cerebral metabolic monitoring. Biomed Opt Express. 2010;1(2):553–565. doi: 10.1364/BOE.1.000553. [DOI] [PMC free article] [PubMed] [Google Scholar]
- Cheung C, Culver JP, Takahashi K, Greenberg JH, Yodh AG. In vivo cerebrovascular measurement combining diffuse near-infrared absorption and correlation spectroscopies. Phys Med and Biol. 2001;46(8):2053–2065. doi: 10.1088/0031-9155/46/8/302. [DOI] [PubMed] [Google Scholar]
- Choe R, Durduran T. Diffuse optical monitoring of the neoadjuvant breast cancer therapy. IEEE Journal of Selected Topics in Quantum Electronics. 2012 Jul-Aug;18(4):1367–1386. doi: 10.1109/JSTQE.2011.2177963. [DOI] [PMC free article] [PubMed] [Google Scholar]
- Chu B. Laser Light Scattering, Basic Principles and Practice. Academic; New York: 1991. [Google Scholar]
- Culver JP, Durduran T, Furuya D, Cheung C, Greenberg JH, Yodh AG. Diffuse optical tomography of cerebral blood flow, oxygenation and metabolism in rat during focal ischemia. J Cereb Blood Flow Metab. 2003;23:911–24. doi: 10.1097/01.WCB.0000076703.71231.BB. [DOI] [PubMed] [Google Scholar]
- Daly S, Leahy M. ‘go with the flow’: A review of methods and advancements in blood flow imaging. Journal of Biophotonics. 2012 doi: 10.1002/jbio.201200071. [DOI] [PubMed] [Google Scholar]
- Dehaes M, Gagnon L, Lesage F, Pélégrini-Issac M, Vignaud A, Valabrègue R, Grebe R, Wallois F, Benali H. Quantitative investigation of the effect of the extra-cerebral vasculature in diffuse optical imaging: a simulation study. Biomed Opt Express. 2011 Mar;2(3):680–695. doi: 10.1364/BOE.2.000680. [DOI] [PMC free article] [PubMed] [Google Scholar]
- Dehghani H, Srinivasan S, Pogue BW, Gibson A. Numerical modelling and image reconstruction in diffuse optical tomography. Phil Trans R Soc A. 2009;367:3073–3093. doi: 10.1098/rsta.2009.0090. [DOI] [PMC free article] [PubMed] [Google Scholar]
- Derdeyn C, Grubb R, Powers W. Cerebral hemodynamic impairment: Methods of measurement and association with stroke risk. Neurology. 1999;53(2):251. doi: 10.1212/wnl.53.2.251. [DOI] [PubMed] [Google Scholar]
- Devor A, Sakadzic S, Srinivasan VJ, Yaseen MA, Nizar K, Saisan PA, Tian P, Dale AM, Vinogradov SA, Franceschini MA, Boas DA. Frontiers in optical imaging of cerebral blood flow and metabolism. J Cereb Blood Flow Metab. 2012:1–18. doi: 10.1038/jcbfm.2011.195. 2012/01/18/online. [DOI] [PMC free article] [PubMed] [Google Scholar]
- Dietsche G, Ninck M, Ortolf C, Li J, Jaillon F, Gisler T. Fiber-based multispeckle detection for time-resolved diffusing-wave spectroscopy: characterization and application to blood flow detection in deep tissue. Applied Optics. 2007;46(35):8506–8514. doi: 10.1364/ao.46.008506. [DOI] [PubMed] [Google Scholar]
- Diop M, Verdecchia K, Lee T-Y, Lawrence KS. Calibration of diffuse correlation spectroscopy with a time-resolved near-infrared technique to yield absolute cerebral blood flow measurements. Biomed Opt Express. 2011 Jul;2(7):2068–2081. doi: 10.1364/BOE.2.002068. [DOI] [PMC free article] [PubMed] [Google Scholar]
- Dougherty RL, Ackerson BJ, Reguigui NM, Dorri-Nowkoorani F, Nobbmann U. Correlation transfer: Development and application. J Quant Spectrosc Radiat Transfer. 1994;52:713–727. [Google Scholar]
- Durduran T. Ph D Dissertation. University of Pennsylvania; 2004. Non-invasive measurements of tissue hemodynamics with hybrid diffuse optical methods. [Google Scholar]
- Durduran T, Choe R, Baker W, Yodh AG. Diffuse optics for tissue monitoring and tomography. Rep Prog Phys. 2010a;73(7):076701–076744. doi: 10.1088/0034-4885/73/7/076701. [DOI] [PMC free article] [PubMed] [Google Scholar]
- Durduran T, Kim MN, Buckley EM, Choe R, Zhou C, Yu GY, Yodh AG. SPIE Photonics West. San Jose, CA: 2009a. Validation of diffuse correlation spectroscopy for measurement of cerebral blood flow across spatial scales and against multiple modalities. [Google Scholar]
- Durduran T, Kim MN, Buckley EM, Zhou C, Yu G, Choe R, Greenberg JH, Detre JA, Yodh AG. Diffuse optical monitoring of cerebral oxygen metabolism at the bed-side in cerebrovascular disorders. OSA: Annual Meeting, Frontiers in Optics 2008; Rochester, NY. Oct, 2008a. [Google Scholar]
- Durduran T, Yu G, Burnett MG, Detre JA, Greenberg JH, Wang J, Zhou C, Yodh AG. Diffuse optical measurements of blood flow, blood oxygenation and metabolism in human brain during sensorimotor cortex activation. Opt Lett. 2004;29:1766–1768. doi: 10.1364/ol.29.001766. [DOI] [PubMed] [Google Scholar]
- Durduran T, Zhou C, Buckley EM, Kim MN, Yu G, Choe R, Gaynor WJ, Spray TL, Durning SM, Mason SE, Montenegro LM, Nicolson SC, Zimmerman RA, Putt ME, Wang JJ, Greenberg JH, Detre JA, Yodh AG, Licht DJ. Optical measurement of cerebral hemodynamics and oxygen metabolism in neonates with congenital heart defects. J Biomed Opt. 2010b May-Jun;15(3):037004. doi: 10.1117/1.3425884. [DOI] [PMC free article] [PubMed] [Google Scholar]
- Durduran T, Zhou C, Edlow BL, Yu G, Choe R, Kim MN, Cucchiara BL, Putt ME, Shah Q, Kasner SE, Greenberg JH, Yodh AG, Detre JA. Transcranial optical monitoring of cerebrovascular hemodynamics in acute stroke patients. Optics Express. 2009b;17(5):3884–3902. doi: 10.1364/oe.17.003884. [DOI] [PMC free article] [PubMed] [Google Scholar]
- Durduran T, Zhou C, Kim MN, Buckley EM, Yu G, Choe R, Durning SM, Mason S, Montenegro LM, Nicholson SC, Zimmerman RA, Wang JJ, Detre JA, Yodh AG, Licht DJ. Validation of diffuse correlation spectroscopy for non-invasive, continuous monitoring of cbf in neonates with congenital heart defects. Annual Meeting of the American Neurological Association American Neurological Association; Salt Lake City, Utah. Sep, 2008b. Abstract 299. [Google Scholar]
- Durduran T, Zhou C, Yu G, Choe R, Silvestre D, Wang JJ, Nicolson S, Montenegro L, Detre JA, Yodh AG, Licht D. SPIE Photonics West. San Jose, CA: 2007. Pre-operative measurement of co2 reactivity and cerebral autoregulation in neonates with severe congenital heart defects. [Google Scholar]
- Durduran T, Zhou C, Yu G, Hoang AM, Tang KZ, Detre JA, Greenberg JH, Yodh AG. Diffuse optical measurement of local cerebral blood flow, blood oxygenation and metabolism during cognitive tasks. 12th Annual Meeting of the Organization for Human Brain Mapping; Florence, Italy. 2006. [Google Scholar]
- Edlow BL, Kim MN, Durduran T, Zhou C, Putt ME, Yodh AG, Greenberg JH, Detre JA. The effects of healthy aging on cerebral hemodynamic responses to posture change. Physiol Meas. 2010;31:477–495. doi: 10.1088/0967-3334/31/4/002. [DOI] [PubMed] [Google Scholar]
- Ferrari M, Quaresima V. A brief review on the history of human functional near-infrared spectroscopy (fnirs) development and fields of application. NeuroImage. 2012a doi: 10.1016/j.neuroimage.2012.03.049. [DOI] [PubMed] [Google Scholar]
- Ferrari M, Quaresima V. Review: Near infrared brain and muscle oximetry: from the discovery to current applications. Journal of Near Infrared Spectroscopy. 2012b;20(1):1. [Google Scholar]
- Gagnon L, Desjardins M, Jehanne-Lacasse J, Bherer L, Lesage F. Investigation of diffuse correlation spectroscopy in multi-layered media including the human head. Opt Express. 2008;16(20):15514–15530. doi: 10.1364/oe.16.015514. [DOI] [PubMed] [Google Scholar]
- Ghosh A, Elwell C, Smith M. Cerebral near-infrared spectroscopy in adults: A work in progress. Anesthesia and analgesia. 2012 Nov;115(6):1373–1383. doi: 10.1213/ANE.0b013e31826dd6a6. [DOI] [PubMed] [Google Scholar]
- Gibbs J, Leenders K, Wise R, Jones T. Evaluation of cerebral perfusion reserve in patients with carotid-artery occlusion. The Lancet. 1984;323(8372):310–314. doi: 10.1016/s0140-6736(84)90361-1. [DOI] [PubMed] [Google Scholar]
- Goff D, Buckley E, Durduran T, Wang JJ, Licht DJ. Noninvasive cerebral perfusion imaging in high risk neonates. Seminars in Perinatology: Recent Advances in Neuroimaging in the Newborn. 2010;34:46–56. doi: 10.1053/j.semperi.2009.10.005. [DOI] [PMC free article] [PubMed] [Google Scholar]
- He L, Lin Y, Shang Y, Shelton B, Yu G. Using optical fibers with different modes to improve the signal-to-noise ratio (snr) of diffuse correlation spectroscopy (dcs) flow-oximeter measurements. J Biomed Opt. 2013 doi: 10.1117/1.JBO.18.3.037001. Accepted in press. [DOI] [PMC free article] [PubMed] [Google Scholar]
- Hyvönen N, Nandakumaran A, Varma H, Vasu R. Generalized eigenvalue decomposition of the field autocorrelation in correlation diffusion of photons in turbid media. Mathematical Methods in the Applied Sciences 2012 [Google Scholar]
- Irwin D, Dong L, Shang Y, Cheng R, Kudrimoti M, Stevens S, Yu G. Influences of tissue absorption and scattering on diffuse correlation spectroscopy blood flow measurements. Biomedical Optics Express. 2011;2(7):1969–1985. doi: 10.1364/BOE.2.001969. [DOI] [PMC free article] [PubMed] [Google Scholar]
- Jaillon F, Li J, Dietsche G, Elbert T, Gisler T. Activity of the human visual cortex measured non-invasively by diffusing-wave spectroscopy. Optics Express. 2007;15(11):6643–6650. doi: 10.1364/oe.15.006643. [DOI] [PubMed] [Google Scholar]
- Jaillon F, Skipetrov SE, Li J, Dietsche G, Maret G, Gisler T. Diffusing-wave spectroscopy from head-like tissue phantoms : influence of a non-scattering layer. Optics Express. 2006;14(22):10181–10194. doi: 10.1364/oe.14.010181. [DOI] [PubMed] [Google Scholar]
- Kaplan PD. Ph D Dissertation. University of Pennsylvania; 1993. Optical studies of the structure and dynamics of opaque colloids. [Google Scholar]
- Kim MN, Durduran T, Frangos S, Buckley EM, Zhou C, Yu G, Moss H, Edlow BL, Maloney-Wilensky E, Detre JA, Greenberg JH, Kofke WA, Yodh AG, Grady MS, Woo JH, Wolf RL, Levine J. Validation of diffuse correlation spectroscopy against xenon ctcbf in humans after traumatic brain injury or subarachnoid hemorrhage. Neurocritical Care Society Annual Meeting; Miami, FL. 2008. [Google Scholar]
- Kim MN, Durduran T, Frangos S, Buckley EM, Zhou C, Yu G, Moss H, Edlow BL, Maloney-Wilensky E, Detre JA, Greenberg JH, Kofke WA, Yodh AG, Grady MS, Woo JH, Wolf RL, Levine J. SPIE Photonics West. San Jose, CA: 2009. Diffuse optical measurements of cerebral blood flow and oxygenation in patients after traumatic brain injury or subarachnoid hemorrhage. [Google Scholar]
- Kim MN, Durduran T, Frangos S, Edlow BL, Buckley EM, Heather EM, Zhou C, Yu G, Choe R, E M, Wolf RL, Woo JH, Grady MS, Greenberg JH, Levine JM, Yodh AG, Detre JA, Kofke WA. Noninvasive measurement of cerebral blood flow and blood oxygenation using near-infrared and diffuse correlation spectroscopies in critically brain-injured adults. Neurocritical Care. 2010 Apr;12(2):173–180. doi: 10.1007/s12028-009-9305-x. [DOI] [PMC free article] [PubMed] [Google Scholar]
- Kistler J, Ropper A, Heros R. Therapy of ischemic cerebral vascular disease due to atherothrombosis. New England Journal of Medicine. 1984;311(1):27–34. doi: 10.1056/NEJM198407053110105. [DOI] [PubMed] [Google Scholar]
- Kofke WA. Ch Monitoring Cerebral Blood Flow. Springer; 2012. Monitoring the Nervous System for Anesthesiologists and Other Health Care Professionals; pp. 759–784. [Google Scholar]
- Lemieux PA, Durian DJ. Investigating non-gaussian scattering processes by using nth-order intensity correlation functions. Journal of the Optical Society of America A. 1999;16(7):1651–1664. [Google Scholar]
- Li J, Dietsche G, Iftime D, Skipetrov SE, Maret G, Elbert T, Rock-stroh B, Gisler T. Noninvasive detection of functional brain activity with near-infrared diffusing-wave spectroscopy. J Biomed Opt. 2005 Jul-Aug;10(4):044002-1–044002-12. doi: 10.1117/1.2007987. [DOI] [PubMed] [Google Scholar]
- Li J, Ninck M, Koban L, Elbert T, Kissler J, Gisler T. Transient functional blood flow change in the human brain measured noninvasively by diffusing-wave spectroscopy. Optics Letters. 2008;33(19):2233–2235. doi: 10.1364/ol.33.002233. [DOI] [PubMed] [Google Scholar]
- Lin P-Y, Roche-Labarbe N, Dehaes M, Fenoglio A, Grant PE, Franceschini MA. Regional and hemispheric asymmetries of cerebral hemodynamic and oxygen metabolism in newborns. Cerebral Cortex. 2013;23(2):339–348. doi: 10.1093/cercor/bhs023. [DOI] [PMC free article] [PubMed] [Google Scholar]
- Lou HC, Edvinsson L, Mackenzie ET. The concept of coupling blood-flow to brain-function - revision required. An of Neurol. 1987;22(3):289–297. doi: 10.1002/ana.410220302. [DOI] [PubMed] [Google Scholar]
- Maret G, Wolf PE. Multiple light scattering from disordered media. the effect of brownian motion of scatterers. Z Phys B. 1987;65:409–413. [Google Scholar]
- Menon C, Polin GM, Prabakaran I, Hs A, Cheung C, Culver JP, Pingpank J, Sehgal CS, Yodh AG, Buerk DG, Fraker DL. An integrated approach to measuring tumor oxygen status using human melanoma xenografts as a model. Cancer Res. 2003;63:7232–40. [PubMed] [Google Scholar]
- Mesquita R, Schenkel S, Durduran T, Favilla C, Kim M, Minkoff D, Mullen M, Greenberg J, Detre J, Kasner S, Yodh AG. OSA Biomedical Topicals. Optical Society of America; Miami, FL: 2012. Diffuse correlation spectroscopy for flow assessment & management of acute ischemic stroke; p. BW4B.4. [Google Scholar]
- Mesquita RC, Durduran T, Yu G, Buckley EM, Kim MN, Zhou C, Choe R, Sunar U, Yodh AG. Direct measurement of tissue blood flow and metabolism with diffuse optics. Philosophical Transactions of the Royal Society A: Mathematical, Physical and Engineering Sciences. 2011;369(1955):4390–4406. doi: 10.1098/rsta.2011.0232. [DOI] [PMC free article] [PubMed] [Google Scholar]
- Mesquita RC, Faseyitan OK, Turkeltaub PE, Buckley EM, Thomas A, Kim MN, Durduran T, Greenberg JH, Detre JA, Yodh AG, Hamilton RH. Blood flow and oxygenation changes due to low-frequency repetitive transcranial magnetic stimulation of the cerebral cortex. J Biomed Opt. 2013 doi: 10.1117/1.JBO.18.6.067006. accepted in press. [DOI] [PMC free article] [PubMed] [Google Scholar]
- Mesquita RC, Skuli N, Kim MN, Liang J, Schenkel S, Majmundar AJ, Simon MC, Yodh AG. Hemodynamic and metabolic diffuse optical monitoring in a mouse model of hindlimb ischemia. Biomed Opt Express. 2010;1(4):1173–1187. doi: 10.1364/BOE.1.001173. [DOI] [PMC free article] [PubMed] [Google Scholar]
- Mosso A. Ueber den Kreislauf des Blutes im menschlichen Gehirn. Veit; Leipzig: 1881. [Google Scholar]
- Nandakumaran A, Varma H, Vasu RM. Analysis of the inverse problem associated with diffuse correlation tomography. Math Eng Sci & Aerospace. 2012;3(1):79–97. [Google Scholar]
- Okada E, Delpy DT. Near-infrared light propagation in an adult head model. I. modeling of low-level scattering in the cerebrospinal fluid layer. Appl Opt. 2003a;42:2906–14. doi: 10.1364/ao.42.002906. [DOI] [PubMed] [Google Scholar]
- Okada E, Delpy DT. Near-infrared light propagation in an adult head model. II. effect of superficial tissue thickness on the sensitivity of the near-infrared spectroscopy signal. Appl Opt. 2003b;42:2915–21. doi: 10.1364/ao.42.002915. [DOI] [PubMed] [Google Scholar]
- Paulson OB, Strandgaard S, Edvinsson L. Cerebral autoregulation. Cerebrovasc Brain Metab Rev. 1990;2(2):161–192. [PubMed] [Google Scholar]
- Pine DJ, Weitz DA, Chaikin PM, Herbolzheimer E. Diffusing-wave spectroscopy. Phys Rev Lett. 1988;60:1134–1137. doi: 10.1103/PhysRevLett.60.1134. [DOI] [PubMed] [Google Scholar]
- Pine DJ, Weitz DA, Zhu JX, Herbolzheimer E. Diffusing-wave spectroscopy: Dynamic light scattering in the multiple scattering limit. J Phys France. 1990;51:2101–2127. [Google Scholar]
- Roche-Labarbe N, Carp SA, Surova A, Patel M, Boas DA, Grant PE, Franceschini M. Noninvasive optical measures of cbv, sto2, cbf index, and rcmro2 in human premature neonates’ brains in the first six weeks of life (p na) Human Brain Mapping. 2009;31(3):341–352. doi: 10.1002/hbm.20868. [DOI] [PMC free article] [PubMed] [Google Scholar]
- Roche-Labarbe N, Fenoglio A, Aggarwal A, Dehaes M, Carp SA, Franceschini MA, Grant PE. Near-infrared spectroscopy assessment of cerebral oxygen metabolism in the developing premature brain. J Cereb Blood Flow Metab. 2012;32:481–488. doi: 10.1038/jcbfm.2011.145. [DOI] [PMC free article] [PubMed] [Google Scholar]
- Roche-Labarbe N, Fenoglio A, Radhakrishnan H, Kocienski-Filip M, Carp SA, Dubb J, Boas DA, Grant PE, Franceschini MA. Somatosensory evoked changes in cerebral oxygen consumption measured non-invasively in premature neonates. NeuroImage. 2013;(0) doi: 10.1016/j.neuroimage.2013.01.035. [DOI] [PMC free article] [PubMed] [Google Scholar]
- Roy CS, Sherrington CS. On the regulation of the blood-supply of the brain. The Journal of Physiology. 1890;11(1-2):85. doi: 10.1113/jphysiol.1890.sp000321. [DOI] [PMC free article] [PubMed] [Google Scholar]
- Saager RB, Berger AJ. Direct characterization and removal of interfering absorption trends in two-layer turbid media. J Opt Soc Am A Opt Image Sci Vis. 2005 Sep;22(9):1874–1882. doi: 10.1364/josaa.22.001874. in folder Two-layer trend removal, Brain – have pdf. [DOI] [PubMed] [Google Scholar]
- Schätzel K. Correlation techniques in dynamic light scattering. Applied Physics B: Lasers and Optics. 1987;42(4):193–213. in folder Flow Noise Methods. [Google Scholar]
- Shang Y, Chen L, Toborek M, Yu G. Diffuse optical monitoring of repeated cerebral ischemia in mice. Opt Express. 2011a Oct;19(21):20301–20315. doi: 10.1364/OE.19.020301. [DOI] [PMC free article] [PubMed] [Google Scholar]
- Shang Y, Cheng R, Dong L, Ryan S, Saha S, Yu G. Cerebral monitoring during carotid endarterectomy using near-infrared diffuse optical spectroscopies and electroencephalogram. Physics in Medicine and Biology. 2011b;56:3015. doi: 10.1088/0031-9155/56/10/008. [DOI] [PubMed] [Google Scholar]
- Shang Y, Zhao Y, Cheng R, Dong L, Irwin D, Yu G. Portable optical tissue flow oximeter based on diffuse correlation spectroscopy. Optics Letters. 2009;34(22):3556–3558. doi: 10.1364/OL.34.003556. [DOI] [PubMed] [Google Scholar]
- Siesjo BK. Brain Energy Metabolism. John Wiley & Sons Ltd; Apr, 1978. [Google Scholar]
- Smith M. Monitoring intracranial pressure in traumatic brain injury. Anesth Analg. 2008;106(1):240–248. doi: 10.1213/01.ane.0000297296.52006.8e. [DOI] [PubMed] [Google Scholar]
- Stanimirovic D, Friedman A. Pathophysiology of the neurovascular unit: disease cause or consequence. Journal of Cerebral Blood Flow & Metabolism. 2012;32(7):1207–1221. doi: 10.1038/jcbfm.2012.25. [DOI] [PMC free article] [PubMed] [Google Scholar]
- Stephen MJ. Temporal fluctuations in wave propagation in random media. Phys Rev B. 1988;37:1–5. doi: 10.1103/physrevb.37.1. [DOI] [PubMed] [Google Scholar]
- Strangman G, Franceschini MA, Boas DA. Factors affecting the accuracy of near-infrared spectroscopy concentration calculations for focal changes in oxygenation parameters. NeuroImage. 2003;18:865–79. doi: 10.1016/s1053-8119(03)00021-1. [DOI] [PubMed] [Google Scholar]
- Tamura M, Hoshi Y, Okada F. Localized near-infrared spectroscopy and functional optical imaging of brain activity. Philos Trans R Soc Lond B Biol Sci. 1997;352:737–742. doi: 10.1098/rstb.1997.0056. [DOI] [PMC free article] [PubMed] [Google Scholar]
- Tellis G, Mesquita R, Yodh A. Use of diffuse correlation spectroscopy to measure brain blood flow differences during speaking and non-speaking tasks for fluent speakers and persons who stutter. Perspectives on Fluency and Fluency Disorders. 2011;21(3):96–106. [Google Scholar]
- Varma H, Banerjee B, Roy D, Nandakumaran A, Vasu R. Convergence analysis of the newton algorithm and a pseudo-time marching scheme for diffuse correlation tomography. JOSA A. 2010;27(2):259–267. doi: 10.1364/JOSAA.27.000259. [DOI] [PubMed] [Google Scholar]
- Varma H, Nandakumaran A, Vasu R. Study of turbid media with light: Recovery of mechanical and optical properties from boundary measurement of intensity autocorrelation of light. JOSA A. 2009;26(6):1472–1483. doi: 10.1364/josaa.26.001472. [DOI] [PubMed] [Google Scholar]
- Verdecchia K, Diop M, Lee T-Y, Lawrence KS. Quantifying the cerebral metabolic rate of oxygen by combining diffuse correlation spectroscopy and time-resolved near-infrared spectroscopy. Journal of Biomedical Optics. 2013;18(2):027007–027007. doi: 10.1117/1.JBO.18.2.027007. [DOI] [PubMed] [Google Scholar]
- Villringer A, Dirnagl U. Coupling of brain activity and cerebral blood flow: basis of functional neuroimaging. Cereb Brain Metab Rev. 1995;7:240–76. [PubMed] [Google Scholar]
- Webster M, Makaroun M, Steed D, Smith H, Johnson D, Yonas H. Compromised cerebral blood flow reactivity is a predictor of stroke in patients with symptomatic carotid artery occlusive disease. Journal of vascular surgery. 1995;21(2):338–345. doi: 10.1016/s0741-5214(95)70274-1. [DOI] [PubMed] [Google Scholar]
- Weitz DA, Pine DJ. Ch Diffusing-wave Spectroscopy. Oxford Science Publications; USA: 1993. Dynamic Light Scattering The Method and Some Applications. [Google Scholar]
- Wintermark M, Sesay M, Barbier E, Borbely K, Dillon WP, Eastwood JD, Glenn TC, Grandin CB, Pedraza S, Soustiel JF, Nariai T, Zaharchuk G, Caille JM, Dousset V, Yonas H. Comparative overview of brain perfusion imaging techniques. Stroke. 2005;36(9):83–99. doi: 10.1161/01.STR.0000177884.72657.8b. [DOI] [PubMed] [Google Scholar]
- Wolf M, Ferrari M, Quaresima V. Progress of near-infrared spectroscopy and topography for brain and muscle clinical applications. Journal of Biomedical Optics. 2007;12(6):062104. doi: 10.1117/1.2804899. [DOI] [PubMed] [Google Scholar]
- Yodh AG, Greenberg JH, Yu G, Detre JA, Durduran T, Burnett MG, Mohler ER, III, Quon H, Hahn SM. Optical measurement of tissue blood flow, hemodynamics and oxygenation. 8082015 Patent, uS. 2011 Dec;
- Yu G. Diffuse correlation spectroscopy (dcs): A diagnostic tool for assessing tissue blood flow in vascular-related diseases and therapies. Current Medical Imaging Reviews. 2012a;8(3):194–210. [Google Scholar]
- Yu G. Near-infrared diffuse correlation spectroscopy in cancer diagnosis and therapy monitoring. Journal of biomedical optics. 2012b;17(1):010901. doi: 10.1117/1.JBO.17.1.010901. [DOI] [PMC free article] [PubMed] [Google Scholar]
- Yu G, Durduran T, Zhou C, Cheng R, Yodh AG. Near-infrared diffuse correlation spectroscopy for assessment of tissue blood flow. In: Boas D, Pitris C, Ramanujam N, editors. Handbook of Biomedical Optics. CRC Press; Boca Raton: 2011. pp. 195–216. [Google Scholar]
- Yu G, Durduran T, Zhou C, Wang HW, Putt ME, Saunders M, Seghal CM, Glatstein E, Yodh AG, Busch TM. Noninvasive monitoring of murine tumor blood flow during and after photodynamic therapy provides early assessment of therapeutic efficacy. Clin Cancer Res. 2005;11:3543–3552. doi: 10.1158/1078-0432.CCR-04-2582. [DOI] [PubMed] [Google Scholar]
- Yu G, Floyd T, Durduran T, Zhou C, Wang JJ, Detre JA, Yodh AG. Validation of diffuse correlation spectroscopy for muscle blood flow with concurrent arterial-spin-labeling perfusion. Opt Exp. 2007;15:1064–75. doi: 10.1364/oe.15.001064. [DOI] [PubMed] [Google Scholar]
- Zauner A, Daugherty WP, Bullock MR, Warner DS. Brain oxygenation and energy metabolism: Part I - biological function and pathophysiology. Neurosurgery. 2002;51(2):289–302. [PubMed] [Google Scholar]
- Zauner A, Muizelaar JP. Measuring Cerebral Blood Flow and Metabolism. Vol. 11. Chapman and Hall; London, UK: 1997. Head Injury; pp. 217–27. [Google Scholar]
- Zhou C. Ph D Dissertation. University of Pennsylvania; 2007. In-vivo optical imaging and spectroscopy of cerebral hemodynamics. [Google Scholar]
- Zhou C, Eucker S, Durduran T, Yu G, Ralston J, Friess SH, Ichord RN, Margulies SS, Yodh AG. Diffuse optical monitoring of hemodynamic changes in piglet brain with closed head injury. Journal of Biomedical Optics. 2009;14:034015. doi: 10.1117/1.3146814. [DOI] [PMC free article] [PubMed] [Google Scholar]
- Zhou C, Yu G, Furuya D, Greenberg JH, Yodh AG, Durduran T. Diffuse optical correlation tomography of cerebral blood flow during cortical spreading depression in rat brain. Opt Exp. 2006;14:1125–44. doi: 10.1364/oe.14.001125. [DOI] [PubMed] [Google Scholar]
- Zirak P, Delgado-Mederos R, Dinia L, Marti-Fabregas J, Durduran T. Macro-vs micro-vascular cerebral vasomotor reactivity in patients with severe internal carotid artery stenosis or occlusion. Stroke. 2013 doi: 10.1016/j.acra.2013.10.010. submitted. [DOI] [PubMed] [Google Scholar]
- Zirak P, Delgado-Mederos R, Martí–Fàbregas J, Durduran T. Effects of acetazolamide on the micro-and macro-vascular cerebral hemodynamics: A diffuse optical and transcranial doppler ultrasound study. Biomedical Optics Express. 2010 Dec;1(5):1443–1459. doi: 10.1364/BOE.1.001443. [DOI] [PMC free article] [PubMed] [Google Scholar]