

Abstract
Statistical analysis of protein evolution suggests a design for natural proteins in which sparse networks of coevolving amino acids (termed sectors) comprise the essence of three-dimensional structure and function1, 2, 3, 4, 5. However, proteins are also subject to pressures deriving from the dynamics of the evolutionary process itself—the ability to tolerate mutation and to be adaptive to changing selection pressures6, 7, 8, 9, 10. To understand the relationship of the sector architecture to these properties, we developed a high-throughput quantitative method for a comprehensive single-mutation study in which every position is substituted individually to every other amino acid. Using a PDZ domain (PSD95pdz3) model system, we show that sector positions are functionally sensitive to mutation, whereas non-sector positions are more tolerant to substitution. In addition, we find that adaptation to a new binding specificity initiates exclusively through variation within sector residues. A combination of just two sector mutations located near and away from the ligand-binding site suffices to switch the binding specificity of PSD95pdz3 quantitatively towards a class-switching ligand. The localization of functional constraint and adaptive variation within the sector has important implications for understanding and engineering proteins.
A basic tenet of biology is that the amino acid sequence of proteins specifies their three-dimensional structure and biochemical function, at least in a physiological setting11. Statistical coupling analysis (SCA)1, 2, 5 is a quantitative approach for understanding the information content of protein sequences through a generalization of the principle of evolutionary conservation. The underlying premise is that the pattern of energetic couplings between residues in a protein—the functional constraints between amino acids—might be exposed through a statistical analysis of coevolution of those residue positions in a family of homologous sequences. A main conclusion of SCA is that most residues in proteins evolve nearly independently, without much influence from even their immediate structural environment, whereas about 20% of amino acids (Fig. 1a and Supplementary Fig. 1) are organized into physically contiguous networks of coevolving amino acids, termed protein sectors1, 2. Sectors are typically built around protein active sites, but connect to distant functional surfaces through pathways of residue interactions in the protein core12. For example, in the PDZ family of protein interaction modules, the sector connects the ligand-binding pocket with an allosteric site (Fig. 1b, asterisk) on the opposite surface2, 13. Sectors are found in every protein family studied so far and are related to conserved functional activities, suggesting that this structural feature is a general property of natural proteins1, 3, 5, 14, 15, 16.
Figure 1. Sector architecture in the PDZ domain family.
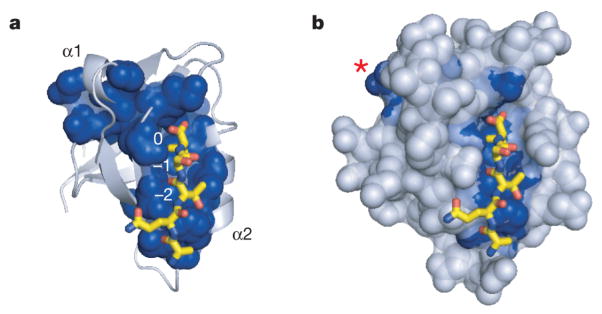
a, b, The PDZ sector (blue spheres) shown in a cartoon (a) or space filling (b) representation of the structure of rat PSD95pdz3 (Protein Data Bank (PDB) accession 1BE9). Yellow stick bonds represent the co-crystallized peptide ligand, with ligand positions numbered (0, −1, −2). The sector comprises a sparse network of residues built around the ligand-binding pocket and connecting to a distant surface site (marked with asterisk) through a subset of amino acid interactions within the protein core.
An important next step is to understand why the design of natural proteins should look like the sector architecture, with distributed sparse networks of cooperatively acting residues embedded within an environment of weakly coupled amino acids. One reason might be necessity for native folding and function, but this seems unlikely. The marked recent advances in physics-based protein design are largely based on homogeneous optimization of local interactions in protein structures17, 18, and alternative explanations for long-range communication within proteins have been suggested19. Our proposal is that the sector is the natural consequence of evolutionary constraints not typically considered in protein engineering or biophysical models, primarily of the need for adaptive variation in response to fluctuating conditions of fitness. By placing the constraints on native folding and function on sector positions, this architecture might provide the capacity for rapid adaptive variation through mutation of a few cooperatively acting residues. If so, the plurality of non-sector positions, regardless of structural location, should display much more mutation tolerance and less adaptive potential.
Previous studies have tested the role of sectors in protein function using targeted mutagenesis of a few amino acid positions1, 2, 3, 13, 14, 15, 16, 20. Although useful, these studies cannot convincingly test the sector hypothesis posed here, mainly due to the limited scale of experimentation. To address this, we developed a quantitative high-throughput method based on next-generation sequencing suitable for a large-scale mutational analysis of proteins in a cellular context (Fig. 2 and Supplementary Fig. 2). The method is implemented here for comprehensive single mutagenesis in one representative member of the PDZ family of protein interaction modules (PSD95pdz3) as a model system, but could be used for the study of many other proteins and for higher-order mutational studies (F.J.P. and R.R., unpublished observations).
Figure 2. Complete single mutagenesis in PSD95pdz3.

a, The data matrix showing —the functional cost of every mutation x at each position i relative to wild-type PSD95pdz3—colorimetrically, with blue representing loss-of-function and red representing gain-of-function mutations. The wild-type amino acid at each position is indicated by bold squares in the grid. The average functional cost of each amino acid substitution over all positions ( ) is shown at the right. b, The functional cost of all amino acid substitutions at each position shown as the average taken over each column ( ). c, A histogram of the data in panel b indicates positions with a significant effect (>2σ, 20 out of 83). d, Mapping of the 20 functionally significant positions on the PSD95pdz3 structure, the peptide ligand shown as yellow stick bonds. These positions comprise a distributed, physically contiguous network built around the binding pocket and extending through the protein structure.
The method involves three components: (1) a bacterial two-hybrid (B2H) system modified from a previous study21 in which the ability of PSD95pdz3 to bind its cognate ligand (-TKNYKQTSV-COOH, derived from the cysteine-rich interactor of PDZ (CRIPT)22) is quantitatively linked to the expression of enhanced green fluorescent protein (eGFP) (Supplementary Fig. 2a); (2) a fluorescence-activated cell sorting (FACS) step, in which bacterial populations carrying large libraries of mutations in the protein are selected for those cells displaying eGFP levels above a specified threshold (Supplementary Fig. 2b, c); and (3) Solexa high-throughput sequencing to determine the frequency of each allele in the unselected and selected populations 23, 24, 25, 26 (Supplementary Fig. 2c). The effect of each mutation is then expressed as the log frequency of observing each amino acid x at each position i in the selected (sel) versus the unselected (unsel) population, relative to wild type (WT):
In this assay, mutations that show no functional effect should show a relative frequency in the selected population that is identical to wild type ( ), and deviations from this expectation should provide a quantitative measure of the functional effect of each mutation. Tuning of growth and induction parameters and introduction of a point mutation in the bateriophage λ-cI at Glu 34 (ref. 27) (Supplementary Fig. 3), led to experimental conditions that showed a near-linear relationship between the binding free energy of the PSD95pdz3 ligand interaction (ΔGbind) and over the range of binding affinities reported for natural PDZ domains (~0.1–200 μM; Supplementary Figs 2d and 4).
We used the B2H-sequencing assay to carry out a complete single-mutation scan for the PSD95pdz3 domain in which every position shared with the overall PDZ family (83 total) is individually mutated to every other amino acid (Fig. 2a, 83 positions × 19 mutations + wild type = 1,578 variants). The data reveal several aspects of the global pattern of mutational sensitivity in the protein. First, the effect of each amino acid substitution averaged over all positions (across rows in the data matrix) is what might be predicted from the chemical properties of the side chains ( , Fig. 2a, right). Proline is the most unfavourable substitution, followed by amino acids that are formally charged at neutral pH (Asp, Glu, Lys and Arg), and by tryptophan, the volumetrically largest side chain. Substitutions to alanine or cysteine introduce the least perturbation on average, consistent with their use for scanning mutation or solvent accessibility studies, respectively.
To examine the position-specific effects of mutation in PSD95pdz3, we considered both the full data matrix (Fig. 2a) and the average effect of all mutations per position , (Fig. 2b, c). This analysis indicates a heterogeneous, distributed and physically contiguous network of functional residues in PSD95pdz3 (Fig. 2b–d). Most positions show little effect on mutation, tolerating nearly every substitution even if radically different in chemical character (Fig. 2a–c and Supplementary Fig. 5). This includes some that are in direct contact with peptide ligand (for example, 326 and 380), and some that are buried in the protein core and largely conserved (for example, 314, 316, 356, 357 and 390). By contrast, a subset of positions (20 out of 83, Fig. 2c) shows significant sensitivity to mutation (>2σ from mean). Within the binding pocket, His 372 tolerates essentially no other substitution and Leu 323, Phe 325, Ile 327, and Leu 379 show tolerance to only the most chemically conservative mutations. However, outside the direct spatial environment of the ligand, Gly 329, Gly 330, Ile 336, Ala 347, Leu 353, Val 362 and Ala 375 comprise a subset of buried residues that also show significant sensitivity to mutation—the largest average mutational effect in the whole protein comes from position 329.
Analysis of the relationship between this global mutational analysis and the protein sector in the PDZ domain (Fig. 3a, top) shows that sector positions selectively comprise the tail region of the distribution of mutational sensitivity. Of 81 positions tested and statistically well-represented in the PDZ multiple sequence alignment (MSA), 20 positions show a significant functional effect (Fig. 2b, c), and 15 of these are sector positions (out of 20 sector positions in total) (Fig. 1 and Supplementary Fig. 1), indicating very strong statistical correlation between sector positions and functional effect on mutation (P < 10−8, Fisher’s exact test, Supplementary Fig. 6a). This correlation is robust to cut-offs used for both categories (Supplementary Fig. 6b).
Figure 3. The relationship of mutational sensitivity of positions to the protein sector.

a, The distribution of mutational effect in PSD95pdz3 (grey), overlaid with distributions (in black) of sector, core (solvent accessibility < 0.15), positionally conserved (relative entropy >1, the mean value over all positions in the MSA) and ligand contacting positions (within 4 Å shell of ligand atoms). b–d, Slices through the core of PSD95pdz3, showing mutationally significant core positions (dark blue), mutationally non-significant core positions (cyan), and the sector (orange mesh). All non-core positions are in grey, with the peptide ligand shown in yellow stick bonds.
Furthermore, the analysis shows that more standard measures for predicting functional importance of amino acids—such as burial in the protein core, positional conservation and contact with ligand—can also identify functional sites, but these criteria are not good overall descriptors of the data. Indeed, there are more conserved and buried positions that show no significant effect on mutation than otherwise (Fig. 3a, middle panels). Spatial proximity to ligand is the least likely hypothesis for explaining functional importance (Fig. 3a, bottom), consistent with the observations that not every direct interaction with ligand contributes to binding energy28 and that non-local sites can influence active site function indirectly2. Serial slices through the core of the PSD95pdz3 domain are also consistent with these observations; the sector (Fig. 3b–d, orange mesh) largely captures the functional subset of core positions (dark blue spheres) embedded among many other non-functional core positions (cyan spheres). We conclude that the main functional constraints on the PDZ domain are localized within the distributed network of amino acid positions that define the sector.
To determine whether the sector specifically encodes the ability to adapt to altered selection pressures, we repeated the global single-mutation study in PSD95pdz3, challenging the domain to bind a non-native peptide ligand (T−2F, -TKNYKQFSV-COOH, indicating a Thr to Phe mutation at the minus two position; ligand positions are numbered in reverse order from the carboxy terminus (position 0)) (Supplementary Fig. 7). T−2F switches the CRIPT PDZ ligand from class I (-S/T-X-Ψ-COOH, where X is any amino acid, Ψ is hydrophobic) to class II (-X-Ψ-X-Ψ-COOH) specificity, and represents a substantial but physiologically relevant variation in PDZ function29. Accordingly, PSD95pdz3 binds to the T−2F peptide with an approximately 45-fold decrease in binding affinity compared with the wild-type class I ligand (Fig. 4f).
Figure 4. Adaptation through sector variation.

a, Average mutational effect in PSD95pdz3 when binding the wild-type ligand CRIPT ( , top) or a class-switching T−2F variant ( , bottom). T−2F involves a Thr to Phe mutation at position minus two of the peptide ligand (Fig. 1a). b, The difference, or epistasis, between mutational effects for binding wild-type or T−2F ligands, shown either averaged over amino acids at each position (top, ) or broken down by amino acid (bottom, ). The nine positions showing statistically significant epistasis (c) are numbered, and the asterisks mark positions where mutations on average can be positively selected for the T−2F ligand. c, A histogram of epistasis between mutations at each position in PSD95pdz3 and the T−2F ligand variation. d, A mapping of epistatic positions (red) on the structure of PSD95pdz3; the wild-type peptide ligand is shown in yellow stick bonds, the T−2 position is indicated in red and sector positions are in blue mesh. The positions showing mutational epistasis with T−2F comprise a physically distributed network propagating from the T−2 position, and are entirely composed of sector positions. The asterisks are as in b. e, The B2H and sequencing data for sector positions 330 and 372 when binding CRIPT (Fig. 2c) or T−2F (Supplementary Fig. 7) ligands suggest mutations for altering the specificity of PSD95pdz3 towards T−2F; the wild-type amino acid is underlined. f, Binding affinities for purified PSD95pdz3 carrying the Gly330Thr and His372Ala mutations both singly and together. Gly330Thr displays high affinity but non-specific binding for CRIPT and T−2F ligands, His372Ala shows a partial specificity switch towards T−2F and the double mutant represents a complete specificity switch for these two ligands.
We measured the difference in the functional effect of mutations when binding either the wild-type or T−2F ligands, a global analysis of the context dependence (or epistasis) between every mutation of every position in PSD95pdz3 and the T−2F mutation on the peptide ligand (Fig. 4a, b). The data show that nearly all mutations at positions in PSD95pdz3—even if they have an absolute effect on ligand binding—show the same effect on binding the T−2F ligand as for the wild-type ligand, resulting in no significant epistasis with the T−2F mutation (Fig. 4c). These positions are insensitive to the switch in peptide identity and would therefore be non-adaptive with regard to this perturbation. However, mutations at nine positions in PSD95pdz3 show statistically significant epistasis with the T−2F mutation (Fig. 4b, c); these positions show a mutational response that depends on the identity of the target ligand. These positions uniformly show an effect on mutation that is less deleterious for the T−2F ligand than for the wild-type ligand (Fig. 4b, red pixels). All of these positions are within the sector (Fig. 4d, see overlap between sector (blue mesh) and epistatic positions (red)), and map out a pattern of epistasis for the T−2F mutation that involves a spatially distributed network in the PDZ protein structure comprising residues both near and far from the minus two ligand position (Figs. 1a and 4d).
A subset of the sector positions (322, 330, 336 and 372) shows such extreme epistasis that the positions flip in the direction of mutational effect between the wild-type and T−2F ligands (Fig. 4a, b, d). Mutations at these positions destabilize or are neutral for binding to the wild-type ligand, but are favourable for binding the T−2F ligand and would therefore be selected when challenged to bind this class-switching variant. Notably, only one of the selectable sites (372) directly contacts the T−2 ligand position. The other sites are located either one shell (329, 330) or two shells (336) of residues away from the binding pocket, or act at a distance from a loop contacting the terminal carboxylate of the ligand (322; Fig. 4d). We also find that for these few sites of selection for T−2F, it is not merely one or two mutations, but nearly every substitution that shows the effect of stabilizing binding to the T−2F ligand (Fig. 4b and Supplementary Fig. 7).
These data describe many potential mutational routes for switching the binding specificity PSD95pdz3 towards the class II T−2F ligand. For example, mutation of position 330, which does not contact ligand (Fig. 4d), to threonine is expected to moderately destabilize binding to wild-type CRIPT ligand, but is the most favourable of all single mutants for the T−2F ligand (Fig. 4e). Also, His372Ala, a mutation at a position directly linking the −2 position of the ligand and position 330 (Fig. 4d), is expected to decrease binding for CRIPT more strongly than the Gly330Thr mutation, but to increase binding for T−2F to a similar degree (Fig. 4e). Binding affinities for Gly330Thr, His372Ala and the double mutant combination were measured using a fluorescence polarization assay and show excellent consistency with the B2H data (Fig. 4f). His372Ala converts PSD95pdz3 from a protein with an approximately 45-fold preference for the CRIPT ligand to one with about a 14-fold preference for the T−2F ligand, a partial specificity switch from a single mutation. By contrast, Gly330Thr converts PSD95pdz3 to a domain with an unexpected phenotype: high-affinity but non-specific recognition of both CRIPT and T−2F ligands. Such a phenotype could be evolutionarily important when a mutational path characterized by a promiscuous but biologically functional intermediate is advantageous. Finally, the combination of both mutations (Gly330Thr and His372Ala) completes the specificity switch; this double mutant displays an approximately 45-fold preference for the T−2F ligand. These data demonstrate that short, cooperative paths of mutation within the sector can suffice to change functional specificity quantitatively.
In summary, the data presented here indicate that protein robustness and adaptability can be explained through a model in which the main functional constraints are loaded in the sector—a sparse, collectively evolving network within the protein structure. By saturation point mutagenesis, we find that sector positions selectively resist variation when challenged with wild-type ligand, but can flip to promote variation when challenged with a functionally distinct ligand. This epistatic coupling between ligand and sector underlies efficient functional adaptation, permitting considerable changes in specificity through very few mutations. Turned around, these data provide support for the hypothesis that the sector architecture might be the natural solution to design by evolution under conditions of constantly fluctuating environments. Such environments impose the need for maintaining robustness to mutation and adaptability to varying selection pressures and have been shown theoretically to influence the design of evolving systems30. It will be important to now experimentally test the notion that the statistical history of fluctuations in conditions of selection fundamentally defines the physical design of natural proteins.
METHODS
SCA
SCA was carried out on a multiple sequence alignment comprising 240 diverse eukaryotic PDZ domains based on previously reported methods1 but using an updated version (v5.0) of the SCA MATLAB toolbox (O. Rivoire, S. Leibler and R. R. manuscript in preparation). A multiple sequence alignment can be represented mathematically as a three-dimensional binary tensor (M sequences by L positions by 20 amino acids) whose elements are 1 if sequence s has amino acid a at position i, and 0 otherwise. The frequency of each amino acid a at each position i is simply the number of sequences with amino acid a at i divided by the total number of sequences; this can be written as , in which the angle brackets indicate mean value. The usual definition of a correlation tensor describing the statistical coupling of each pair of amino acids a and b at each pair of positions i and j would be , the joint frequency of observing the two amino acids at the pair of positions minus the expected frequency if the two were statistically independent. However, as described previously1, a basic principle of SCA is to weight the raw correlations by a position specific function of the conservation of the amino acids in question; thus the SCA correlation tensor is , with , and in which qa is the background frequency of amino acid a in the overall non-redundant database of protein sequences. Properties of suggest an approach for reducing this tensor to a matrix of positional correlations in which the overall correlation of all pairs of amino acids at positions i and j is captured in a scalar value1 (O. Rivoire, S. Leibler and R. R., manuscript in preparation). The PDZ sector is defined by positions showing statistically significant weights in the top eigenmode of the matrix (Supplementary Fig. 1). The PDZ sequence alignment, the SCA 5.0 toolbox and a script for carrying out the SCA calculations are available for download from the Ranganathan laboratory website (http://systems.swmed.edu/rr_lab).
Expression and purification of PDZ3 mutants
pGEX-4T-1 plasmids containing Glutathione S-transferase (GST)-fusions of wild-type or mutant PSD95pdz3 cloned into the BsmBI/XbaI sites were used to transform BL21(DE3) bacterial cells and grown overnight on LB plus 100 μg ml−1 ampicillin plates. MDG minimal media cultures were inoculated with streaks of fresh-transformants and grown overnight. Expression was carried out using an auto-induction protocol31: 1 l cultures in ZYM-5052 plus 50 μg ml−1 ampicillin were inoculated with 1 ml starter culture, grown at 37 °C until attenuance (D600 nm) of around 0.5, cooled on ice, and induced at 20 °C until growth plateaued (usually at 16–18 h). Cells were collected at 500g for 15 min and resuspended in 35 ml with NMR buffer (25 mM KHPO4, 50 mM NaCl, 1 mM EDTA, pH 7.0) plus 1 mM phenylmethylsulphonyl fluoride (PMSF),10 μg ml−1 leupeptin, 2 μg ml−1 pepstatin and frozen in liquid N2 for storage at −80 °C.
Frozen pellets were slow-thawed in an ice and water bath and cells were lysed by sonication with a 1.9-cm dual tip (10 s on, 5 s off cycles, 5 min total). Lysate was cleared by centrifugation at 50,000g for 1 h, and incubated for 1 h at 4° C with 2 ml glutathione sepharose (GE-Amersham) pre-equilibrated in NMR buffer. The resin was washed three times with 25 bed volumes of PBS (10 mM Na2HPO4, 1.8 mM KH2PO4, 140 mM NaCl, 2.7 mM KCl, pH 7.4) and three times with 25 bed volumes of NMR buffer. To cleave the GST tag the resin was resuspended in 1.8 ml NMR buffer, incubated with 20 U thrombin for 12 h at room temperature or until cleavage reached ~75%. PDZ domains were recovered from the supernatant by collecting 200 μl elutions until D280 nm < 0.4. Elutions were combined and incubated with 20 μl benzamidine sepharose for 30 min at 4 °C to clear the protease. A disposable column was used to elute the cleaved, thrombin-free PDZ protein. Proteins were checked for purity on SDS–PAGE and concentration was determined using bicinchoninic acid (BCA) (Pierce) assay and normalized to a wild-type PSD95pdz3 preparation that had been analysed using amino acid analysis (University of California Davis, Proteomics Core).
Fluorescence polarization-based assay for peptide binding
Fluorescence polarization measurements were carried out using a tetramethyl rhodamine (TMR)-labelled CRIPT peptide (TMR-TKNYKQTSV-COOH), synthesized by the University of Texas Southwestern Protein Chemistry Core and reconstituted to 100 nM peptide in NMR Buffer with 0.5 % BSA plus 5 mM dithiothreitol (DTT) at pH 7.0. Each purified PDZ protein preparation was diluted to 100 μM. In triplicate, serial dilutions of each PDZ domain were made in an untreated 96-well plate (50 μl volume of 8 concentrations spanning 100 μM to 781 nM). Forty microliters of each PDZ dilution is mixed with 10 μl TMR-labelled peptide solution in a black, clear bottom untreated 384-well, incubated at room temperature for 1 h, and fluorescence polarization (531 nm excitation, 590 nm emission, 1 s integration) was measured using a Perkin Elmer Victor3V plate reader. The data for the three triplicate assays were fit using the saturation binding model in GraphPad prism software and used to extract the equilibrium dissociation constant.
NNS library construction
Comprehensive single mutant libraries were constructed using oligonucleotide-directed mutagenesis of PSD95pdz3. To mutate each position in PSD95pdz3 (positions 311–393), two mutagenic oligonucleotides (one sense, one antisense) were synthesized (IDT) that contain sequence complementary to 15 base pairs (bp) on either side of the targeted position. For the targeted position, the oligonucleotides contain NNS codons, in which N is a mixture of A, T, C and G, and S is a mixture of G and C. This biased randomization results in 32 possible codons with all 20 amino acids sampled—a significant decrease in library complexity without loss of amino acid complexity. One round of PCR was carried out with either the sense or antisense oligonucleotide and a flanking antisense or sense oligonucleotide. A second PCR round using a combination of the first round products and both flanking primers produced the full-length double stranded product. For the 83 positions randomized here, this constituted 83 × 2 first round PCR reactions and 83 second round reactions, for a total of 249 PCR reactions. All reactions yielded a single intense band on an agarose gel. PCR product concentrations were measured using Picogreen (Invitrogen), pooled in equimolar ratios, purified, digested and ligated into the B2H λ-cI fusion expression vector. Each ligation was purified, eluted into 7 μl dH2O, and measured in the B2H assay as described earlier. Each transformation yielded greater than 106 variants.
To permit coverage of the full PSD95pdz3 gene (~300 bp) with 75-base paired-end reads by Solexa sequencing, we split the PSD95pdz3 sequence into three subgroups (positions 311–338, 339–365 and 366–393, respectively). The NNS-mutagenesis products for the positions of each subgroup were mixed and ligated as a single library. Each subgroup was independently subject to the B2H assay, FACS, amplification and sample preparation for Solexa sequencing (see later).
The B2H assay
Electrocompetent MC4100-Z1 cells32 containing pZE1RM-eGFP (ampicillin resistant) and pZA31-RNAα-CRIPT (chloramphenicol resistant)33 plasmids were transformed with 1 μl of 20 ng μl−1 pZS22-PDZ3-WT (kanamycin resistant) plasmid and recovered for 1 h in ZYM-505 media. To quantify library complexity, 1 μl recovered transformation mixture was plated on LB plus kanamycin. The entire 1 ml transformation was then added to 10 ml ZYM-505 (ref. 31) plus kanamycin. The entire 1 ml transformation was then added to 10 ml ZYM-505 (ref. 31) plus kanamycin (30 μg ml−1) and ampicillin (50 μg ml−1) and chloramphenicol (25 μg ml−1) in a 50 ml baffled flask, grown 6 h at 37 °C at 225 r.p.m., then diluted 10 μl culture into 10 ml ZYM-505 plus antibiotics, and grown 12 h at 37°C at 225 r.p.m., and finally measured for attenuance (D) at 600 nm. A 35 μl aliquot of each culture was added to one well of a 48-well plate containing 500 μl LB with antibiotics plus anhydrotetracycline (100 ng ml−1) plus isopropylthiogalactoside (IPTG) (100 μM) for a final D600 = 0.4, and incubated at 18 °C, 150 r.p.m. for 2 h for induction. Induced cells were diluted to 30 μl cells in 1 ml filter-sterilized M9 plus 0.4% glucose for flow cytometry. Before analysis or sorting, cells were passed through a 30-gauge needle for disaggregation to single cells.
All flow cytometry was performed with standardized settings on a BD FACScan, setup to measure GFP fluorescence (FL1). Cell sorting was performed on the BD FACSAria by technicians in the UT Southwestern Medical Center cytometry core. For library selections, flow-cytometry gates were placed relative to the fluorescence distribution of WT-PDZ3 to control for systematic assay-to-assay variability. For each NNS library, two populations were collected at gates set at the top 10 and 25% of the WT-PDZ3 distribution. When sorting a complex library of PDZ3 mutants, a positive cell population numbering greater than 1,000 times the complexity of the library was collected. Cells were sorted into chilled rich medium (ZYM-505 without antibiotics, 4 °C), and the collection tube was kept chilled in the cytometer during sorting to maximize cell viability. Typical viability of sorted cell populations were >70 % when plated on selective medium.
Identification of λ-cI Glu34Pro to increase B2H dynamic range
An initial problem with dynamic range in the B2H assay was high basal activity, such that eGFP was expressed to some degree even without PDZ domain function. A mechanistic explanation for this high basal activity was suggested by the observation that one of the λ-cI-binding sites on the eGFP promoter is sufficiently close to the RNA polymerase σ subunit as to activate transcription through direct (PDZ-independent) contact. Previous studies showed one λ-cI position (Glu 34) underlies this non-specific mode of transactivation27,34,35. To identify λ-cI variants with reduced basal activity, a library of all possible amino acid substitutions at position 34 (Glu34X) was cloned and expressed in the B2H assay as described earlier. Induced B2H Glu34X libraries containing wild-type PSD95pdz3 and CRIPT peptide (high-affinity interaction) were plated on selective medium, and the GFP intensity of hundreds of colonies was visually assessed using a wide-field fluorescence microscope. Twenty colonies with high intensity were picked, pooled, grown in liquid culture and miniprepped to isolate plasmid DNA. This library of high intensity clones was then induced in the B2H assay containing a peptide that should not bind wild-type PSD95pdz3 (-TKNYKQGGG) for negative selection. This library was plated on selective medium and four colonies with low intensity were picked and sequenced. All four colonies contained the Glu34Pro λ-cI variant, suggesting that this variant should provide an increased dynamic range for the B2H assay. This prediction was confirmed in the standard B2H assay using a set of PSD95pdz3 mutants as described in Supplementary Fig. 2.
Solexa sequencing
Sorted cell populations were diluted into ZYM-505 plus kanamycin and grown 12 h at 37 °C with shaking (250 r.p.m.). Overnight cultures were centrifuged and miniprepped (Promega wizard plus SV miniprep kit). Purified DNA was quantified (Nanodrop ND-1000 Spectrophotometer), and 200 ng of plasmid DNA per 50 μl PCR reaction was used as template for the first round of adaptor addition. To preserve the ratio of template alleles, we used a large template concentration and few amplification cycles (16 cycles). This first PCR reaction added the Solexa paired-end sequencing oligonucleotide annealing site as well as a 3-bp barcode that indicates the origin of the sample (input or selected library, selection gate). The second PCR reaction added the remainder of the sequencing oligonucleotide annealing site and the annealing site for the flow cell oligonucleotide. All oligonucleotides were purchased from IDT as 100 nM syntheses with standard purification. Each PCR reaction included 5% dimethylsulphoxide (DMSO) and produced a single intense band on an agarose gel.
The second round PCR products were purified (ZYMO DNA clean and concentrator-5 Kit) and eluted in 20 μl dH2O. Purified PCR products were quantified (Invitrogen quant-IT picogreen dsDNA quantification kit) in triplicate using lambda-DNA as a standard. PCR products were diluted to 10 nM and 8 pmol was loaded onto a Solexa v4 PE-flow cell in the University of Texas Southwestern Genome Sequencing Core that yielded 250,000–300,000 clusters per lane. Owing to the unbalanced nature of the first bases of each PCR product, a PhiX control lane was used for matrix and phasing calculations as per manufacturer recommendation.
Sequences from the Illumina RTA base-caller were imported into CLC Genomics Workbench as ‘.qseq’ files and trimmed for quality using a cut-off of 0.05 for the modified Mott algorithm. Bases that did not pass the trim filter were deleted from each read, and reads shorter than 49 bp were discarded. Reads were sorted into groups according to the 3-bp barcode contained in each PCR product, and barcode groups were exported as FASTQ files for further analysis. Custom software written in MATLAB was used to count the number of occurrences of each allele in each population. The functional effect of each allele was calculated as the average of the value from the two FACS gates (Supplementary Fig. 4).
Supplementary Material
Acknowledgments
We thank W. Russ, P. Mishra and other members of the Ranganathan laboratory for contributions to this work, W. Wakeland and C. Liang for assistance with Solexa sequencing, E. Curry and A. Mobley for assistance with flow cytometry, and M. Elowitz for providing the bacterial 2-hybrid plasmids. We acknowledge support from the University of Texas Southwestern Graduate School and Pharmacology Training Grant (R. N. M.), the Helen Hay Whitney Fellowship program (F.J.P.) and support from the National Institutes of Health (R01EY018720-05, R.R.), The Robert A. Welch Foundation (I-1366, R.R.) and the Green Center for Systems Biology (R.R.).
Footnotes
Supplementary Information is available in the online version of the paper.
Author Contributions R.N.M. and R.R. developed the research plan and experimental strategy. R.N.M. built the B2H assay, collected the data and wrote and executed the code for analysis of the B2H and sequencing data. F.J.P. and W.S.G. improved the dynamic range of the B2H assay. A.R. carried out the mutational analysis in Fig. 4e, f. R.N.M. and R.R. analysed the data and wrote the paper.
Reprints and permissions information is available at www.nature.com/reprints.
The authors declare no competing financial interests.
Readers are welcome to comment on the online version of the paper.
References
- 1.Halabi N, Rivoire O, Leibler S, Ranganathan R. Protein sectors: evolutionary units of three-dimensional structure. Cell. 2009;138:774–786. doi: 10.1016/j.cell.2009.07.038. [DOI] [PMC free article] [PubMed] [Google Scholar]
- 2.Lockless SW, Ranganathan R. Evolutionarily conserved pathways of energetic connectivity in protein families. Science. 1999;286:295–299. doi: 10.1126/science.286.5438.295. [DOI] [PubMed] [Google Scholar]
- 3.Russ WP, Lowery DM, Mishra P, Yaffe MB, Ranganathan R. Natural-like function in artificial WW domains. Nature. 2005;437:579–583. doi: 10.1038/nature03990. [DOI] [PubMed] [Google Scholar]
- 4.Socolich M, et al. Evolutionary information for specifying a protein fold. Nature. 2005;437:512–518. doi: 10.1038/nature03991. [DOI] [PubMed] [Google Scholar]
- 5.Süel GM, Lockless SW, Wall MA, Ranganathan R. Evolutionarily conserved networks of residues mediate allosteric communication in proteins. Nature Struct Mol Biol. 2003;10:59–69. doi: 10.1038/nsb881. [DOI] [PubMed] [Google Scholar]
- 6.Bershtein S, Segal M, Bekerman R, Tokuriki N, Tawfik DS. Robustness-epistasis link shapes the fitness landscape of a randomly drifting protein. Nature. 2006;444:929–932. doi: 10.1038/nature05385. [DOI] [PubMed] [Google Scholar]
- 7.Bloom JD, Labthavikul ST, Otey CR, Arnold FH. Protein stability promotes evolvability. Proc Natl Acad Sci USA. 2006;103:5869–5874. doi: 10.1073/pnas.0510098103. [DOI] [PMC free article] [PubMed] [Google Scholar]
- 8.Draghi JA, Parsons TL, Wagner GP, Plotkin JB. Mutational robustness can facilitate adaptation. Nature. 2010;463:353–355. doi: 10.1038/nature08694. [DOI] [PMC free article] [PubMed] [Google Scholar]
- 9.Tiana G, Shakhnovich BE, Dokholyan NV, Shakhnovich EI. Imprint of evolution on protein structures. Proc Natl Acad Sci USA. 2004;101:2846–2851. doi: 10.1073/pnas.0306638101. [DOI] [PMC free article] [PubMed] [Google Scholar]
- 10.Voigt CA, Kauffman S, Wang ZG. Rational evolutionary design: the theory of in vitro protein evolution. Adv Protein Chem. 2000;55:79–160. doi: 10.1016/s0065-3233(01)55003-2. [DOI] [PubMed] [Google Scholar]
- 11.Anfinsen CB. Principles that govern the folding of protein chains. Science. 1973;181:223–230. doi: 10.1126/science.181.4096.223. [DOI] [PubMed] [Google Scholar]
- 12.Reynolds KA, McLaughlin RN, Ranganathan R. Hot spots for allosteric regulation on protein surfaces. Cell. 2011;147:1564–1575. doi: 10.1016/j.cell.2011.10.049. [DOI] [PMC free article] [PubMed] [Google Scholar]
- 13.Peterson FC, Penkert RR, Volkman BF, Prehoda KE. Cdc42 regulates the Par-6 PDZ domain through an allosteric CRIB-PDZ transition. Mol Cell. 2004;13:665–676. doi: 10.1016/s1097-2765(04)00086-3. [DOI] [PubMed] [Google Scholar]
- 14.Hatley ME, Lockless SW, Gibson SK, Gilman AG, Ranganathan R. Allosteric determinants in guanine nucleotide-binding proteins. Proc Natl Acad Sci USA. 2003;100:14445–14450. doi: 10.1073/pnas.1835919100. [DOI] [PMC free article] [PubMed] [Google Scholar]
- 15.Shulman AI, Larson C, Mangelsdorf DJ, Ranganathan R. Structural determinants of allosteric ligand activation in RXR heterodimers. Cell. 2004;116:417–429. doi: 10.1016/s0092-8674(04)00119-9. [DOI] [PubMed] [Google Scholar]
- 16.Smock RRO, Russ WP, Swain JF, Leibler S, Ranganathan R, Gierasch LM. An interdomain sector mediating allostery in Hsp70 molecular chaperones. Mol Syst Biol. 2010;6:414. doi: 10.1038/msb.2010.65. [DOI] [PMC free article] [PubMed] [Google Scholar]
- 17.Bradley P, Misura KMS, Baker D. Toward high-resolution de novo structure prediction for small proteins. Science. 2005;309:1868–1871. doi: 10.1126/science.1113801. [DOI] [PubMed] [Google Scholar]
- 18.Kuhlman B, et al. Design of a novel globular protein fold with atomic-level accuracy. Science. 2003;302:1364–1368. doi: 10.1126/science.1089427. [DOI] [PubMed] [Google Scholar]
- 19.Hilser VJ, Thompson EB. Intrinsic disorder as a mechanism to optimize allosteric coupling in proteins. Proc Natl Acad Sci USA. 2007;104:8311–8315. doi: 10.1073/pnas.0700329104. [DOI] [PMC free article] [PubMed] [Google Scholar]
- 20.Chi CN, et al. Reassessing a sparse energetic network within a single protein domain. Proc Natl Acad Sci USA. 2008;105:4679–4684. doi: 10.1073/pnas.0711732105. [DOI] [PMC free article] [PubMed] [Google Scholar]
- 21.Dove SL, Joung JK, Hochschild A. Activation of prokaryotic transcription through arbitrary protein-protein contacts. Nature. 1997;386:627–630. doi: 10.1038/386627a0. [DOI] [PubMed] [Google Scholar]
- 22.Niethammer M, et al. CRIPT, a novel postsynaptic protein that binds to the third PDZ domain of PSD-95/SAP90. Neuron. 1998;20:693–707. doi: 10.1016/s0896-6273(00)81009-0. [DOI] [PubMed] [Google Scholar]
- 23.Adkar BV, et al. Protein model discrimination using mutational sensitivity derived from deep sequencing. Structure. 2012;20:371–381. doi: 10.1016/j.str.2011.11.021. [DOI] [PubMed] [Google Scholar]
- 24.Fowler DM, et al. High-resolution mapping of protein sequence-function relationships. Nature Methods. 2010;7:741–746. doi: 10.1038/nmeth.1492. [DOI] [PMC free article] [PubMed] [Google Scholar]
- 25.Kinney JB, Murugan A, Callan CG, Cox EC. Using deep sequencing to characterize the biophysical mechanism of a transcriptional regulatory sequence. Proc Natl Acad Sci USA. 2010;107:9158–9163. doi: 10.1073/pnas.1004290107. [DOI] [PMC free article] [PubMed] [Google Scholar]
- 26.van Opijnen T, Bodi KL, Camilli A. Tn-seq: high-throughput parallel sequencing for fitness and genetic interaction studies in microorganisms. Nature Methods. 2009;6:767–772. doi: 10.1038/nmeth.1377. [DOI] [PMC free article] [PubMed] [Google Scholar]
- 27.Whipple FW, Ptashne M, Hochschild A. The activation defect of a λ-cI positive control mutant. J Mol Biol. 1997;265:261–265. doi: 10.1006/jmbi.1996.0735. [DOI] [PubMed] [Google Scholar]
- 28.Clackson T, Wells JA. A hot spot of binding energy in a hormone-receptor interface. Science. 1995;267:383–386. doi: 10.1126/science.7529940. [DOI] [PubMed] [Google Scholar]
- 29.Songyang Z, et al. Recognition of unique carboxyl-terminal motifs by distinct PDZ domains. Science. 1997;275:73–77. doi: 10.1126/science.275.5296.73. [DOI] [PubMed] [Google Scholar]
- 30.Kussell E, Leibler S. Phenotypic diversity, population growth, and information in fluctuating environments. Science. 2005;309:2075–2078. doi: 10.1126/science.1114383. [DOI] [PubMed] [Google Scholar]
- 31.Studier FW. Protein production by auto-induction in high density shaking cultures. Protein Expr Purif. 2005;41:207–234. doi: 10.1016/j.pep.2005.01.016. [DOI] [PubMed] [Google Scholar]
- 32.Lutz R, Bujard H. Independent and tight regulation of transcriptional units in Escherichia coli via the LacR/O, the TetR/O and AraC/I1–I2 regulatory elements. Nucleic Acids Res. 1997;25:1203–1210. doi: 10.1093/nar/25.6.1203. [DOI] [PMC free article] [PubMed] [Google Scholar]
- 33.Elowitz MB, Leibler S. A synthetic oscillatory network of transcriptional regulators. Nature. 2000;403:335–338. doi: 10.1038/35002125. [DOI] [PubMed] [Google Scholar]
- 34.Bushman FD, Shang C, Ptashne M. A single glutamic acid residue plays a key role in the transcriptional activation function of lambda repressor. Cell. 1989;58:1163–1171. doi: 10.1016/0092-8674(89)90514-x. [DOI] [PubMed] [Google Scholar]
- 35.Jain D, Nickels BE, Sun L, Hochschild A, Darst SA. Structure of a ternary transcription activation complex. Mol Cell. 2004;13:45–53. doi: 10.1016/s1097-2765(03)00483-0. [DOI] [PubMed] [Google Scholar]
Associated Data
This section collects any data citations, data availability statements, or supplementary materials included in this article.